By Tishan Dahanayakage, Sriskandarajah Suhothayan, Miyuru Dayarathna
Businesses constantly produce large amounts of information in various forms, such as financial transactions, sensor measurements, stock trades, interactions with mobile devices, system logs, website clicks, crowd management13, health monitoring data12, API monitoring data14, notification management data17, real-time ETLs, etc5. Increasingly, digital enterprises depend on streaming analytics and real-time data processing to gain a competitive edge in day-to-day business operations. For some use cases, the value of insights decline with time. Hence, quickly collecting insights and responding to them would likely result in higher profits. Stream processors are software platforms that help achieve these objectives by allowing users to respond to incoming data faster. (Please see What is Stream Processing?4).
Distributed stream processing is a special case of parallel stream processing, where the stream processing application is partitioned into multiple processes that run in multiple networked computers. Stream processors that run multiple processes on the same computer are considered as shared memory parallel stream processing and cannot be considered as distributed stream processing.
WSO2 Stream Processor (WSO2 SP) is an open source, scalable, and cloud native stream processing platform from WSO2 (see Figure 1). In addition to its support for general stream processing constructs, WSO2 SP allows users to perform complex event processing, incremental time series aggregation, and machine learning. WSO2 SP also has the capability to perform natural language processing (NLP), geo fencing, and sentiment analysis. Many others are available at its extension store. The platform processes streaming data in an event-by-event basis, where input events can come from various event sources, such as Kafka, JMS, MQTT, websockets, APIs, email systems, etc. These events are consumed and analyzed by the stream processor core using its Siddhi stream processing engine15. The resulting output events are notified to various event sinks via API calls, emails, and systems such as Kafka, JMS, MQTT, websockets, etc. Streaming analytics can also be performed by combining streaming data with the data at rest stored in RDBMS, HBase, MongoDB and others using the intuitive Siddhi Streaming SQL8. WSO2 SP also has a browser-based rich developer studio, which provides time-saving development experience16 with query authoring, event simulation, playback and debugging support.

Figure 1: WSO2 Stream Processor architecture
This white paper describes WSO2 SP’s overall distributed stream processing system architecture3, 6. First, it presents an example case study and the need for performing distributed stream processing. Next, it presents reference architecture for a typical distributed stream processing system. Then, it provides a description of WSO2 Stream Processor and how it fits with the reference architecture. Next, it describes how the case study application becomes converted into a distributed stream processing application. Finally, it discusses some of WSO2 SP’s key aspects that enable distributed stream processing.
Let’s consider a use case to build a streaming application that monitors home appliances to detect anomalies in energy usage. When the application detects higher-than-normal power consumption from a kitchen appliance, such as an electric kettle, it sends a real-time alert10 to the electricity consumer, so that required action can be taken as soon as possible. This application is shown in Figure 2.

Figure 2: Streaming application to monitor home appliances to detect anomalies in energy usage
In this scenario, the power consumption data collected from each device’s power sensor is sent to WSO2 SP as a stream of events. We want to monitor devices marked as "monitored" and their average power consumption over the past 2 minutes, rather than considering the individual power values. We also want to detect when there is more than a 5-watt increase in average power consumption within 10 minutes, while the device's final power consumption exceeds 100 watts. If these criteria are met, we fetch the device owner’s contact email address and send an alert via email. The Siddhi application code for this scenario can be listed as follows.
Listing 1: Siddhi application for anomaly detection in energy consumption
@App:name('Energy-Alert-App')
@App:description('Energy consumption and anomaly detection')
-- Streams
@source(type = 'http', receiver.url=' ', topic = 'device-power',
@map(type = 'json'))
define stream DevicePowerStream (type string, deviceID string, power int);
@sink(type = 'email', to = '{{autorityContactEmail}}', username = 'john', address = '[email protected]', password = 'test', subject = 'High power consumption of {{deviceID}}',
@map(type = 'text',
@payload('Device ID: {{deviceID}} of room : {{roomID}} power is consuming {{finalPower}}kW/h. ')))
define stream AlertStream (deviceID string, roomID string, initialPower double, finalPower double, autorityContactEmail string);
-- Tables
@Store(type="rdbms", jdbc.url="jdbc:mysql://localhost:3306/sp", username="root", password="root" , jdbc.driver.name="com.mysql.jdbc.Driver",field.length="symbol:100")
define table DeviceIdInfoTable (deviceID string, roomID string, autorityContactEmail string);
-- Queries
@info(name = 'monitored-filter')
from DevicePowerStream[type == 'monitored']
select deviceID, power
insert current events into MonitoredDevicesPowerStream;
@info(name = 'power-increase-pattern')
partition with (deviceID of MonitoredDevicesPowerStream)
begin
@info(name = 'avg-calculator')
from MonitoredDevicesPowerStream#window.time(2 min)
select deviceID, avg(power) as avgPower
insert current events into #AvgPowerStream;
@info(name = 'power-increase-detector')
from every e1 = #AvgPowerStream -> e2 = #AvgPowerStream[(e1.avgPower + 5) <= avgPower] within 10 min
select e1.deviceID as deviceID, e1.avgPower as initialPower, e2.avgPower as finalPower
insert current events into RisingPowerStream;
end;
@info(name = 'power-range-filter')
from RisingPowerStream[finalPower > 100]
select deviceID, initialPower, finalPower
insert current events into DevicesWithinRangeStream;
@info(name = 'enrich-alert')
from DevicesWithinRangeStream as s join DeviceIdInfoTable as t
on s.deviceID == t.deviceID
select s.deviceID as deviceID, t.roomID as roomID, s.initialPower as initialPower, s.finalPower as finalPower, t.autorityContactEmail as autorityContactEmail
insert current events into AlertStream;
The application receives power consumption data from each kitchen appliance as HTTP requests. These requests are converted to Siddhi events and are run through filtering and partitioned event pattern matching operators to identify abnormal power consumption increases. If an anomaly is detected, the electricity consumer’s contact details are fetched from an RDBMS table; the details will be used to send an email alert.
For a small neighborhood, the above application can be easily deployed in a 2-node minimal high available stream processor cluster. However, as time passes, you may want to scale the application further owing to an increase in the number of houses being monitored. Next, let’s consider scenarios where you need to perform such scaling in a distributed cluster.
Stream processing from its inception has had to deal with high volumes of fast-moving data. For a typical stream processor, three kinds of deployments are possible: embedded, 2-node high available (HA), and distributed.
The simplest deployment is running stream processing as an embedded single node. In this scenario, we do not have to worry about programming complexities introduced to the system owing to distributed processing, system failures, consistency guarantee, information security, etc.
Most of the stream processing use cases generally require high availability, which is something we cannot achieve with an embedded single node deployment. To achieve high availability (HA), at least two stream processing nodes are required. WSO2 SP, with its two-node high availability (HA) deployment, can typically handle input throughput upto 100k events per second7.
However, with time, when your business keeps on growing, your stream processing needs may also have to grow owing to additional processing requirements. A two-node deployment might not have enough capacity and resources to process such large volumes of data in real time. Therefore, we need to scale the stream processor to gain high throughput while maintaining low latencies. This scaling can be either vertical (adding more resources such as CPU cores, main memory, disk space, etc.) or horizontal (adding new compute nodes). The main difference between vertical and horizontal scaling is that vertical scaling does not involve any network communications but is limited by resources allocated to the processing node. However, horizontal scaling requires communications over the network and can be bounded by the underlying network’s bandwidth characteristics.
If we look at the hardware trends, Moore’s law explains that the processing power of a processor doubles every 18 months. However, Moore’s law has been struggling to keep up its pace. Even if Moore’s law is not in trouble, it is not possible to wait for 18 months to handle a twofold increase in load. Hence, in the future, we will not be able to achieve high performance by scaling vertically. In the meantime, Nielsen's Law of Internet Bandwidth states that user bandwidth will grow 50% per year, and will continue to remain valid for significantly longer. Therefore, it is more beneficial to distribute workload across compute nodes to exploit their processing power.
In order to handle system scalability issues and leverage hardware trends, it is essential to run the stream processing application in a distributed cluster. Transforming a stream processor running on single node to run on a cluster requires significant changes to its architecture. This is because distributed stream processing has to handle multiple complexities such as communication over the network, fault tolerance of components in cluster, message semantics, and message ordering, which were not present in a single node deployment. These complexities can be handled by a system having some specific architecture characteristics (i.e., reference architecture). Next, in order to tame the complexity of implementing a distributed stream processor, we describe its reference architecture and common components.
Stream processing systems typically consume data streams from multiple sources, process them, and publish the results as notifications. A distributed stream processing deployment multiplies such processes and achieves communication among themselves via messaging transports. The architecture for distributed stream processing can be visualised as shown in Figure 3. The top layer is the User Interface and Dashboard layer, which implements user interaction. The purpose of this layer is to allow the user to perform actions and communicate information such as listed below.
The User interface and Dashboard layer is a thin layer, and it is typically implemented as web applications and dashboards.

Figure 3: Reference Architecture for Distributed Stream Processing
The main tasks are performed by the Management and Processing Layers. The Management layer’s roles include the following:
The Processing layer is the one where rubber meets the road. This simply deploys the application components it receives from the manager. It makes sure the applications run smoothly and produce the expected outcomes. The Processing layer’s operations are closely supported by the Transport layer and the Persistence layer, as shown at the bottom of Figure 3.
The Transport layer performs the following:
Here, the Persistence layer conducts the following key activities,
The Persistence layer consists of long-term data that may be accessed during event processing. The persistence store can be relational databases, NoSQL stores, or even local or distributed file systems.
There are two layers that spread across all of the above-mentioned layers; these are the Observability, and Identity and Access Management layers. The Observability layer is responsible for overall system governance, and it conveys system operational meta information between the different layers. For example, the Observability layer is responsible for conveying system health and system performance information from the Processing layer to the Management layers. The system performance information gathered from performance counters are critical for the effective distributed scheduling conducted by the Management layer. The Identity and Access Management layer is responsible for overall information security of the distributed stream processor. The User Interface and Dashboard layer authenticates and authorizes the users in the system. To further understand this reference architecture, let's observe how it applies to a distributed stream processor in the next few sections.
This section will first list the prerequisites for running a distributed stream processor deployment with WSO2 SP. Next, it will present the deployment architecture for WSO2 SP in distributed mode.
The following minimal requirements should be met for a fault tolerant and distributed stream processing deployment with WSO2 SP.
A user can perform this deployment easily in Kubernetes; refer to the preconfigured Kubernetes artifacts here to get started.
The distributed architecture for WSO2 SP is shown in Figure 4. WSO2 SP has a Dashboard component in the User Interface and Dashboard layer. The Dashboard allows users to view analytics output in an interactive manner. It also conveys observability information of the cluster, status of the list of applications (i.e., Siddhi applications) currently submitted, and the status of each stream processor node. Additionally, Java Virtual Machine (JVM) metrics as well as Siddhi application level metrics can be viewed using this dashboard.
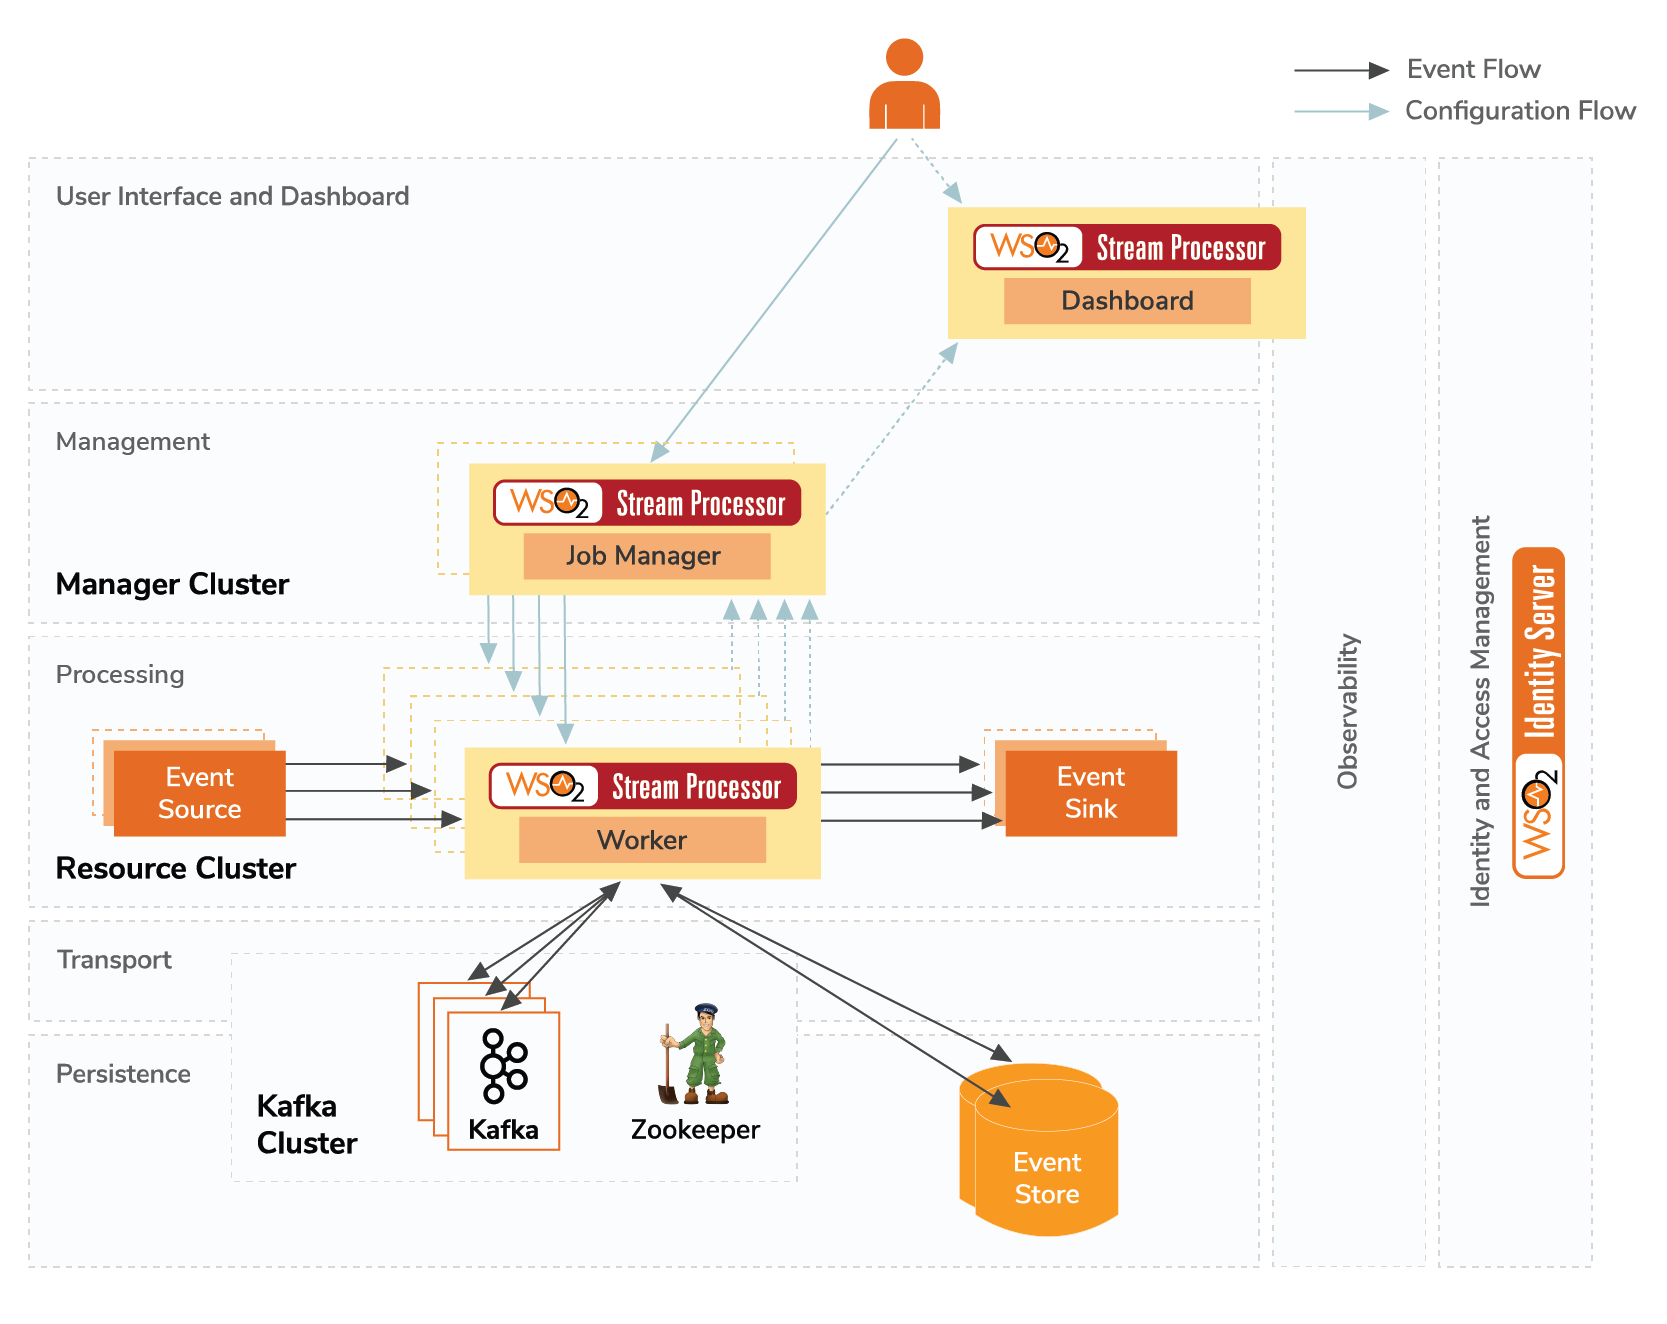
Figure 4: Architecture for WSO2 Stream Processor distributed deployment
Job Manager nodes handle all the Management layer-related functionalities. It contains two WSO2 SP Manager instances configured to run in highly availability mode. The leader election process that occurs between the Manager nodes is shown in Figure 5. At a given time, one Manager node acts as the active node (i.e., leader), while the other Manager node remains as the passive node. The Manager parses the distributed Siddhi application provided by the user, partitions it into multiple Siddhi applications, wires them using Kafka topics, and deploy them in the available worker nodes. The Management layer also handles the effects of the worker nodes joining/leaving the distributed cluster by re-distributing the Siddhi applications accordingly. In Figure 5, the time period “T” is a preconfigured value that is set to 1 second by default.

Figure 5: WSO2 Stream Processor Manager’s leader election process
The Processing layer (also known as the Resource Cluster) is represented by multiple WSO2 SP Worker instances, which are configured as workers. Each WSO2 SP Worker instance in this layer registers themselves to the Manager Cluster when they start, and they periodically send heartbeats to the Manager Cluster, which allows the Managers to identify that they are active. The Worker Nodes (Resource Nodes) run the Siddhi applications assigned to them by their Manager nodes. In addition, they are capable of handling network partitions in a graceful manner, as depicted in the diagram below. The lifecycle of a WSO2 SP Worker node is shown in Figure 6. Note, in this diagram, the “App” corresponds to Siddhi Applications, and the time period “T” is a preconfigured value that is set to 2 seconds by default.

Figure 6: The lifecycle of a WSO2 SP Worker
As depicted in Figure 6, the Worker Node periodically syncs its configurations and the Siddhi Apps with the Manager Node. If the network get partitioned or if the Manager becomes unreachable, it undeploys the apps, allowing them to be rescheduled in other Worker Nodes who are in connection with the Manager Nodes.
Apache Kafka and Apache Zookeeper are two must-haves in order to configure the distributed deployment. As shown in Figure 4, a Kafka cluster, which is part of the Persistence layer and the Transport layer, holds all the topics that are used for communication by distributed Siddhi applications. Persistence stores can be RDBMs databases that store both configuration and system state data. Identity and access management for all the WSO2 SP nodes are handled by an OAuth Identity provider, such as WSO2 Identity Server (WSO2 IS)2. More details on configuring distributed stream processor deployment is described in1.

Figure 7: Architecture of an active-passive manager cluster-based distributed stream processor
At minimum, a distributed stream processor deployment of WSO2 SP has two Manager Nodes configured in an HA cluster. Multiple Workers can join the cluster. The deployment is backed by an Apache Kafka cluster and a relational database server. This deployment architecture is shown in Figure 7.
The complete system setup of the aforementioned distributed stream processor can be easily implemented with WSO2 SP’s cloud native support. Please refer to the preconfigured Kubernetes artifacts here to get started. Next, let’s observe how the distributed stream processor deployment as a containerized application can be observed using the Kubernetes dashboard. First, when the cluster has been started, the startup of the Manager Nodes and joining the clients can be observed using Kubernetes Web UI Logs viewer. Figure 8 depicts how the two Manager Nodes start and three Worker Nodes are deployed in the cluster. The instantiated docker images (i.e., Pods) can be observed as in Figure 8.
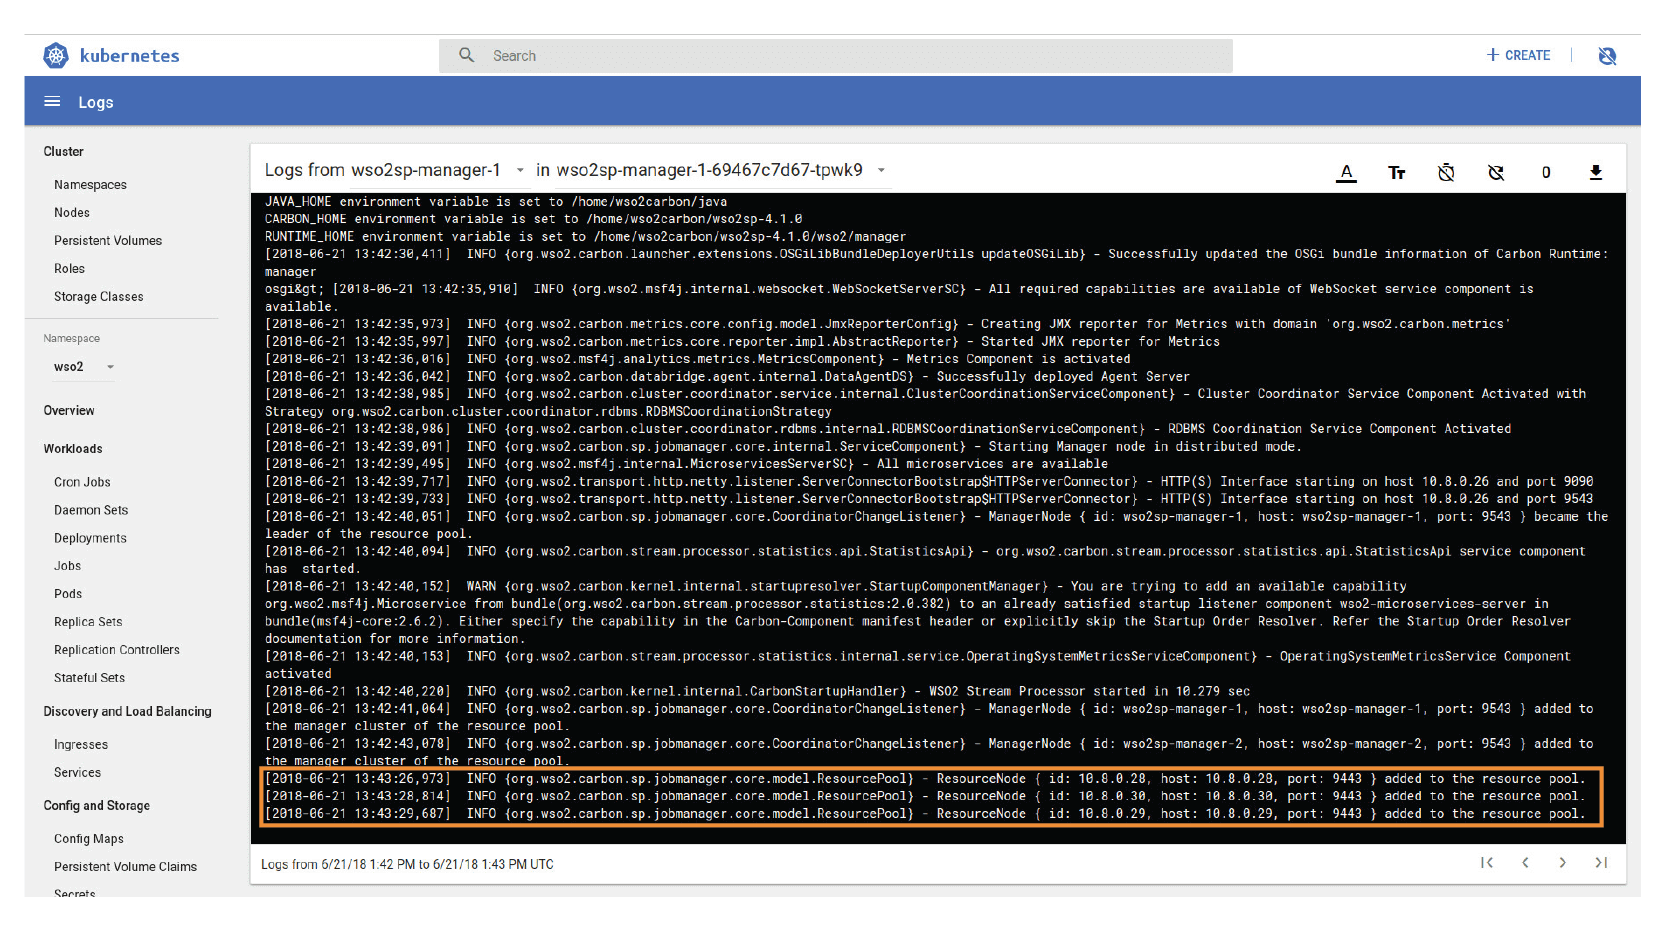
Figure 8: Kubernetes console depicting the start-up process of a WSO2 SP Manager Node
Once the server startup completes, the next task is the deployment of the distributed Siddhi application in the cluster. This is shown in Figure 9. The parent Siddhi application named “TestPlan1” submitted by the user results in 12 partial Siddhi applications. For example, “TestPlan1-001-1” means the parent Siddhi app name is “TestPlan1”, the execution group ID corresponds to “001”, and the rightmost 1 corresponds to the parallelism. If the Siddhi app had specified a parallelism of 3 for a Siddhi app, the Logs viewer will list three partial Siddhi applications: TestPlan1-001-1, TestPlan1-001-2, and TestPlan1-001-3.
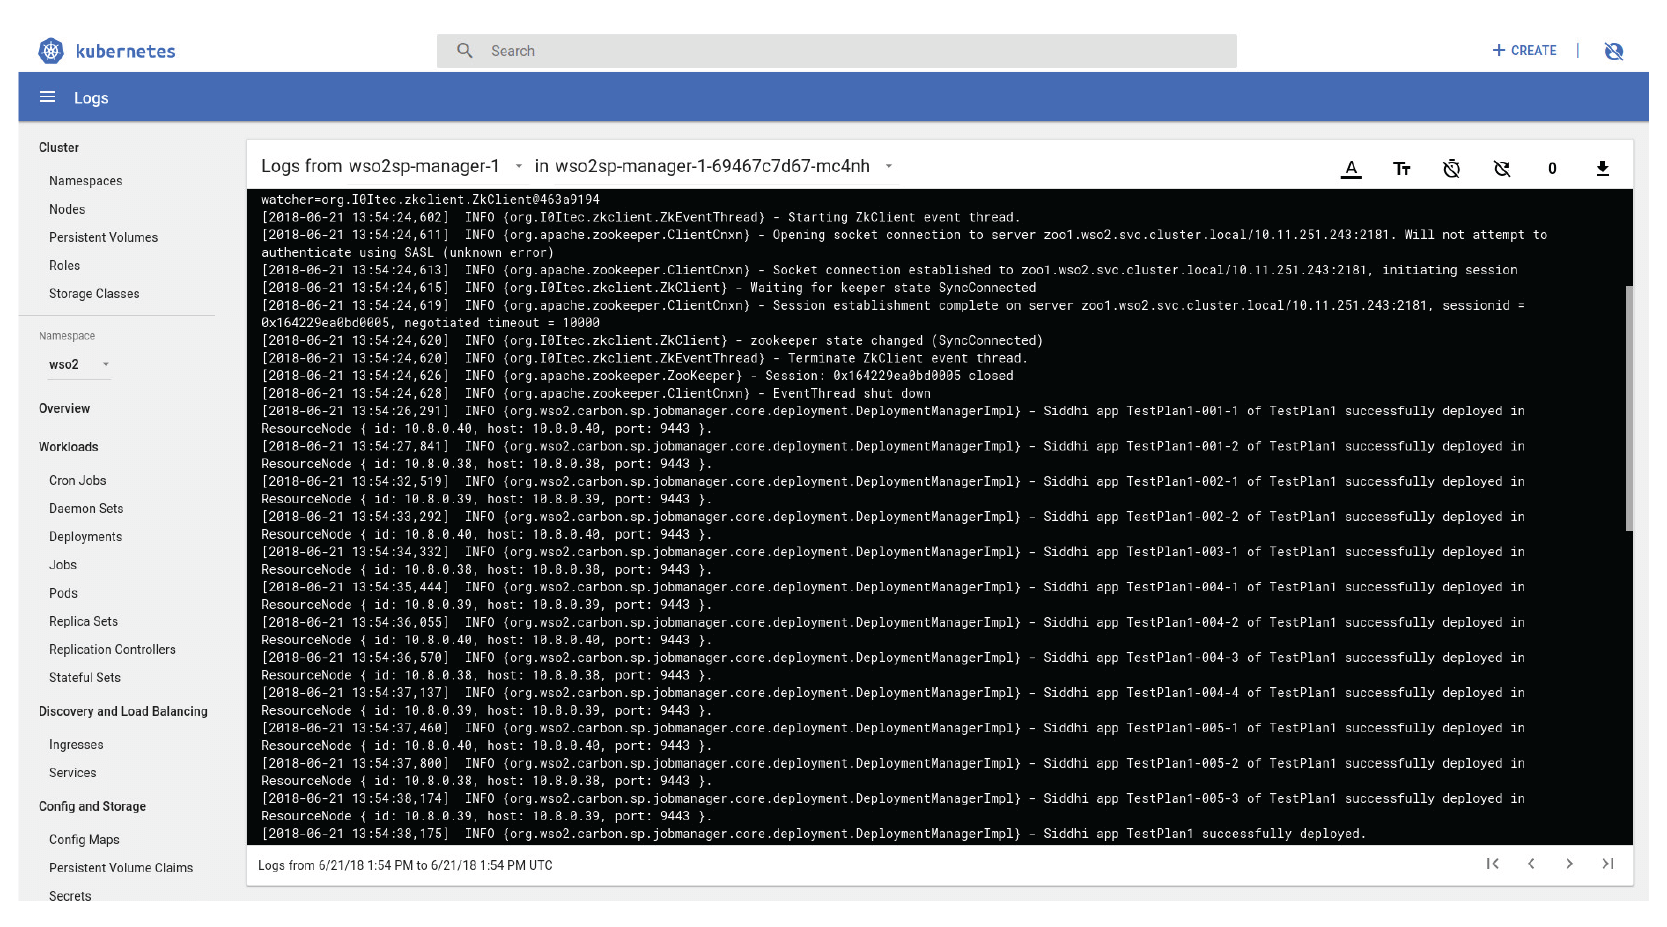
Figure 9: Kubernetes console depicting how a Siddhi application gets deployed
The deployment configurations for the fully distributed deployment of WSO2 SP can be observed in the Kubernetes Web UI, as shown in Figure 10 and Figure 11. These configurations correspond to the cluster shown in Figure 7, but has only one WSO2 SP Worker as a sample. Based on these configurations, the distributed stream processor is initiated in the Kubernetes environment.
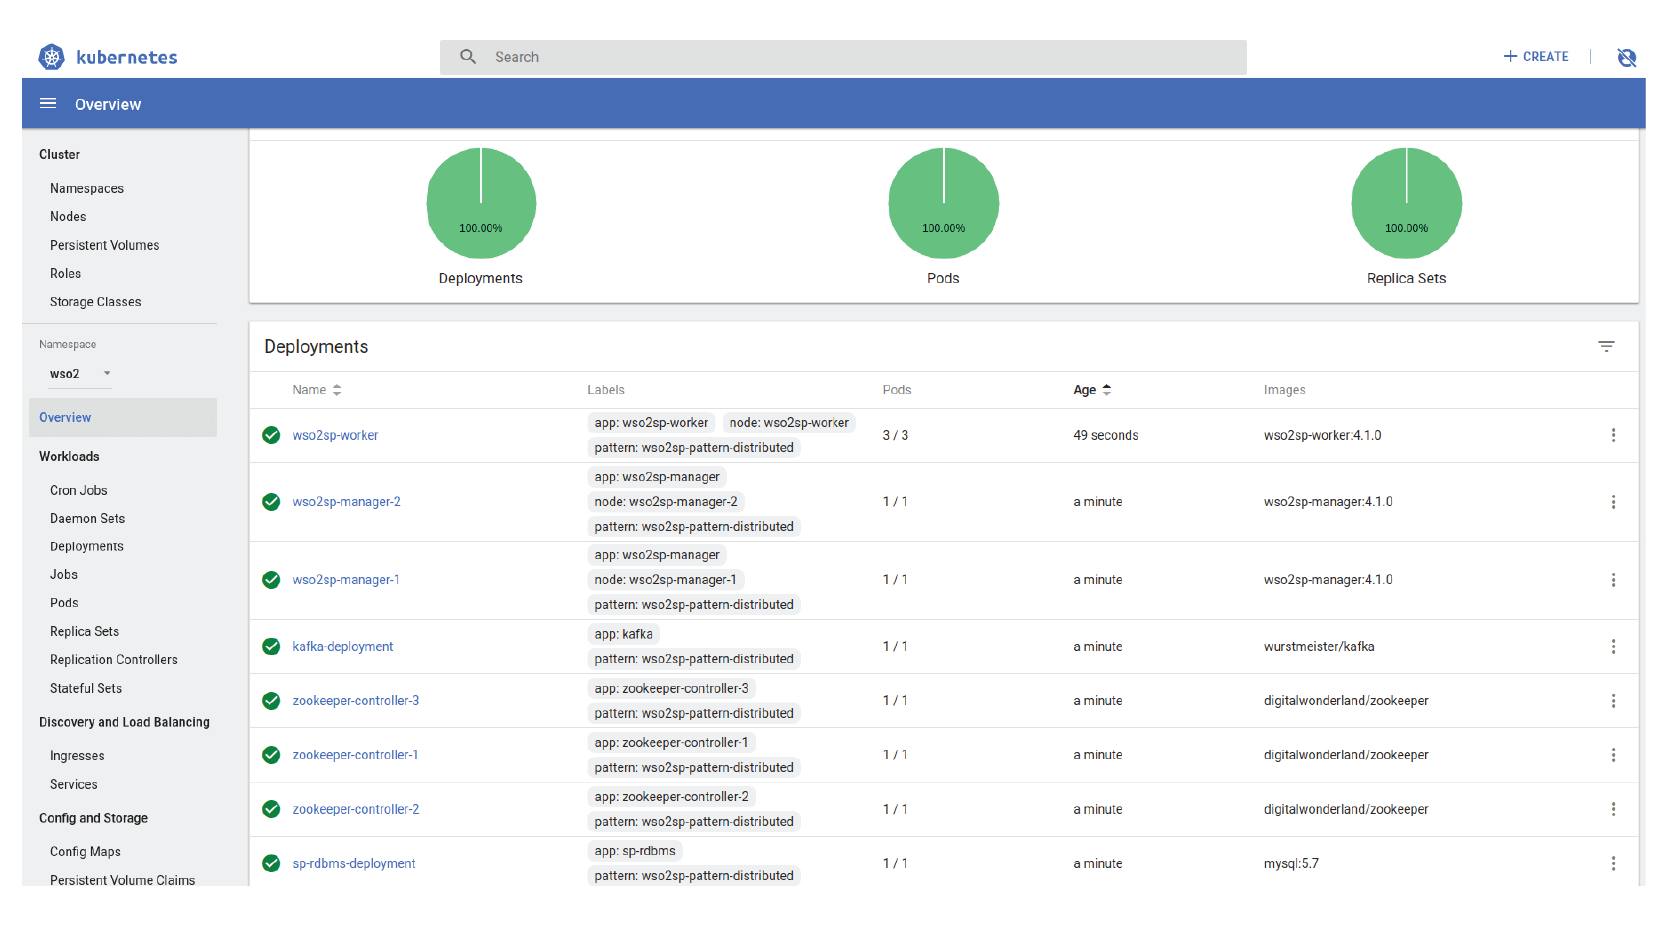
Figure 10: Deployment configurations for the fully distributed stream processor
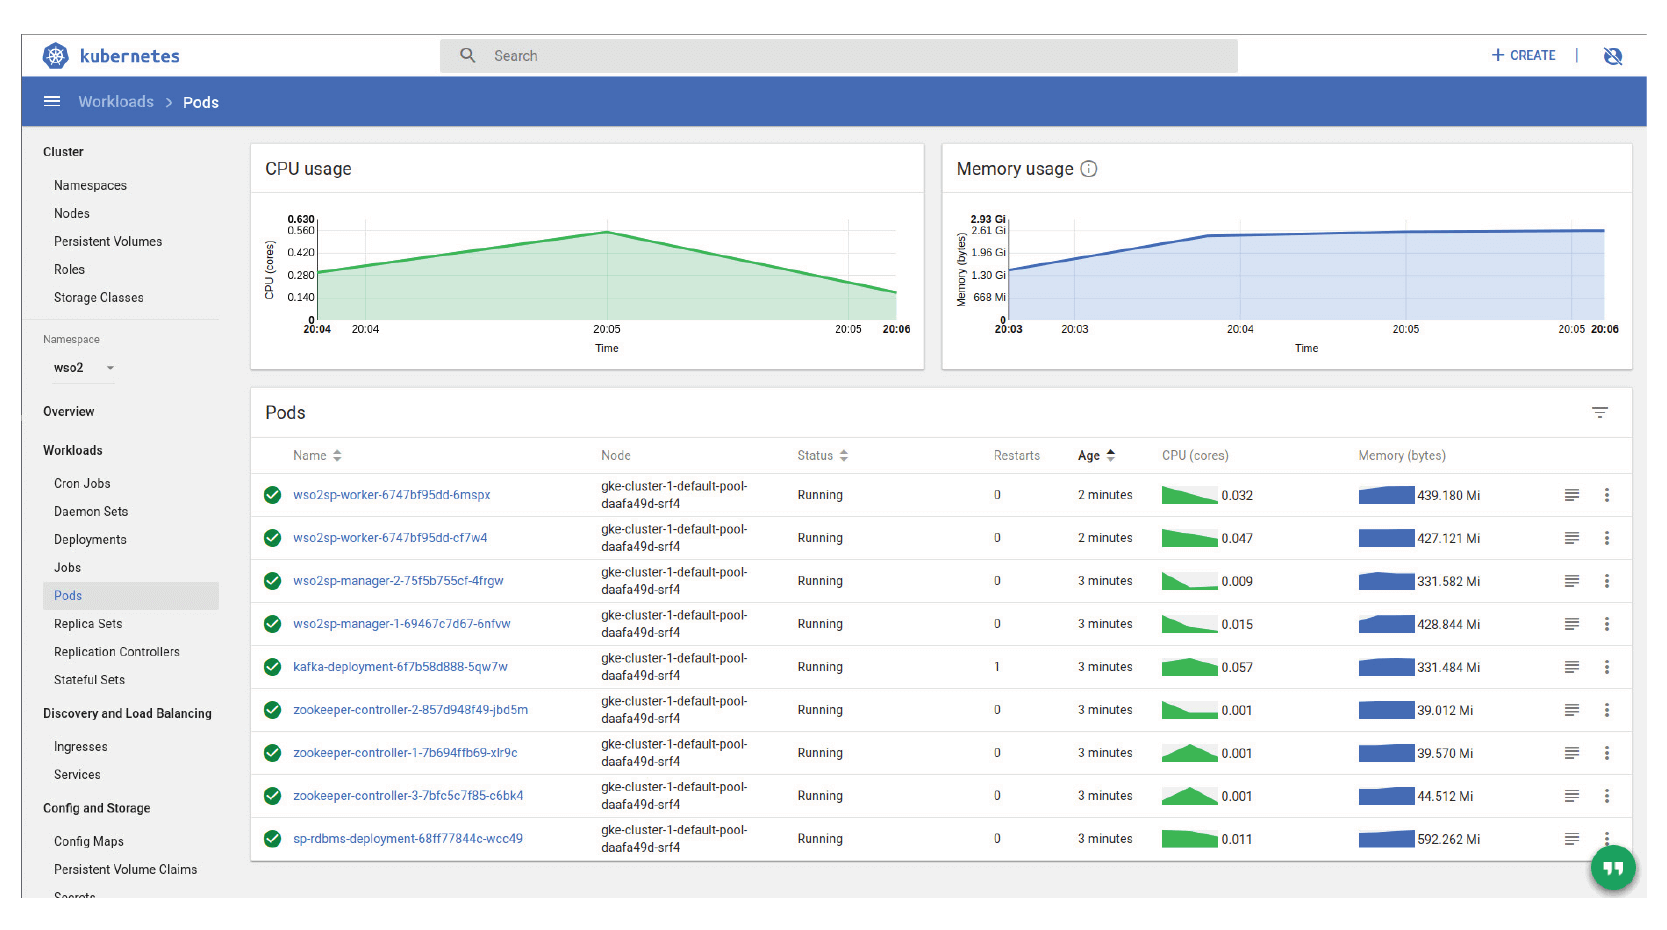
Figure 11: The Pod listing in the fully distributed stream processor
Distributed WSO2 SP does not have restrictions on environments, and it can run on bare metal, VMs, or containers. Here, Manager Nodes will be in a single cluster backed by a database for correlation, and, similarly, Dashboard Nodes can also be deployed in a separate cluster. But the Worker Nodes are dumb, and they do not form a cluster among themselves, but rather they will be in sync with the Manager Nodes for instructions.
In the following section, we will explain how the example case study can be deployed in a distributed stream processor.
The application described in Section 2 was developed to run as a small-scale deployment, e.g., processing data from a single household, and if it was deployed to monitor 100 houses, the application could operate without issues in terms of performance. However, you would have to scale the application further to handle 100,000 or beyond. Even if you do not observe a performance bottleneck with 100 users, when you increase to 500 or more, you may find the application (as well as the system) slows down considerably with increased latency in receiving the email alerts.
WSO2 SP seamlessly enables you to convert your non-distributed stream processing application into a distributed application via the use of annotations. The sample code in Listing 2 shows an example of a distributed version of the application. The distributed Siddhi App constructs are marked with black boldface font, while streams are marked with blue boldface font.
Listing 2: Annotated Siddhi Application for distributed deployment
@App:name('Energy-Alert-App')
@App:description('Energy consumption and anomaly detection')
-- Streams
@source(type = 'http', receiver.url=' ', topic = 'device-power',
@dist(parallel ='3')
@map(type = 'json'))
define stream DevicePowerStream (type string, deviceID string, power int);
@sink(type = 'email', to = '{{autorityContactEmail}}', username = 'john', address = '[email protected]', password = 'test', subject = 'High power consumption of {{deviceID}}',
@map(type = 'text',
@payload('Device ID: {{deviceID}} of room : {{roomID}} power is consuming {{finalPower}}kW/h. ')))
define stream AlertStream (deviceID string, roomID string, initialPower double, finalPower double, autorityContactEmail string);
-- Tables
@Store(type="rdbms", jdbc.url="jdbc:mysql://localhost:3306/sp", username="root", password="root" , jdbc.driver.name="com.mysql.jdbc.Driver",field.length="symbol:100")
define table DeviceIdInfoTable (deviceID string, roomID string, autorityContactEmail string);
-- Queries
@info(name = 'monitored-filter')
@dist(execGroup='group1', parallel ='3')
from DevicePowerStream[type == 'monitored']
select deviceID, power
insert current events into MonitoredDevicesPowerStream;
@info(name = 'power-increase-pattern')
@dist(execGroup='group2', parallel ='3')
partition with (deviceID of MonitoredDevicesPowerStream)
begin
@info(name = 'avg-calculator')
from MonitoredDevicesPowerStream#window.time(2 min)
select deviceID, avg(power) as avgPower
insert current events into #AvgPowerStream;
@info(name = 'power-increase-detector')
from every e1 = #AvgPowerStream -> e2 = #AvgPowerStream[(e1.avgPower + 5) <= avgPower] within 10 min
select e1.deviceID as deviceID, e1.avgPower as initialPower, e2.avgPower as finalPower
insert current events into RisingPowerStream;
end;
@info(name = 'power-range-filter')
@dist(execGroup='group3' ,parallel ='1')
from RisingPowerStream[finalPower > 100]
select deviceID, initialPower, finalPower
insert current events into DevicesWithinRangeStream;
@info(name = 'enrich-alert')
@dist(execGroup='group3' ,parallel ='1')
from DevicesWithinRangeStream as s join DeviceIdInfoTable as t
on s.deviceID == t.deviceID
select s.deviceID as deviceID, t.roomID as roomID, s.initialPower as initialPower, s.finalPower as finalPower, t.autorityContactEmail as autorityContactEmail
insert current events into AlertStream;
The conversion process essentially involves separating the application code into execution groups using the @dist() annotation. The distributed annotation information includes the number of parallel instances to be created for each execution element and how different elements should be grouped together when deployed in WSO2 SP. In Siddhi, a collection of execution elements (an execution element can be a Siddhi Query/Siddhi Partition) is called an execution group. The next task is to deploy this application in WSO2 SP, which is configured to operate as a distributed stream processor.

Figure 12: Siddhi App Distribution among Siddhi Workers
Once deployed, the Siddhi application will be divided into multiple smaller Siddhi applications by the Stream Processor Manager and will be deployed in different WSO2 SP instances as shown in Figure 12. Kafka topics will be generated for each stream in the Siddhi application. Communication between the execution groups of the distributed Siddhi application happens through the Kafka topics. Note that the dotted lines in Figure 12 correspond to the number of parallelisms present in the Siddhi application. The source and the sink elements are built into the default execution group.
The above Siddhi application have filter, join, window, and pattern queries. Since the window and pattern queries maintain an internal processing state, they cannot be parallelized. Hence, they are partitioned by the “deviceID” attribute, so that they can be parallelized by running in different partitions.
The Siddhi applications deployed in the distributed deployment will become disaggregated and will be deployed in multiple Worker Nodes. Therefore, it is essential to know how they are distributed, in which nodes there are running, the state of the Siddhi application as a whole, the performance of each disaggregated Siddhi application, and the health of the nodes in which they run. These can be observed and monitored using WSO2 SP’s9 Status Dashboard, irrespective of the environment the solution is deployed on.
The homepage of the stream processor status dashboard is shown in Figure 13. It provides an overview to the complete distributed deployment. The overview can be made either on the nodes (i.e., node view) or the applications deployed in the stream processor (i.e., app view).
In node view, each of the nodes are represented by a rectangular block in the status dashboard. The blocks are further separated into two as Managers and Workers. In the example shown in Figure 13, there are two Manager Nodes, out of which, one Manager is the active manager and the other is passive. There are three Workers in the resource cluster. For each of the nodes, the status dashboard indicates the workload metrics, such as CPU usage, memory usage, load average, etc.
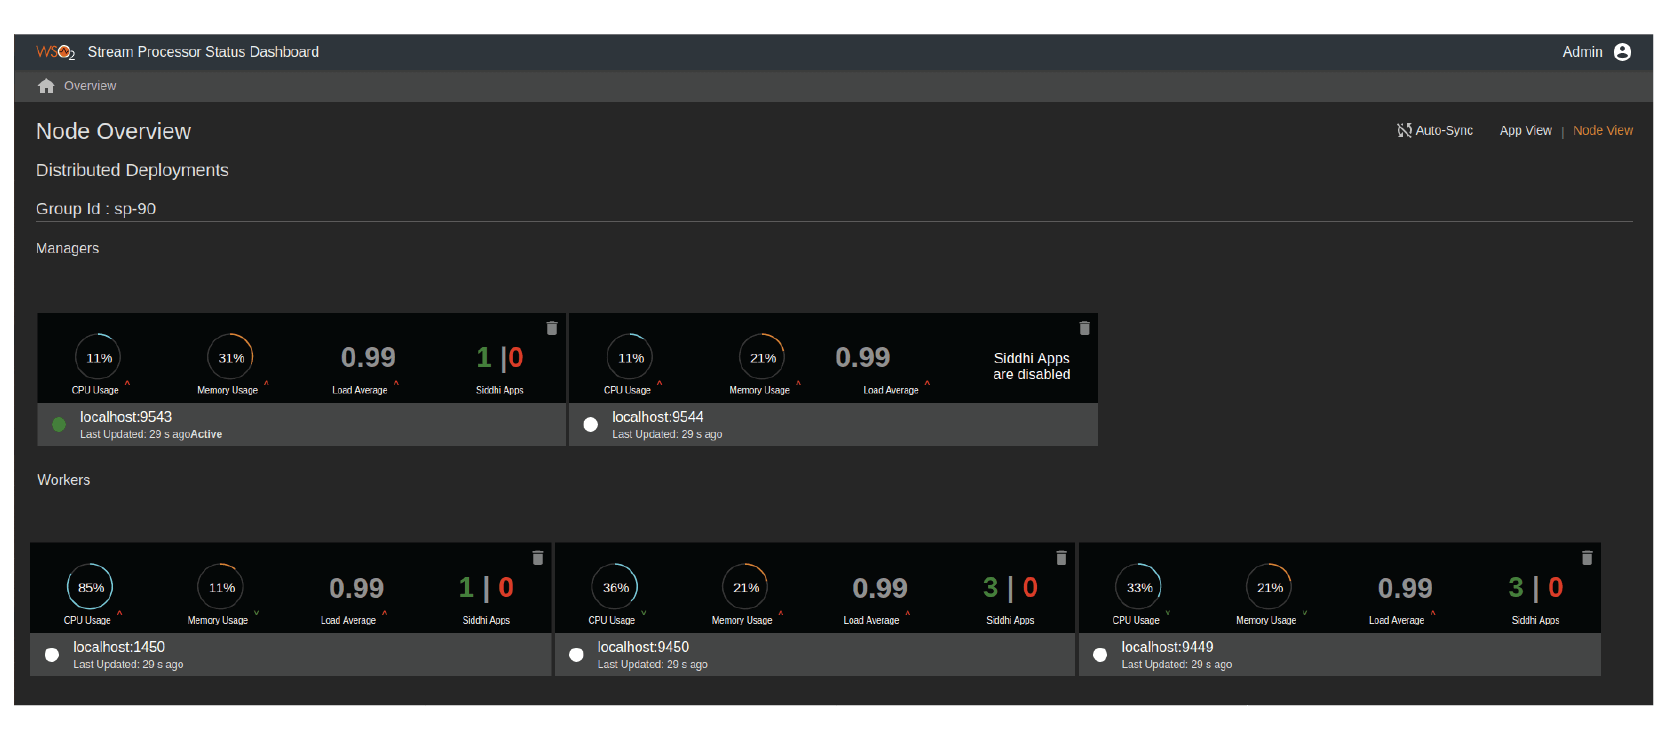
Figure 13: WSO2 Stream Processor Status Dashboard showing the status of the distributed cluster
From the active node, we can view all the Siddhi applications that have been deployed in the distributed stream processor (See Figure 14). For each application, it indicates the number of groups, child applications, and worker nodes.
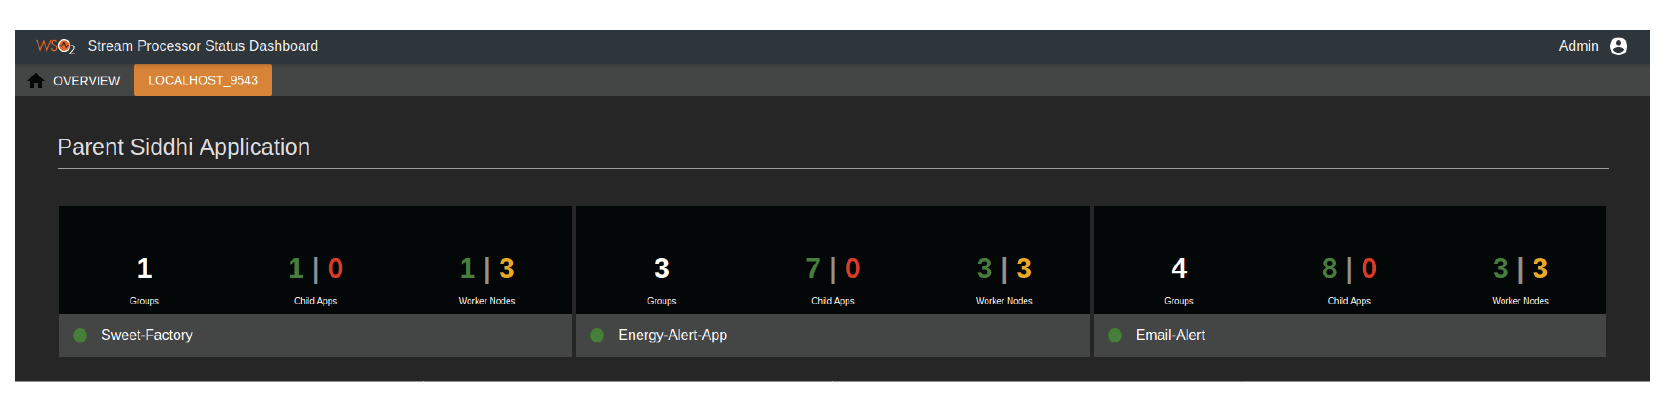
Figure 14: WSO2 Stream Processor Status Dashboard showing the list of Siddhi applications deployed in the cluster
By selecting one of the applications, a user can view the distributed Siddhi application’s components and its topology. Figure 15 shows the deployment of the example use case presented in Listing 2.
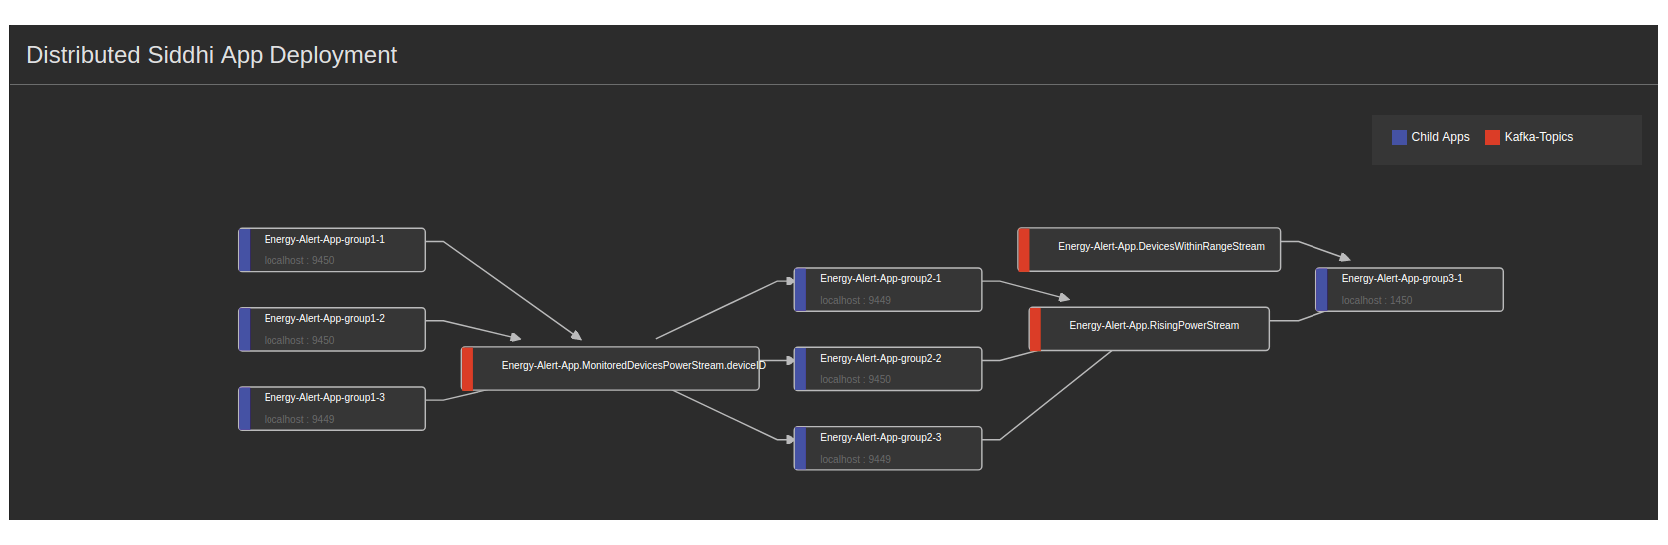
Figure 15: WSO2 Stream Processor Status Dashboard showing the components of the distributed Siddhi application
A more detailed overview of child Siddhi applications is shown in Figure 16.
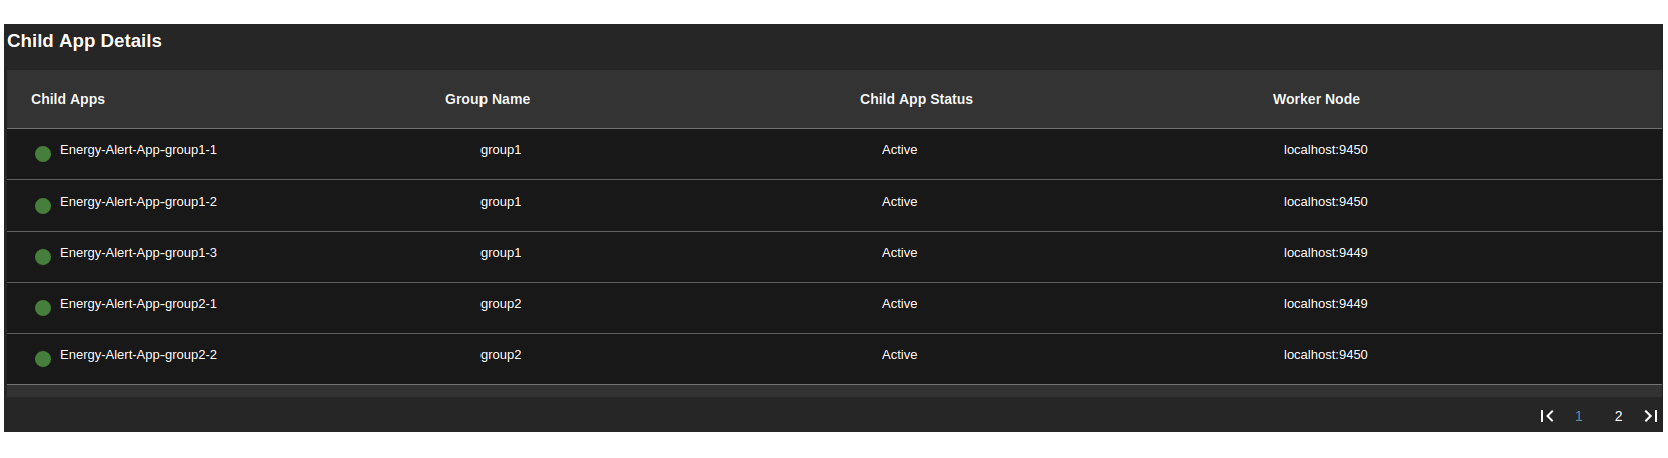
Figure 16: WSO2 Stream Processor Status Dashboard showing how the child applications get deployed in the distributed cluster
The status dashboard can present the performance of each Siddhi application. It indicates performance metrics such as latency, overall throughput, and memory usage (See Figure 17). It also has many other detail statistics reports in terms of performance and latency, which can be found in the product docs.
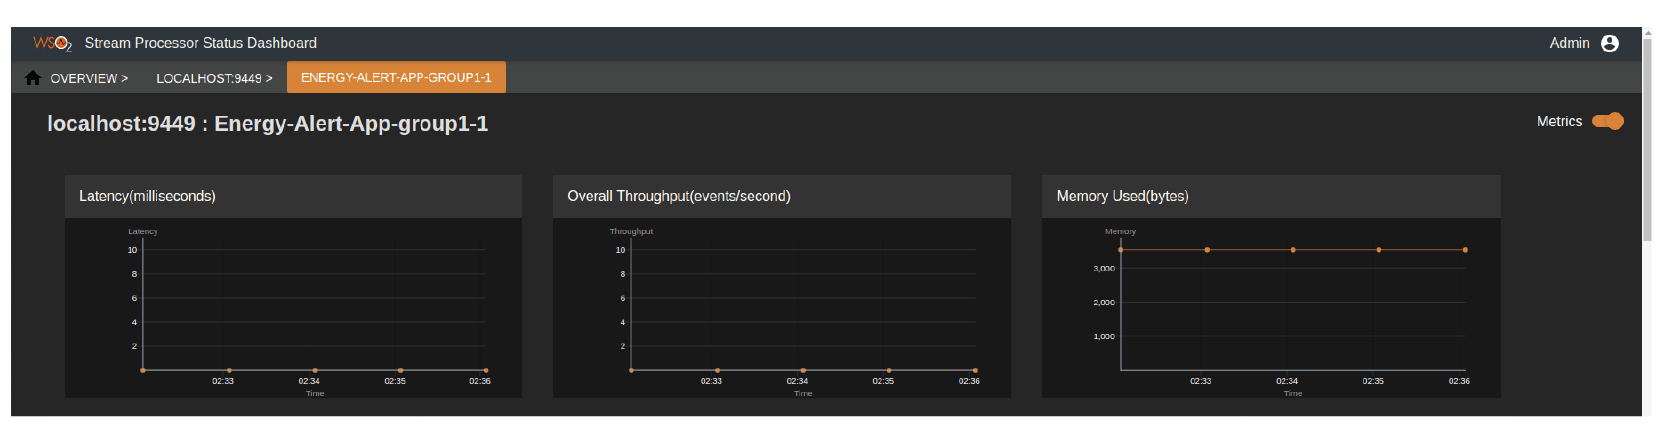
Figure 17: WSO2 Stream Processor Status Dashboard showing the performance information of a child application
Up to now, we have presented the reference architecture for distributed stream processing and how it has been realized through WSO2 SP. We also explained how a generic Siddhi application is converted into a distributed stream processing application using an energy anomaly detection use case. The reference architecture provides the components of a general distributed stream processing system. However, different stream processors may add their own specific features/customizations on top of the general reference architecture. In the following section, we describe the specialized features of WSO2 SP’s distributed deployment.
Deciding how to deploy the set of applications on hand, so that the cluster resources can be utilized efficiently while gaining the best performance numbers, is a key requirement for a distributed stream processing deployment. It is a well known fact that the best performance could be obtained by partitioning the applications across multiple nodes in such a way that their system resources are utilized in a load balanced manner. Here, the application scheduler plays a key role in creating high-performance stream processing application deployments. Schedulers can be implemented by following simple schemes such as random distribution, round robin distribution, etc. However, most modern schedulers take the resource availability metric and the application heuristics of the target cluster in-determining application deployment since they provide better results compared to their predecessors.
WSO2 SP uses a resource aware and heuristics scheduler, mainly utilizing the CPU, memory related metrics of the nodes in the cluster as the input, and comes up with a plan for distributing the application across the cluster.
WSO2 SP also allows its Worker Nodes to be labeled by their characteristics such as, static IP, externally accessible, size of the node, and many others. These heuristics are also used by the scheduler during the application scheduling process. Compared to other offerings, WSO2 SP also allows users to distribute Siddhi Applications in a much more optimised way. For example, the distributed application elements that consume messages from external systems will be deployed on nodes that are accessible from outside, and the queries that will need more memory for processing will be deployed on nodes that have large amounts of allocated memory. It should be noted that heuristics receives priority in most cases over the resource-aware scheduler. For example, irrespective of the resource consumption of the nodes, which are accessible from the outside of the cluster, the application elements need to be deployed in those specific nodes in order for the application to function correctly.
WSO2 SP’s application distribution is calculated mainly at two situations: first, when a Siddhi application is deployed in the cluster for the very first time, and, second, during the runtime, owing to the dynamic nature of the cluster (e.g.,, when a few Worker Nodes are down or added to the cluster, resulting in an unbalanced cluster). In such situations, we need to rebalance certain applications from overloaded nodes to less-overloaded nodes, and also redeploy the apps, which were deployed in the failed nodes.
The message processing guarantee (i.e., semantics) determines the stream processor’s reliability in message delivery, and there are three main message processing guarantees: at most once, at least once, and exactly once. WSO2 SP supports stream applications with any of these three message processing guarantees. Out of these, the exactly once semantic, which is in high demand, ensures that there is no message loss occuring during a system failure and that each incoming event is processed exactly once. The exactly once processing feature has been implemented using Kafka as the underlying message queue and uses periodic state snapshots when communicating between the components in the stream processor cluster.
Reliable and fault tolerant state management is important for a distributed stream processor to provide a highly available service. If a state management mechanism is missing in the stream processor, it may result in catastrophic failures for applications that has state. The reliability of state can be achieved via periodically snapshotting the application state into a persistent media. Snapshotting stream processing systems checkpoint their operator states into a distributed file system (such as HDFS), or to an RDBMS, or to a distributed message queue (such as Apache Kafka). This technique is also called full checkpointing because we take a complete snapshot of the application state each time. The benefit of full checkpointing is that it performs fast recovery because the only requirement in such situations is to load the last checkpoint data from the data storage before the application resumes processing data.
Incremental checkpointing is an advanced checkpointing technique that reduces the checkpointing overhead for stream processing scenarios with large state. Incremental checkpointing maintains a log of changes made to the state and recovers using the log rather than taking full checkpoints of the state every time. This technique is beneficial in use cases where the snapshot recovery cost can be subdued by the performance gain made by taking incremental checkpoints.

Figure 18: The process of incremental checkpointing
As shown in Figure 18, incremental checkpointing first takes a checkpoint of the complete state. This is called the Base Checkpoint. Next, it checkpoints only the changes applied to the state variables. These are called Incremental Checkpoints. In the above example, item 4 was removed and item 5 was newly added to the application state. This results in low persistence overhead compared to taking full checkpoints.
WSO2 SP comes with checkpoint-based fault tolerance. It has the feature of making incremental checkpoints. Incremental checkpoints enable taking smaller snapshots of the application state and migrating the application state across the distributed nodes.
Stream processors are supposed to be run continuously. However, sudden node failures could occur in a stream processor cluster, which could lead to catastrophic situations. Maintaining manager cluster stability is important to recover from node failures. In WSO2 SP, this is achieved by using its high availability (HA) features. WSO2 SP’s manager cluster consists of two WSO2 SP instances that are configured to run in HA mode. Because the manager nodes are deployed in HA mode, if and when the active manager node goes down, another node in the manager will be elected as the cluster to handle the resource cluster. Figure 19 shows an overview of a 2-node HA manager node deployment.

Figure 19: Active-passive HA manager node deployment with WSO2 SP (a) active manager node receives the pings (b) when the active manager node crashes, the passive manager node assumes the role of an active node and manages the cluster
Unlike many other state-of-the-art stream processors, WSO2 SP provides full support for developing distributed stream processing applications using its graphical UI and Siddhi Streaming SQL. With this approach, distributed stream processing applications can be developed without using a single line of Java code.
The GUIs of both Code View (Siddhi Streaming SQL) and the Data Flow Graph view of the distributed stream processing application is presented below.
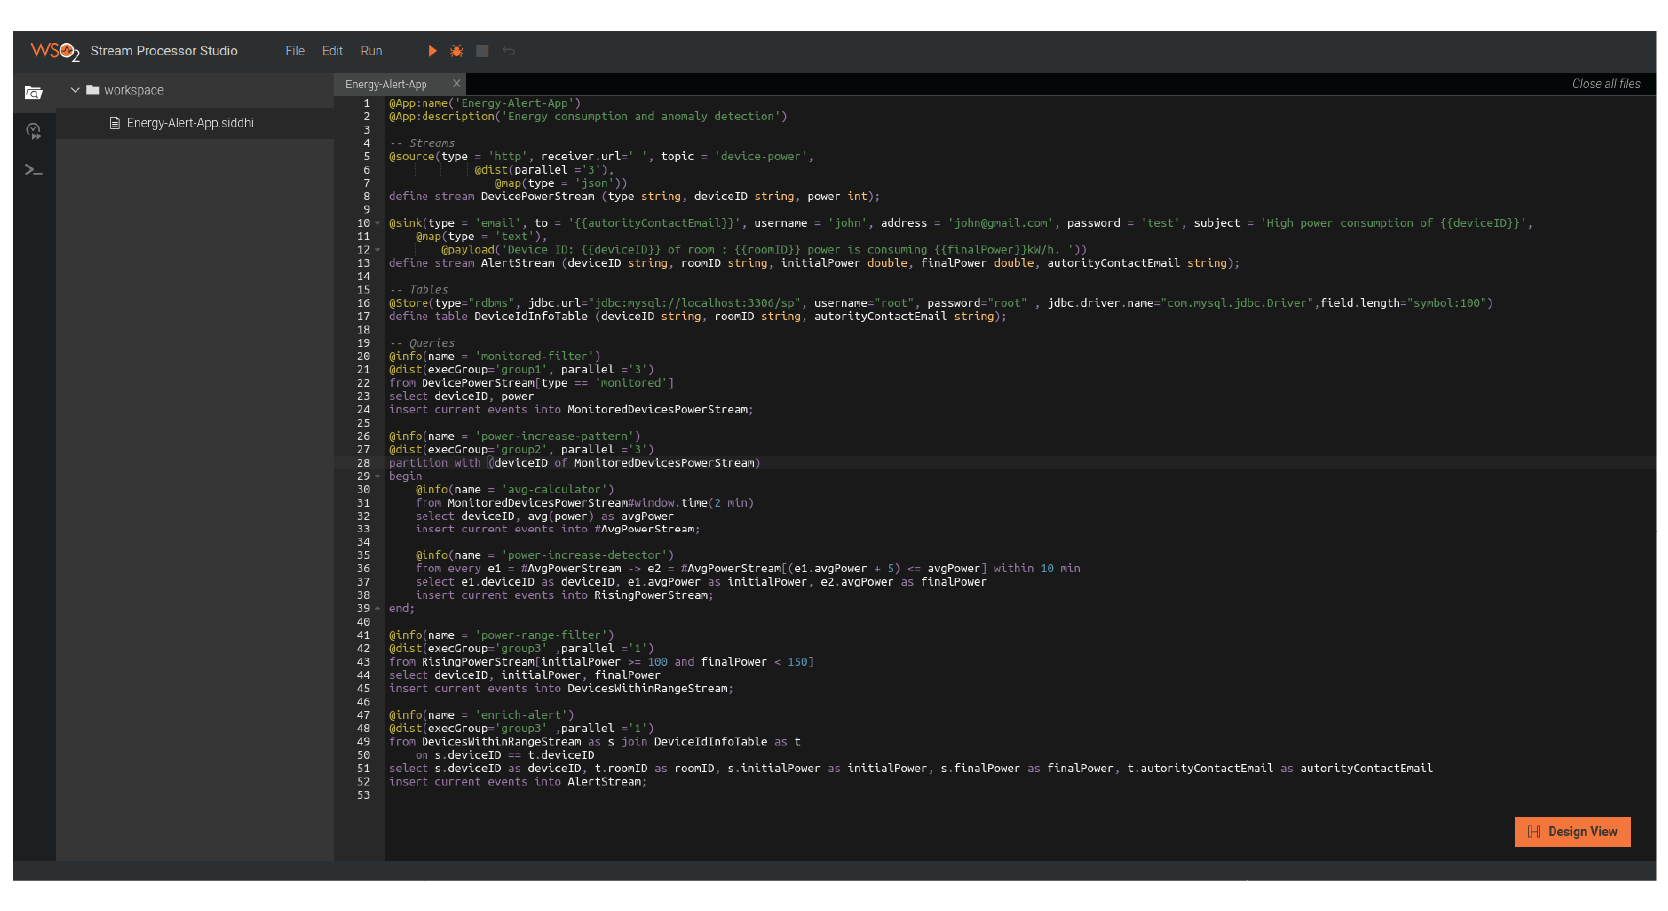
Figure 20: Stream Processor Studio showing the Code View of a Distributed Siddhi Application
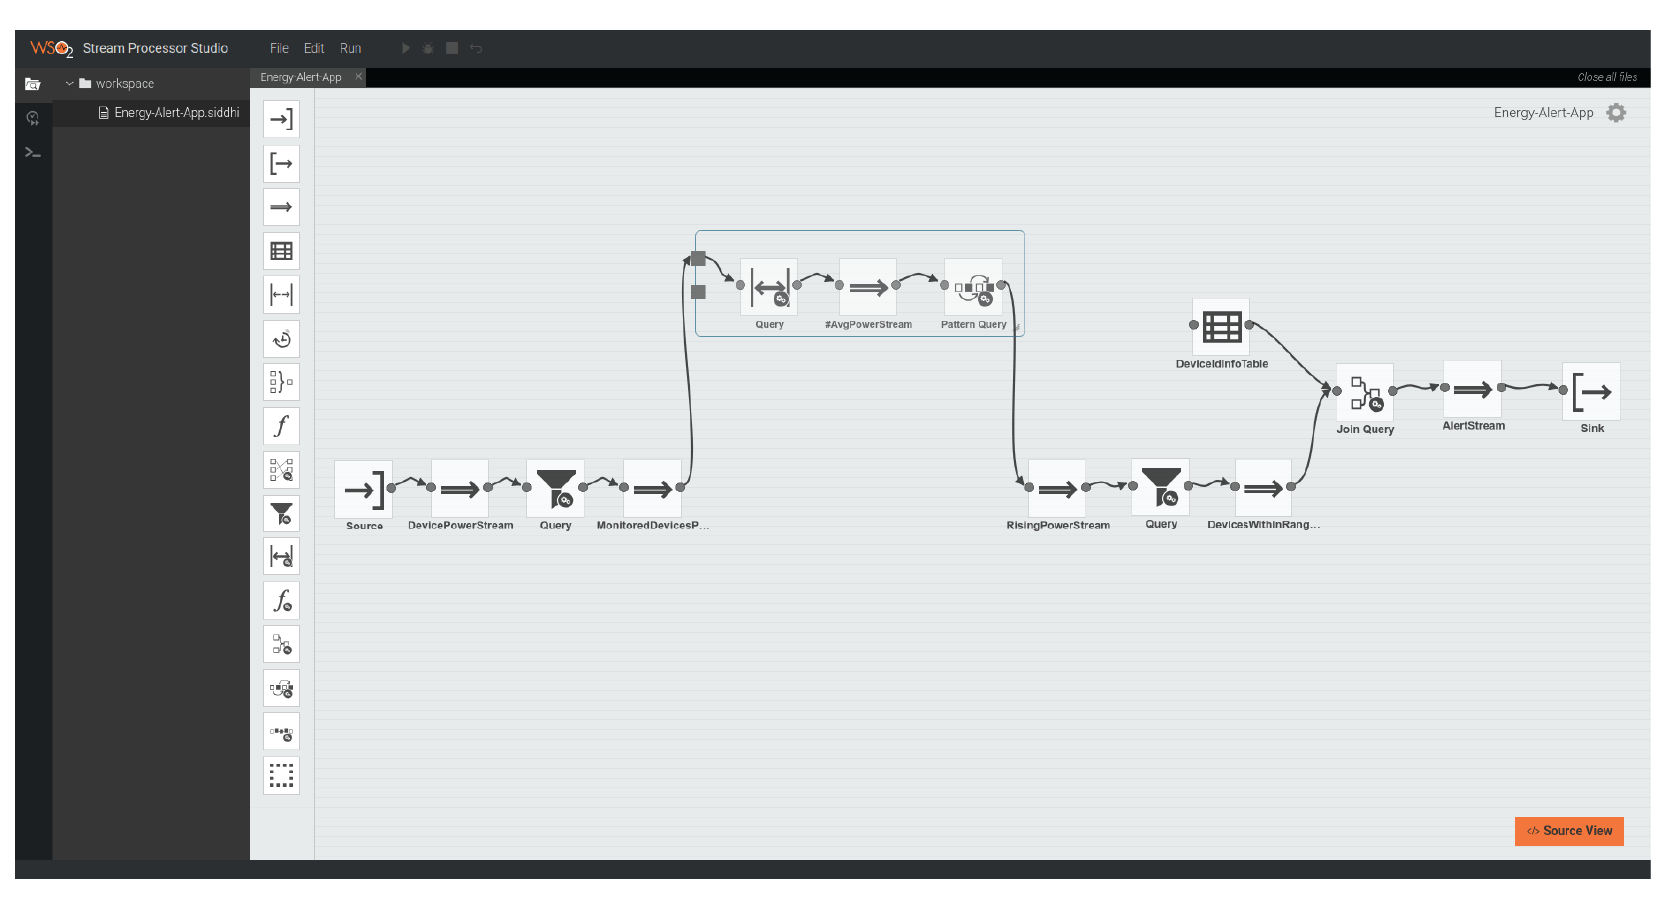
Figure 21: Stream Processor Studio’s Graphical Distributed Siddhi Application Editor
Distributed stream processors enable digital businesses to scale up without worrying about the architecture and infrastructure aspects of data analytics. This white paper mainly described a reference architecture for implementing distributed stream processors. It also described how the reference architecture can be applied to a real-world stream processor by taking WSO2 SP as an example. WSO2 SP hides the complexities of distributed stream processing and makes application development and lifecycle management a seamless experience. In this respect, the white paper explained how the same Siddhi Streaming SQL application written for a single node deployment can be deployed in a distributed stream processor deployment without much hassle. The white paper also provided deployment architecture details as well as monitoring details and development lifecycle information for distributed Siddhi applications. Finally, we discussed distributed stream processing features unique to WSO2 SP.
[1] WSO2 (2018), Fully Distributed Deployment, docs.wso2.com/display/SP410/Fully+Distributed+Deployment
[2] WSO2 (2018), Identity & Access Management - On-Premise and in the Cloud, wso2.com/identity-and-access-management
[3] WSO2 (2018), WSO2 Analytics, wso2.com/analytics
[4] WSO2 (2018), What is Stream Processing?, wso2.com/library/articles/2018/05/what-is-stream-processing/
[5] Miyuru Dayarathna and Srinath Perera (2018), Recent Advancements in Event Processing. ACM Comput. Surv. 51, 2, Article 33 (February 2018), 36 pages. DOI: dl.acm.org/citation.cfm?doid=3186333.3170432
[6] Miyuru Dayarathna (2018), Introducing WSO2 Stream Processor www.kdnuggets.com/2018/06/wso2-stream-processor.html
[7] Srinath Perera (2018), Is Your Stream Processor Obese?, dzone.com/articles/is-your-stream-processor-obese
[8] Srinath Perera (2018), Stream Processing 101: From SQL to Streaming SQL in 10 Minutes, wso2.com/library/articles/2018/02/stream-processing-101-from-sql-to-streaming-sql-in-ten-minutes/
[9] Gowthamy Vaseekaran, Distributed View in WSO2 Status Dashboard, medium.com/@gowthamy/distributed-view-in-wso2-status-dashboard-ef2df1472009
[10] Sriskandarajah Suhothayan (2018), How to use a Stream Processor as a Notification Manager?, medium.com/@suhothayan/stream-processor-as-a-notification-manager-7eab163b4770
[11] Bean, R.(2016), How Time-to-Insight Is Driving Big Data Business Investment, sloanreview.mit.edu/article/how-time-to-insight-is-driving-big-data-business-investment/
[12] Miyuru Dayarathna and Toyotaro Suzumura. 2013. Automatic optimization of stream
programs via source program operator graph transformations. Distrib. Parallel
Databases 31, 4 (December 2013), 543-599.
DOI= link.springer.com/article/10.1007%2Fs10619-013-7130-x
[13] Ramindu De Silva and Miyuru Dayarathna (2017), Processing Streaming Human Trajectories with WSO2 CEP, www.infoq.com/articles/smoothing-human-trajectory-streams
[14] Chamod Samarajeewa and Miyuru Dayarathna (2017), Approximate Queries on WSO2 Stream Processor: Use of Approximation Algorithms in an Applied Setting, www.infoq.com/articles/WSO2-algorithms-applied
[15] Sriskandarajah Suhothayan, Kasun Gajasinghe, Isuru Loku Narangoda, Subash
Chaturanga, Srinath Perera, and Vishaka Nanayakkara. 2011. Siddhi: a second look at
complex event processing architectures. In Proceedings of the 2011 ACM workshop on
Gateway computing environments (GCE '11). ACM, New York, NY, USA, 43-50.
DOI= dl.acm.org/citation.cfm?doid=2110486.2110493
[16] Sriskandarajah Suhothayan, Making Stream Processing Accessible to Business Users, medium.com/@suhothayan/making-stream-processing-accessible-to-business-users-54c57e566063
[17] Sriskandarajah Suhothayan, How to use a Stream Processor as a Notification Manager?, medium.com/@suhothayan/stream-processor-as-a-notification-manager-7eab163b4770
For more details about our solutions or to discuss a specific requirement