Manage Integrations
An integration in ICP represents a deployable Ballerina or MI application that runs in one or more environments. Each integration belongs to a project and is the primary unit for viewing logs, metrics, and runtime status in the ICP console. This page guides you through creating integrations and navigating the integration home.
Create an integration
-
Navigate to a project's home page.
-
Click + Create Integration. The Create New Integration form opens.
Field Required Description Display Name Yes Human-readable name shown in the console (e.g. Order Create)Name Auto URL-safe slug derived from the display name. Click the edit icon to override. Integration Type Yes Default profile (Ballerina) or MI (Micro Integrator). Defaults to default profile. Description No Optional free-text description of the integration -
Click Create.
The integration appears in the project's integrations table on success.
Integration home
The integration overview shows one environment card per environment. Each card displays:
- Environment name and runtime count badge (e.g. 0/1 Offline or 1/1 Online).
- A refresh icon to reload runtime status.
- Entry Points tab listing the services exposed by the integration.
- Supporting Artifacts tab showing additional artifacts when present.
- + Add Runtime link when no runtimes are registered yet.
When no runtimes are connected, the card shows: "No entry points found for this integration. Add runtime to get started."
Integration sidebar
The sidebar changes to integration scope when you navigate into an integration:
| Item | Description |
|---|---|
| Overview | Environment cards with entry points and supporting artifacts |
| Runtimes | Runtime instances connected to this integration |
| Logs | Integration-specific logs from connected runtimes |
| Loggers | Configure log levels per runtime |
| Metrics | Per-integration request metrics and latency data |
| Access control | Role assignments scoped to this integration |
Runtimes
The Runtimes page groups runtime instances by environment. Each environment section shows a search bar, a refresh icon, and a runtime table:
| Column | Description |
|---|---|
| Runtime Name | Display name assigned when connecting the runtime |
| Runtime ID | Unique identifier (UUID) |
| Type | Profile type (e.g. Default profile) |
| Status | Current state: RUNNING, OFFLINE, or similar |
| Version | Runtime version |
| Platform | Ballerina runtime version (e.g. Ballerina 2201.13.2) |
| OS | Operating system of the host machine |
| Registration time | When the runtime first connected to ICP |
| Last heartbeat | Timestamp of the most recent heartbeat received |
| Actions | Delete icon to remove the runtime |
Logs
The Logs page shows runtime log entries when both a connected runtime and OpenSearch observability are configured. See Observability setup to enable this.
When operational, the page provides:
- Filtering: Environment, log level (INFO, WARN, ERROR, DEBUG), time range, and a keyword search bar
- Display controls: Sort order (Newest first / Oldest first), auto-fetch toggle for automatic reload, and an entry count showing how many entries are loaded
- Actions: Refresh button for manual reload and a download button to export log entries
- Log entries: Each entry shows a timestamp, level, and message
Loggers
The Loggers page lets you change the log level of a running Ballerina integration without restarting it. Loggers are grouped by environment, and each row represents a Ballerina package reporting its current log level from the connected runtimes.
| Column | Description |
|---|---|
| Component Name | Ballerina package name reporting the log level |
| Log Level | Current log level: DEBUG, INFO, WARN, or ERROR |
Change the log level
- Navigate to Loggers in the integration sidebar.
- Find the environment section for the environment you want to update.
- In the Log Level column, click the dropdown next to the component and select a new level.
The change is applied immediately to all runtimes connected to that integration in the selected environment. A spinner appears next to the dropdown while the update propagates. Once the runtimes acknowledge the new level, the spinner clears.
The available log levels for Ballerina integrations are:
| Level | When to use |
|---|---|
DEBUG | Verbose output for troubleshooting; logs all detail including internal state |
INFO | Standard operational messages; recommended for normal production use |
WARN | Potentially harmful situations that do not cause a failure |
ERROR | Error events that may still allow the integration to continue running |
Click View Runtimes on any logger row to see which runtime IDs are receiving log level commands for that component.
Metrics
The Metrics page shows request performance data when both a connected runtime and observability are configured. See Observability setup to enable this.
When operational, the page provides:
- Summary cards: Total Requests, Error Count, Error Percentage, and P95 Latency
- Overview charts: Requests Per Minute and Request Latency (average, P50, P95, P99)
- Most Used APIs: Table with per-endpoint request counts, error counts, and average response times
- Statistics of APIs: Section with an API filter dropdown, showing Requests Per Minute, Average Request Latency, Successful Requests by API, and Failed Requests by API charts
Listeners
Ballerina listeners (HTTP, TCP, and other transport listeners) appear in the Entry Points tab of the integration Overview under the Listener type. Each listener shows its package, protocol, host, and port. You can start or stop individual listeners directly from the console, which sends a control command to all runtimes running that listener in the selected environment.
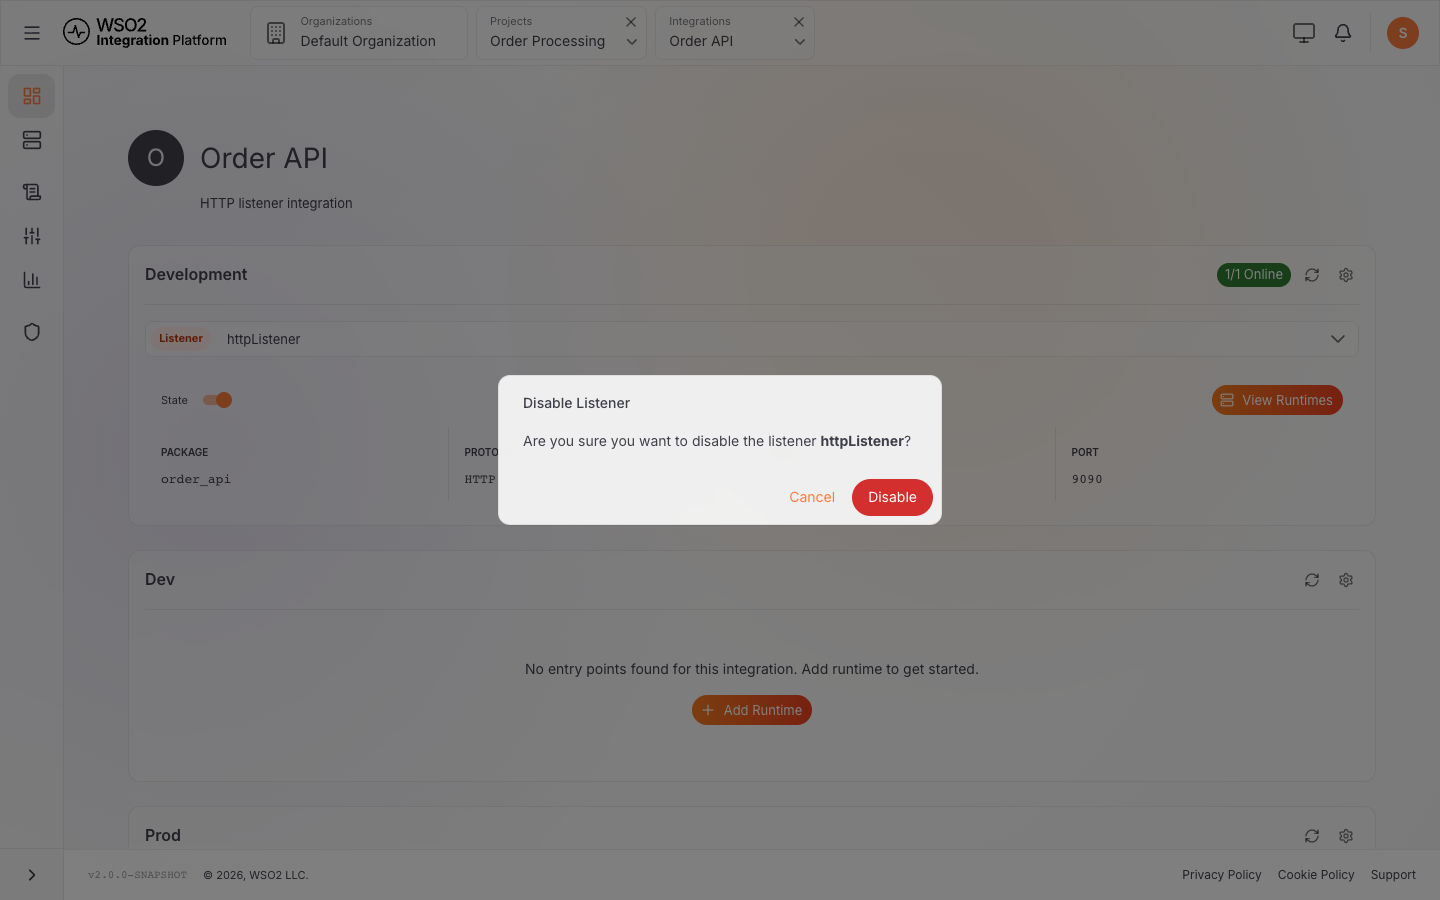
Start or stop a listener
- Open the integration and go to Overview.
- In the environment card, click the Entry Points tab.
- Click the listener you want to control. The listener detail panel opens on the right.
- Use the toggle (State) in the panel to start or stop the listener.
- A confirmation dialog appears. Click Enable or Disable to confirm.
ICP sends a START or STOP command to every runtime associated with the listener. The listener state updates to RUNNING or STOPPED once the runtimes acknowledge the command.
| Detail field | Description |
|---|---|
| Package | Ballerina package the listener is defined in |
| Protocol | Transport protocol (e.g. HTTP, TCP) |
| Host | Hostname the listener is bound to |
| Port | Port the listener is bound to |
What's next
- Connect an integration to ICP — register a runtime to start sending heartbeats and status updates
- Observability setup — enable centralized logs and metrics for connected runtimes
- Manage runtimes — view and manage runtime instances across integrations