Integration Control Plane
The Integration Control Plane (ICP) is a centralized dashboard for monitoring, managing, and troubleshooting running WSO2 Integrator integrations.
Overview
The ICP provides a single pane of glass for all your deployed integrations, regardless of whether they run on Kubernetes, VMs, or WSO2 Devant. It collects runtime data from connected integration nodes and presents it through a web-based dashboard and a GraphQL API.
Key capabilities:
- Service inventory -- View all running integrations, their versions, and deployment status
- Real-time monitoring -- Observe request rates, error rates, and latency for each service
- Log aggregation -- View logs from connected integrations without accessing individual nodes
- Configuration management -- Inspect and update runtime configuration
- Health status -- See the health of each instance
- Deployment history -- Track when services were deployed or updated
Configuring the integration node with ICP
ICP allows you to connect Ballerina and MI runtimes to the ICP server for centralized management and monitoring. This guide will walk you through the steps to connect your integration runtime to the ICP server.
-
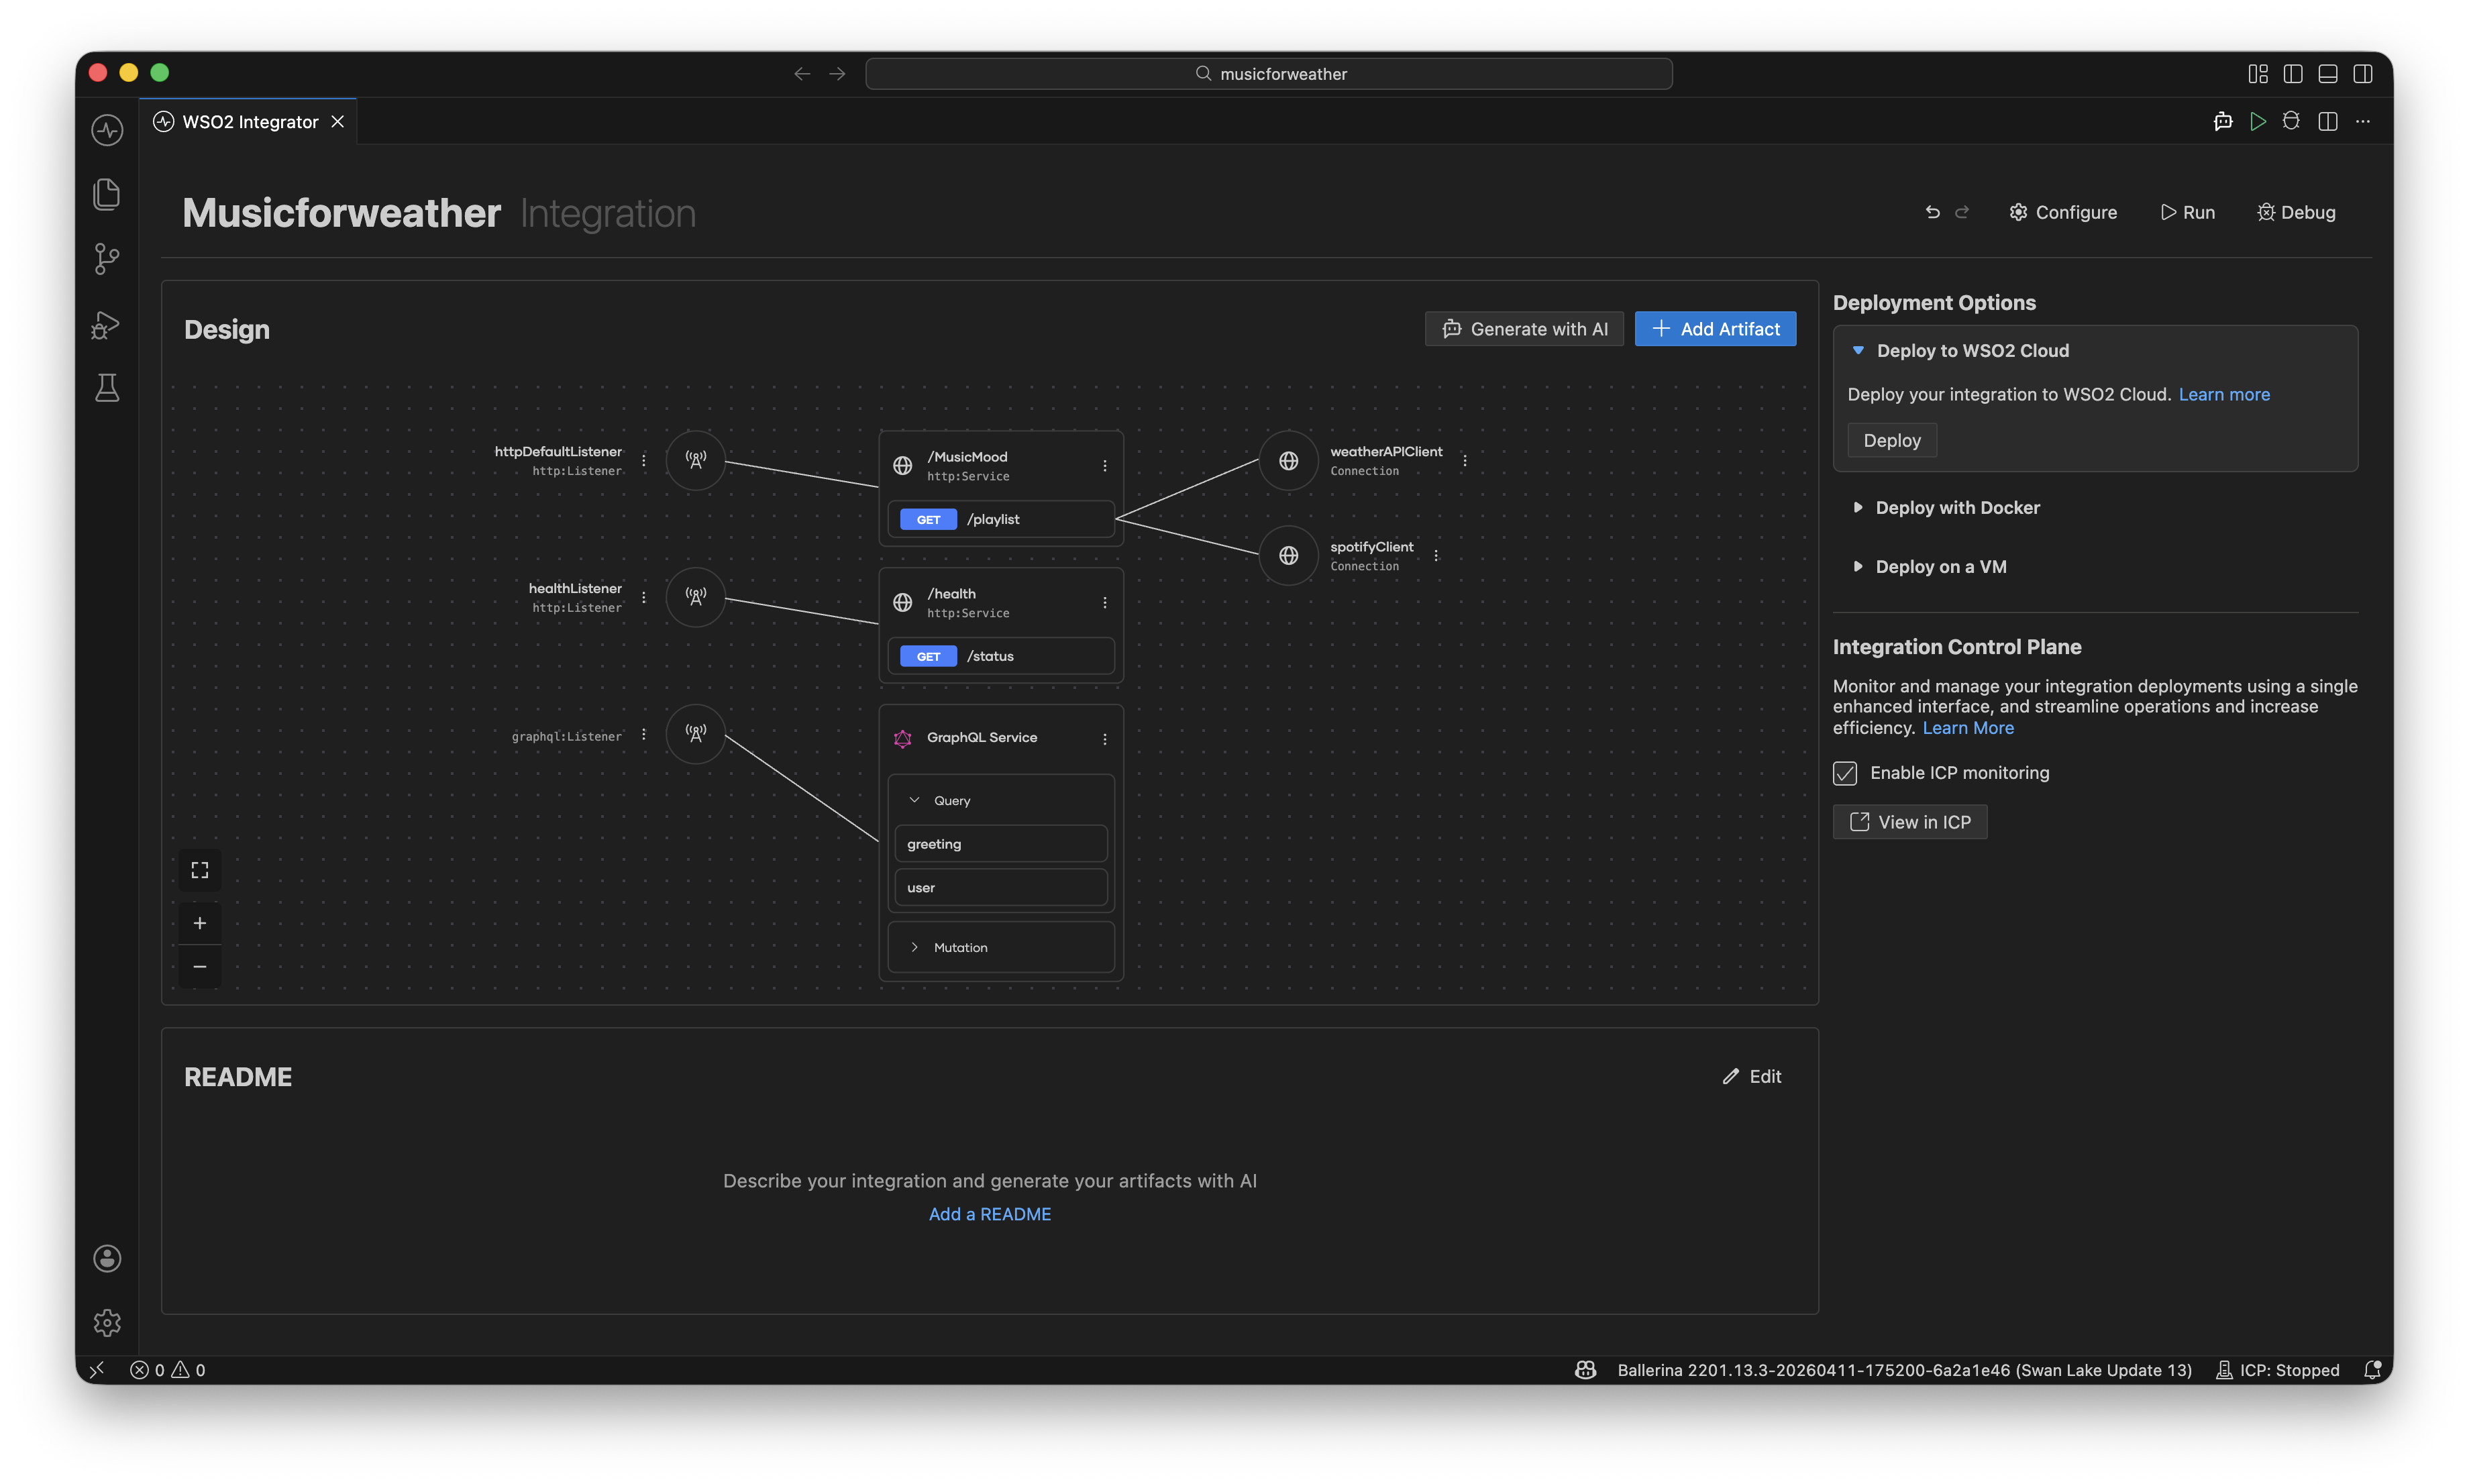
Navigate to the home view of WSO2 Integrator.
-
Select the Enable ICP monitoring checkbox under the Integration Control Plane section.
-
Enabling ICP monitoring will generate and add the following configurations to your runtime.
- Config.toml
- Ballerina.toml
- main.bal
[wso2.icp.runtime.bridge]
environment = "dev"
project = "<project name>"
integration = "<integration name>"
runtime = "<unique id for the runtime>"
secret = "<your-secret-here>"
# serverUrl="https://<hostname>:9445"
Remote management will be enabled in the Ballerina.toml file.
[build-options]
remoteManagement = true
The wso2.icp.runtime.bridge package will be imported into the integration entrypoint.
import wso2/icp.runtime.bridge as _;
- Click the View in ICP button to start and connect the integration runtime to the ICP server.
- The ICP server will start on
https://localhost:9446.
Browsing the ICP
-
Navigate to
https://localhost:9446in your browser. -
Enter the default username (
admin) and password (admin), then click the Sign In button.Security RecommendationDefault credentials must be changed before using ICP in production. Update the admin password account through Profile > Change Password in the ICP dashboard.
-
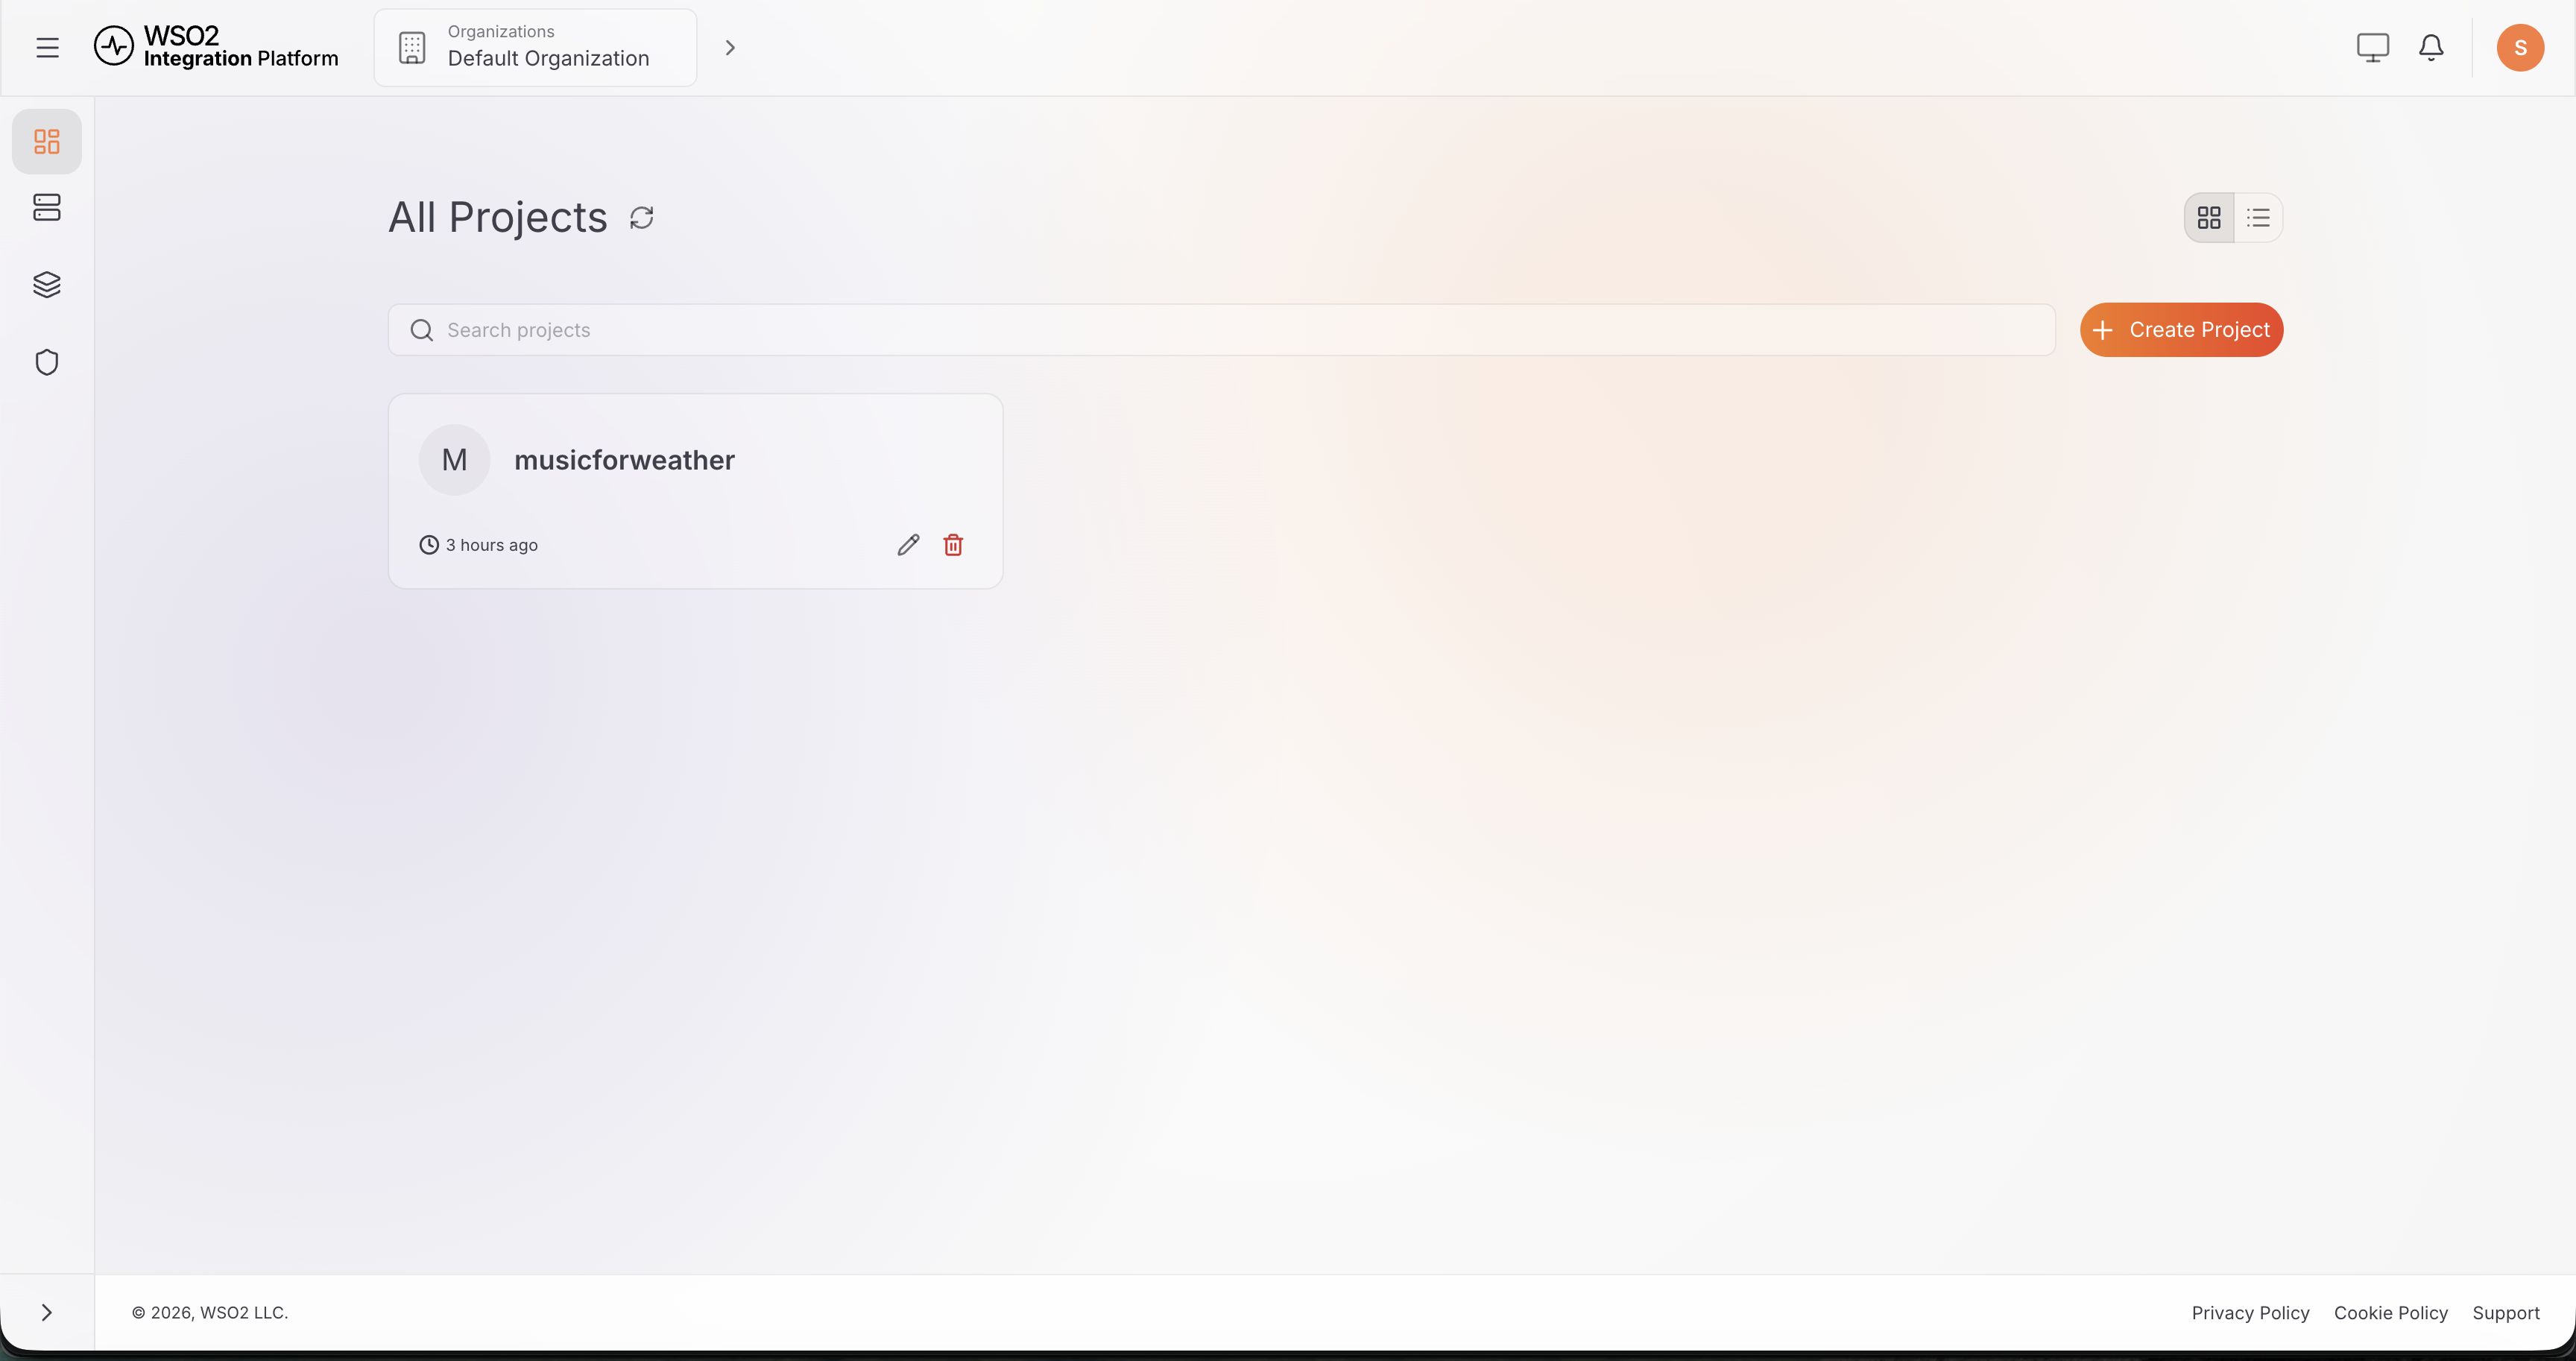
The project will be displayed on the Home page of the ICP dashboard.
-
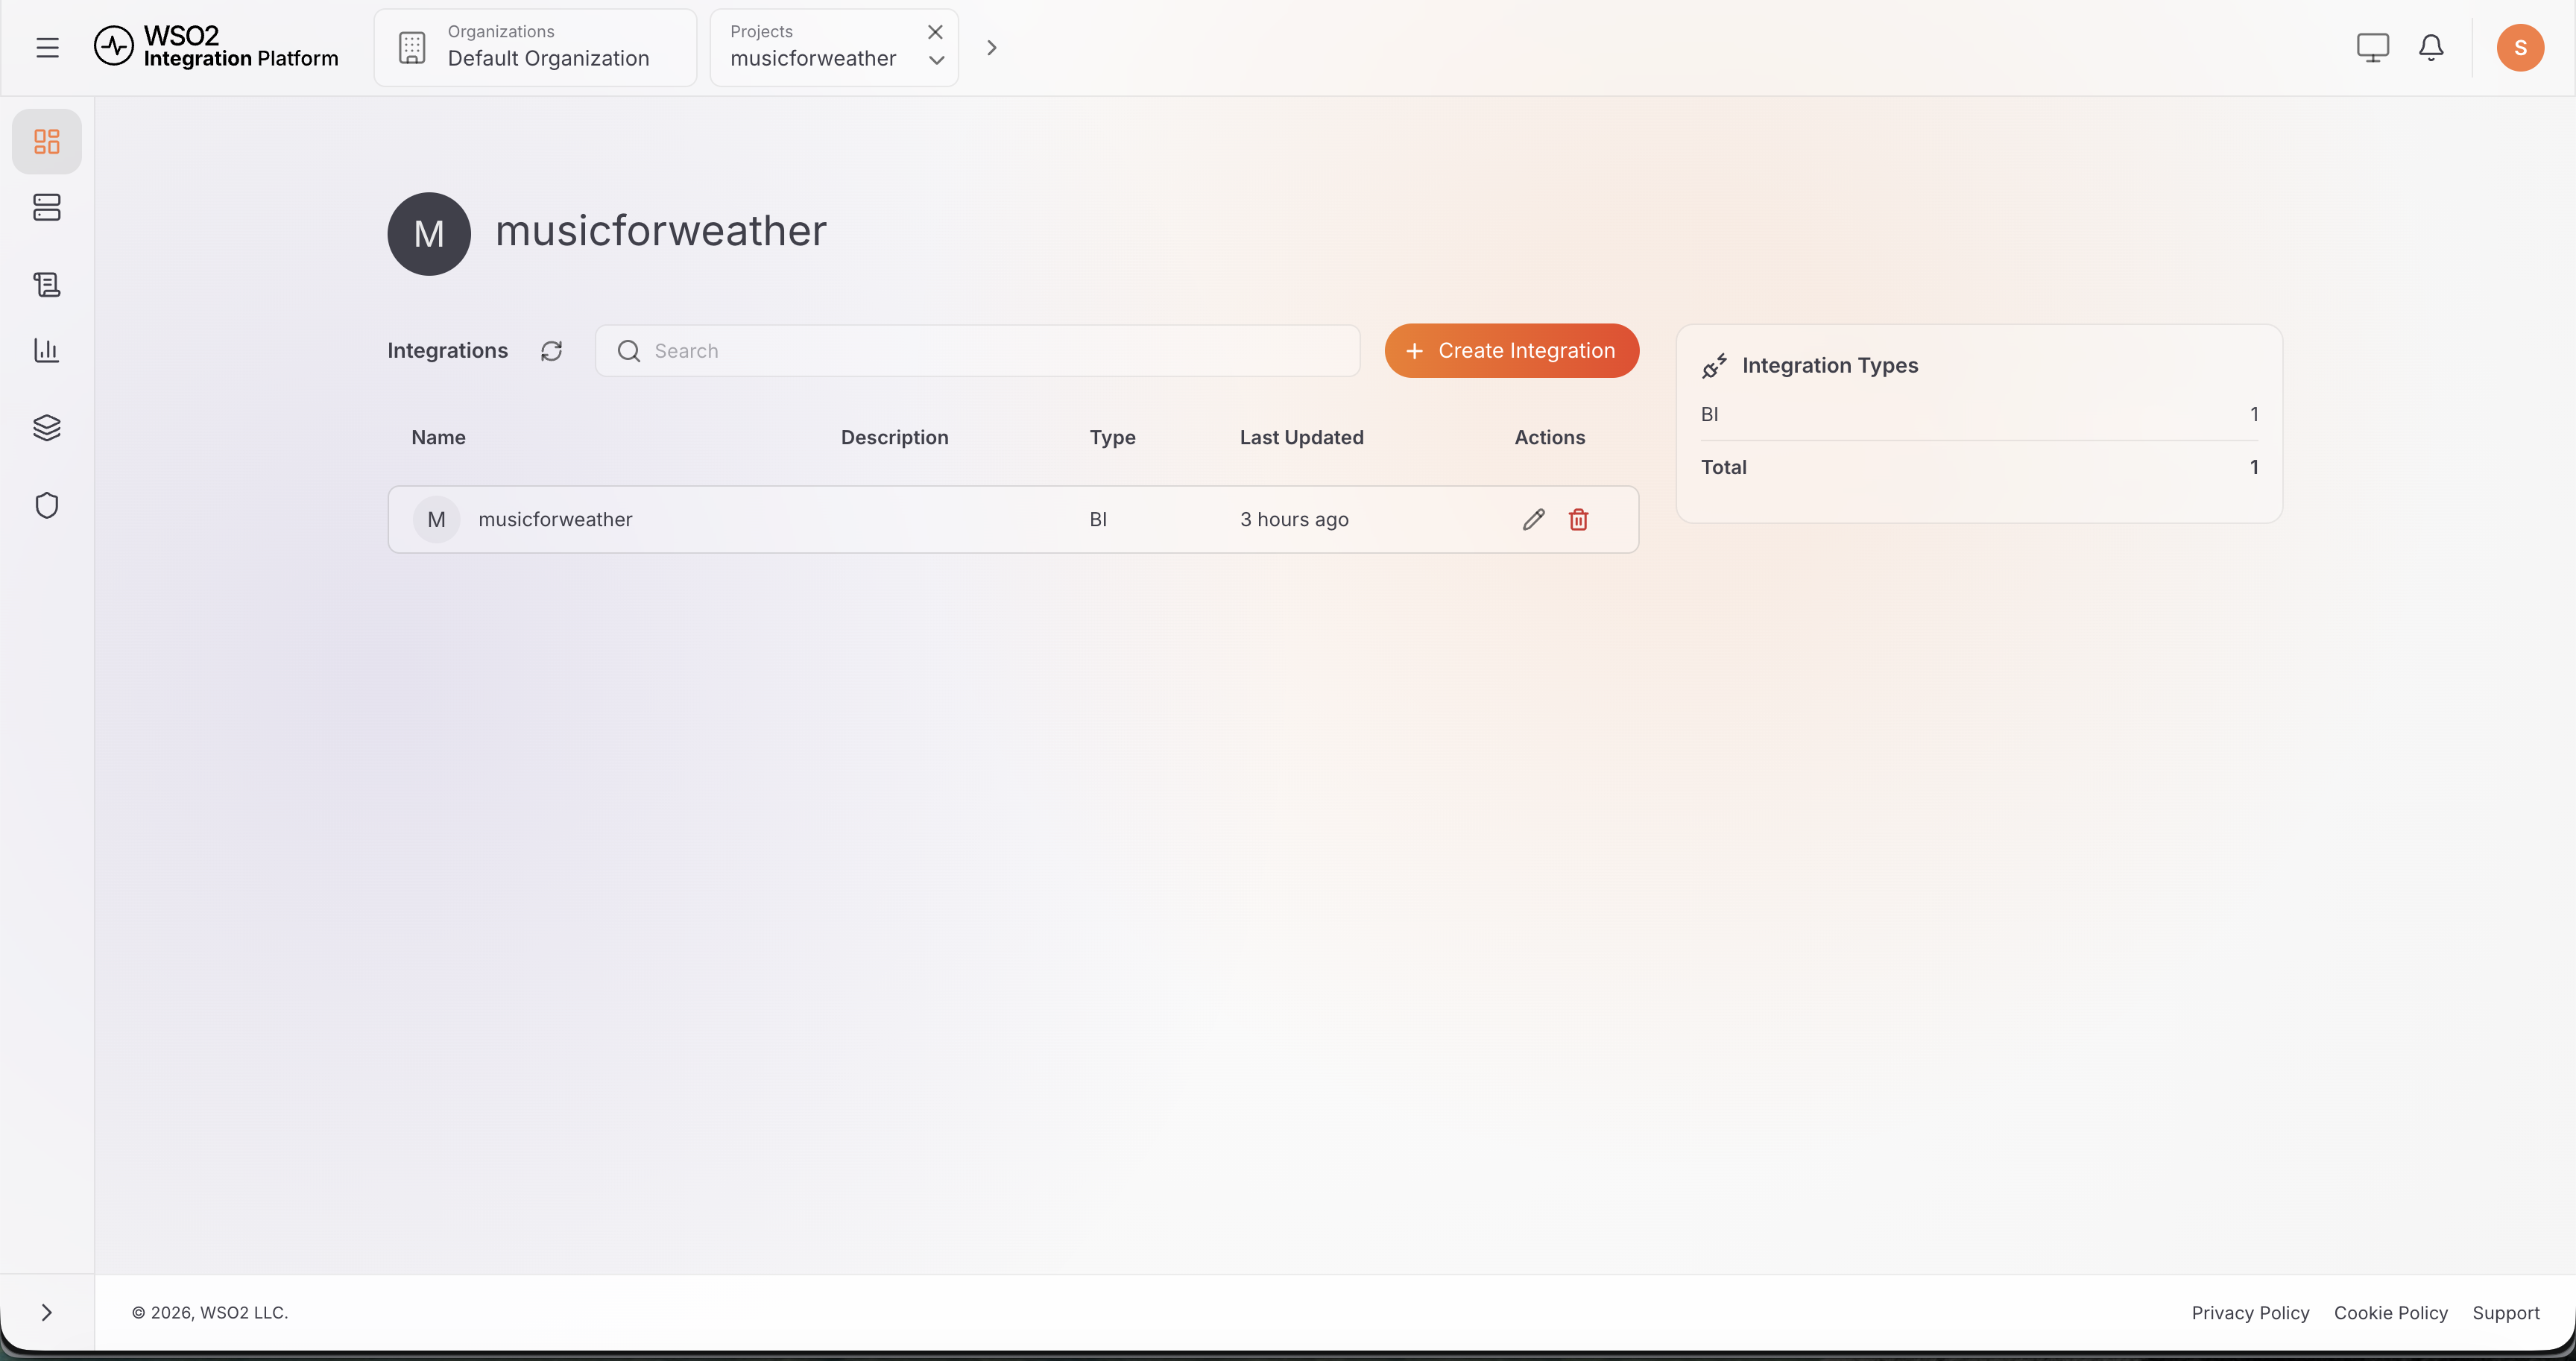
Click on the project to view the integrations.
-
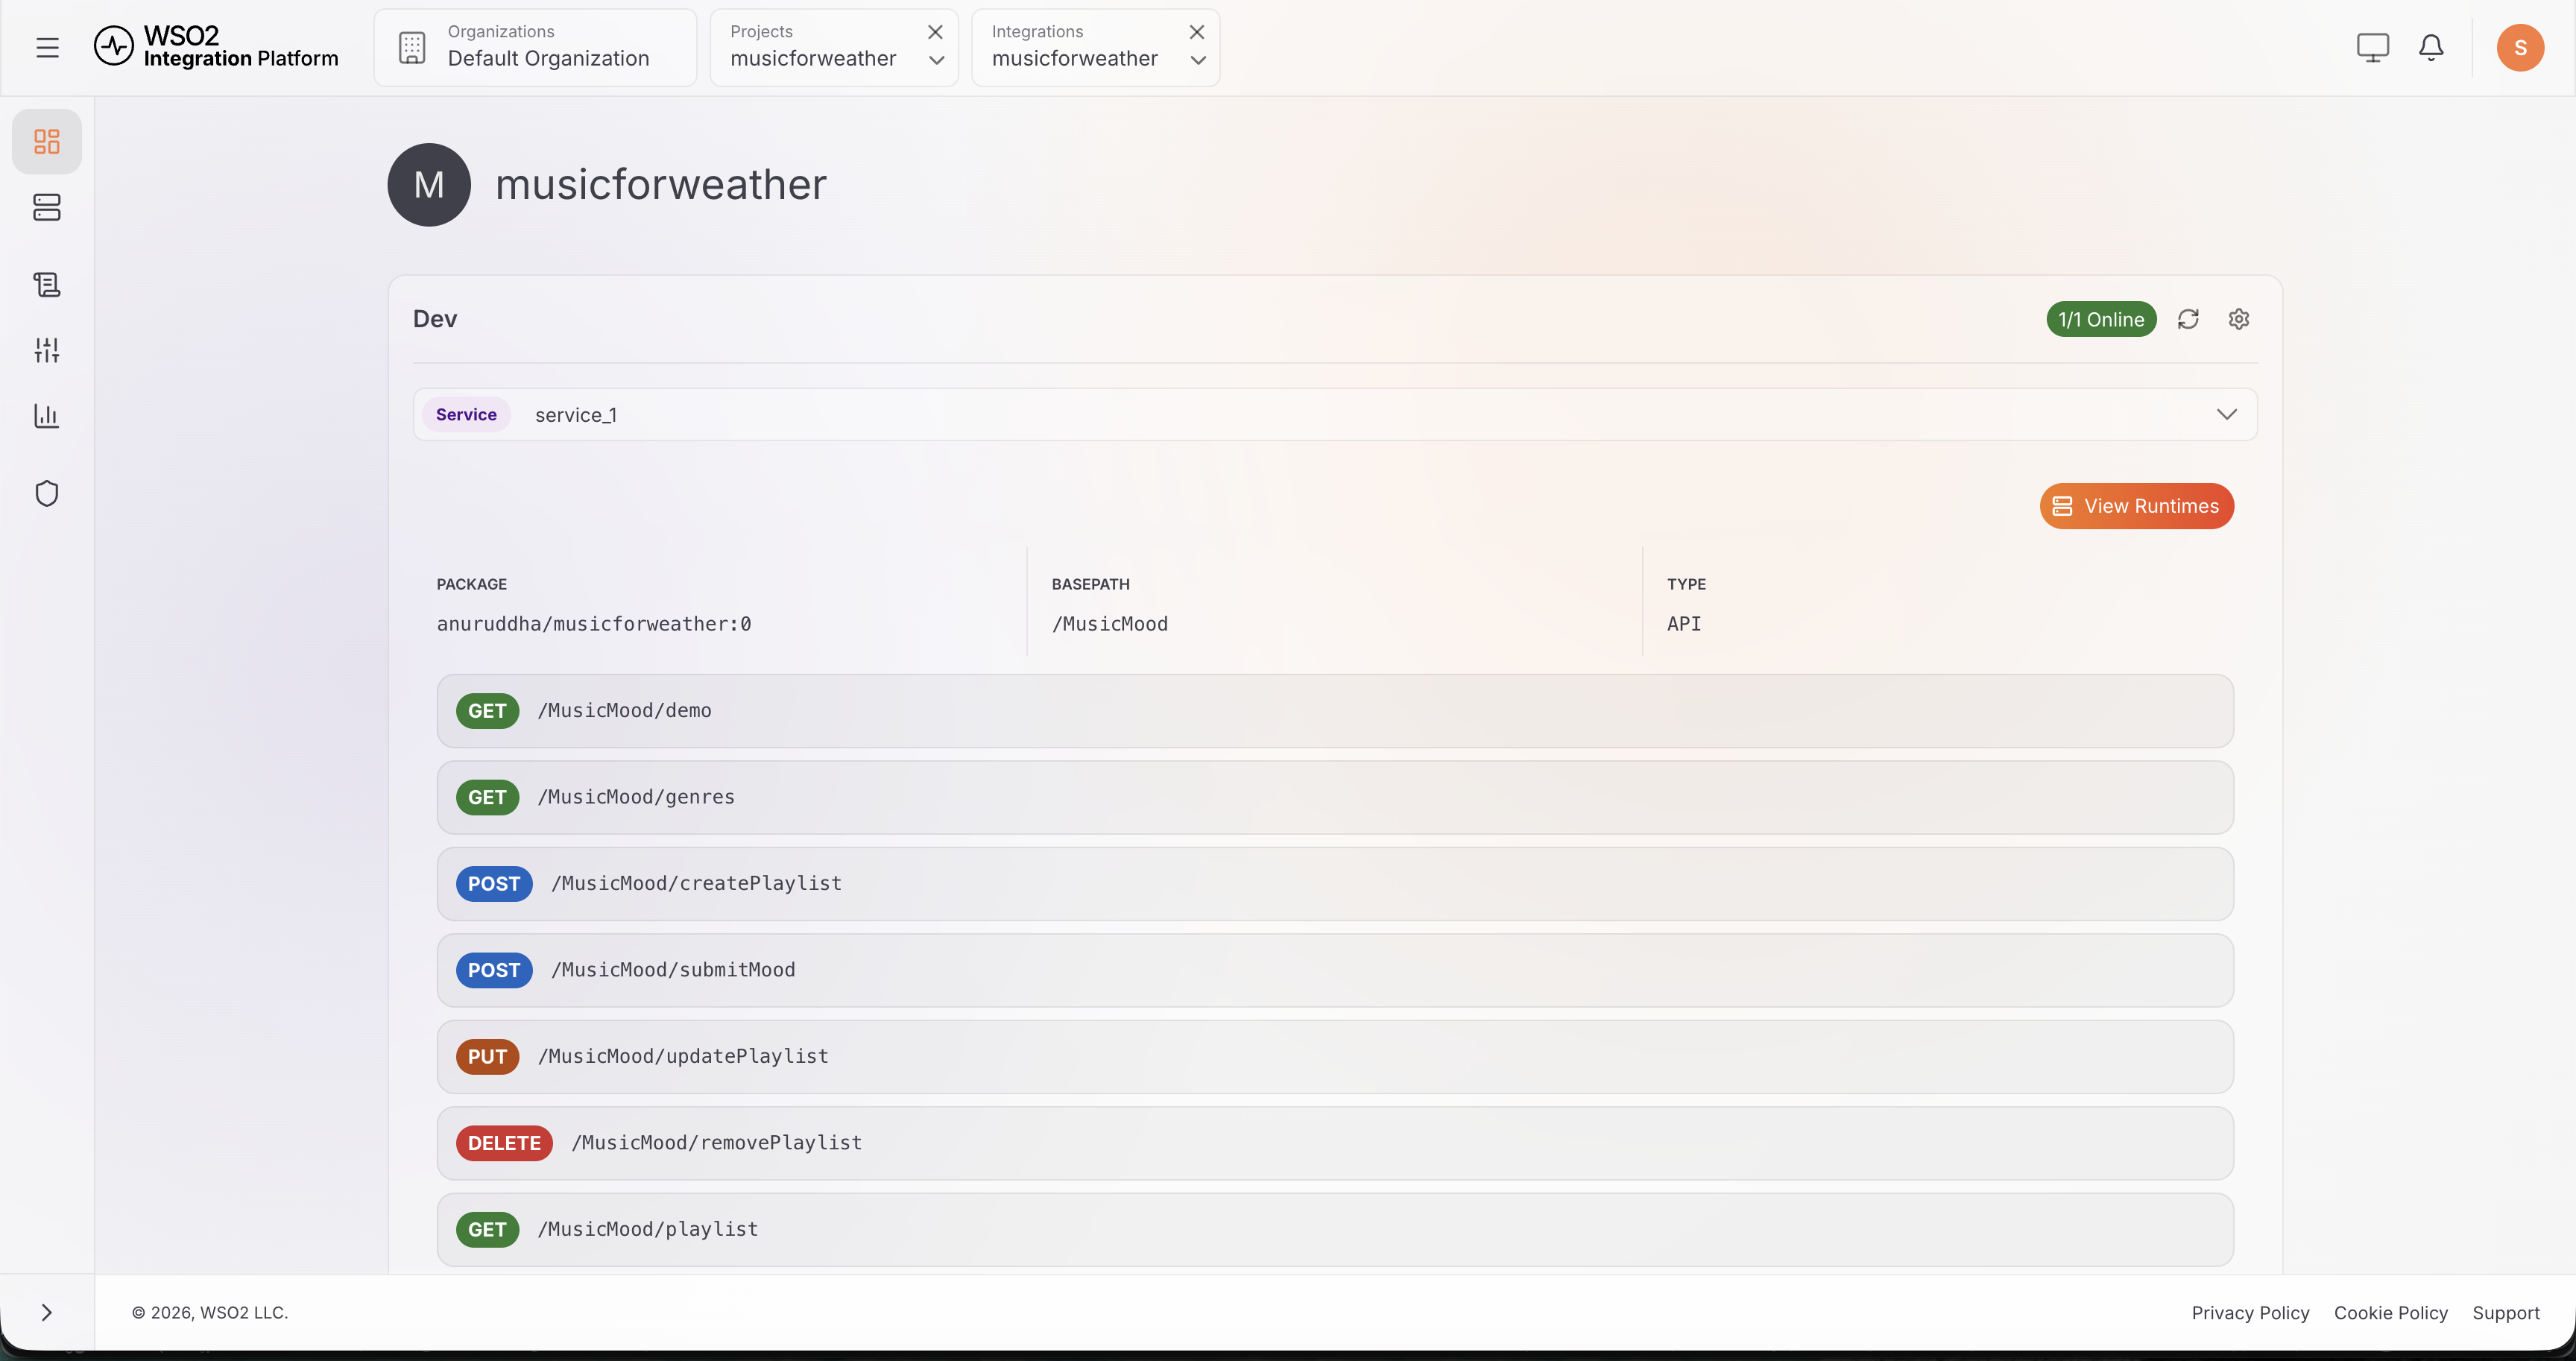
Click on an integration to view integration artifacts.
What's next
- Logging — Configure structured logging
- Metrics — Prometheus metrics and Grafana dashboards
- Jaeger — Distributed tracing with Jaeger
- Observability Setup — Set up centralized logs and metrics monitoring