Observability Setup
ICP provides centralized observability for default profile runtimes. Logs and metrics are collected via Fluent Bit, stored in OpenSearch, and displayed in the ICP console. This page guides you through deploying OpenSearch, creating index templates, configuring the integration, and setting up Fluent Bit to complete the observability stack.
For MI runtimes, see MI observability setup.
- ICP server running with OpenSearch connection configured in
deployment.toml. Usehttps://if OpenSearch is running with TLS (including the demo setup). See Install ICP. - Integration connected to ICP with heartbeats working. See Connect an integration to ICP.
- Fluent Bit installed on the machine running the default profile runtime. See the Fluent Bit installation page.
Architecture
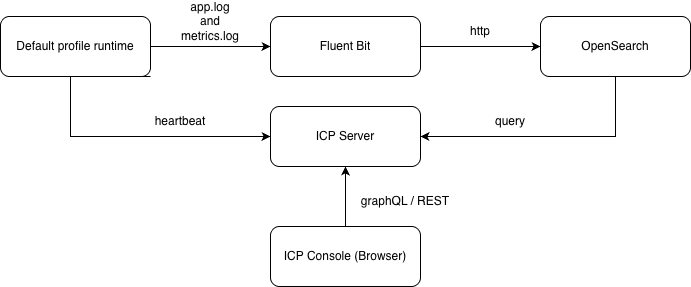
- The default profile runtime writes structured logs to two files (
app.logandmetrics.log) and sends periodic heartbeats to the ICP server. - Fluent Bit tails both log files and ships them to separate OpenSearch indices over HTTP(S).
- When a user opens the Logs or Metrics page, the ICP console sends a GraphQL or REST request to the ICP server, which queries OpenSearch and returns the results.
1. Deploy OpenSearch
Any single-node or clustered OpenSearch deployment works. ICP requires HTTP(S) access to the OpenSearch REST API. Keep a note of the host, port, and credentials. You will need them in steps 2 and 4 when configuring Fluent Bit and the ICP server.
If you already have an OpenSearch instance running, skip to step 2.
Download and extract the OpenSearch distribution, then follow the steps below.
Run the security installer
Set your admin password and run the demo installer. It generates self-signed TLS certificates and initializes the security index.
- Linux / macOS
- Windows
export OPENSEARCH_INITIAL_ADMIN_PASSWORD="YourStrong@Pass2026"
export OPENSEARCH_HOME="/path/to/opensearch-2.19.1"

cd $OPENSEARCH_HOME/plugins/opensearch-security/tools
chmod +x install_demo_configuration.sh
./install_demo_configuration.sh -y
$env:OPENSEARCH_INITIAL_ADMIN_PASSWORD="YourStrong@Pass2026"
$env:OPENSEARCH_HOME="C:\opensearch\opensearch-2.19.1"

cd $env:OPENSEARCH_HOME\plugins\opensearch-security\tools
cmd /c install_demo_configuration.bat -y
Configure opensearch.yml
Append the following to config/opensearch.yml. The first setting prevents OpenSearch from waiting for other cluster nodes, and the second allows the security index to initialize automatically on first start:
discovery.type: single-node
plugins.security.allow_default_init_securityindex: true
Start OpenSearch
- Linux / macOS
- Windows
cd $OPENSEARCH_HOME/bin
./opensearch
cd $env:OPENSEARCH_HOME\bin
.\opensearch.bat
Verify OpenSearch is running
curl -sk -u admin:YourStrong@Pass2026 https://localhost:9200
A JSON response with "cluster_name" confirms the node is up.
The demo configuration is for evaluation only. In production, use properly signed certificates and strong credentials. See the OpenSearch security documentation for details.
Configure ICP to connect to OpenSearch
Once OpenSearch is running, point the ICP server at it by adding the following keys before the first [section] header in conf/deployment.toml:
opensearchUrl      = "https://localhost:9200"
opensearchUsername = "admin"
opensearchPassword = "<your-opensearch-password>"
If OpenSearch runs without TLS, use http:// instead.
Once the configuration is saved, start the ICP server:
- Linux / macOS
- Windows
./bin/icp.sh
.\bin\icp.bat
If ICP is already running, restart it for the OpenSearch connection settings to take effect.
2. Create index templates
Index templates tell OpenSearch how to map fields before any data arrives. Apply both templates once per cluster. They cover all indices created by Fluent Bit in the steps ahead.
Application logs template
Maps the time, message, and icp_runtimeId fields for the ballerina-application-logs-* index pattern:
curl -k -X PUT 'https://<opensearch-host>:9200/_index_template/wso2_integration_application_log_template' \
  -u 'admin:<password>' \
  -H 'Content-Type: application/json' \
  -d '{
    "index_patterns": ["ballerina-application-logs-*"],
    "template": {
      "mappings": {
        "properties": {
          "time":           { "type": "date", "format": "yyyy-MM-dd'\''T'\''HH:mm:ss.SSS'\''Z'\''||strict_date_optional_time||epoch_millis" },
          "message":        { "type": "text" },
          "icp_runtimeId":  { "type": "keyword" }
        }
      }
    }
  }'
A {"acknowledged":true} response confirms the template was created.
Metrics logs template
Maps the same base fields plus numeric types for the latency fields used by the ICP Metrics page:
curl -k -X PUT 'https://<opensearch-host>:9200/_index_template/wso2_integration_metrics_log_template' \
  -u 'admin:<password>' \
  -H 'Content-Type: application/json' \
  -d '{
    "index_patterns": ["ballerina-metrics-logs-*"],
    "template": {
      "mappings": {
        "properties": {
          "time":                   { "type": "date", "format": "yyyy-MM-dd'\''T'\''HH:mm:ss.SSS'\''Z'\''||strict_date_optional_time||epoch_millis" },
          "message":                { "type": "text" },
          "response_time_seconds":  { "type": "float" },
          "response_time":          { "type": "long" }
        }
      }
    }
  }'
A {"acknowledged":true} response confirms the template was created.
3. Enable observability in the integration
These changes are additive and build on the base configuration from Connect an integration to ICP. You need to update three files.
Ballerina.toml
Add observabilityIncluded alongside the existing remoteManagement build option:
[build-options]
remoteManagement = true
observabilityIncluded = true
Without observabilityIncluded = true, the ballerinax/metrics.logs module cannot emit per-request metrics.
main.bal
Add the metrics logger import alongside the existing bridge import:
import ballerinax/metrics.logs as _;
import wso2/icp.runtime.bridge as _;
Both are blank imports (as _). They activate automatically at startup.
Ensure to keep the import order as shown.
Config.toml
Add logging and metrics settings alongside the existing [wso2.icp.runtime.bridge] section:
[ballerina.observe]
metricsLogsEnabled = true

[ballerina.log]
format = "logfmt"

[[ballerina.log.destinations]]
path = "./logs/app.log"

[ballerinax.metrics.logs]
logFilePath = "./logs/metrics.log"
This produces two separate log files that Fluent Bit will tail in step 4:
| File | Content | OpenSearch index |
|---|---|---|
logs/app.log | Application logs (startup, errors, user log statements) | ballerina-application-logs-* |
logs/metrics.log | Per-request metrics (response times, status codes, endpoints) | ballerina-metrics-logs-* |
| Setting | Purpose |
|---|---|
metricsLogsEnabled = true | Enables the Ballerina runtime to emit per-request metrics |
format = "logfmt" | Structured log format that Fluent Bit's bal_logfmt_parser can parse |
path | Application log destination |
logFilePath | Metrics log destination (written by ballerinax/metrics.logs) |
The log file paths must match the Fluent Bit Path values configured in step 4. Adjust both sides if you change the directory layout.
Start the application
Run the integration from your project directory:
bal run
On startup, the runtime creates the logs/ directory and begins writing to app.log and metrics.log. These files are what Fluent Bit will tail in step 4.
4. Configure Fluent Bit
Fluent Bit tails the default profile log files and ships them to OpenSearch.
Install Fluent Bit
If you have not installed Fluent Bit yet, download it from the Fluent Bit installation page. Once installed, verify it is available:
fluent-bit --version
Set up the working directory
Run the following commands to create the directory structure and placeholder files:
- Linux / macOS
- Windows
mkdir -p fluent-bit/scripts
touch fluent-bit/fluent-bit.conf fluent-bit/parsers.conf fluent-bit/scripts/scripts.lua
New-Item -ItemType Directory -Force -Path fluent-bit\scripts
New-Item -ItemType File -Force -Path fluent-bit\fluent-bit.conf, fluent-bit\parsers.conf, fluent-bit\scripts\scripts.lua
This produces the following layout:
fluent-bit/
├── fluent-bit.conf
├── parsers.conf
└── scripts/
    └── scripts.lua
parsers.conf
Defines how Fluent Bit parses Ballerina's logfmt output. Both log inputs reference this parser by name. Copy the following into parsers.conf:
[PARSER]
    Name        bal_logfmt_parser
    Format      logfmt
    Time_Key    time
    Time_Format %Y-%m-%dT%H:%M:%S.%L%z
    Time_Keep   On
scripts.lua
Enriches each log record with fields the ICP Metrics page needs, including response_time in milliseconds, status, app, and integration. It also generates a hash-based doc_id for deduplication in OpenSearch.
Copy the content from scripts.lua and paste it into the scripts/scripts.lua file created earlier.
| Function | Purpose |
|---|---|
extract_app_from_path | Derives app_name from the log file path |
enrich_bal_logs | Adds product and app_module fields |
construct_bal_app_name | Builds the app and deployment fields |
extract_bal_metrics_data | Parses metrics-specific fields (response time in ms, status, method, URL) |
generate_document_id | Creates a hash-based doc_id for deduplication |
The Lua enrichment is required for the ICP Metrics page to display data. Without extract_bal_metrics_data, the ICP server cannot categorize inbound vs. outbound metrics, and the Metrics page shows "No metrics data" even when the underlying OpenSearch index contains records.
fluent-bit.conf
The main pipeline configuration. It reads app.log and metrics.log, enriches each record through the Lua scripts, and writes to separate OpenSearch indices:
| Input path | Tag | Output index prefix |
|---|---|---|
<default-profile-logs>/app.log | ballerina_app_logs | ballerina-application-logs- |
<default-profile-logs>/metrics.log | ballerina_metrics | ballerina-metrics-logs- |
Before using this config, replace the two placeholders:
<default-profile-logs>: absolute path to your default profile application'slogs/directory. Use forward slashes on all platforms.<password>: the OpenSearch password set during step 1.
[SERVICE]
    Flush        1
    Parsers_File parsers.conf
    Log_Level    info

# ── App logs ──
[INPUT]
    Name         tail
    Path         <default-profile-logs>/app.log
    Parser       bal_logfmt_parser
    Tag          ballerina_app_logs
    Read_from_Head On
    Path_Key     log_file_path

# ── Metrics logs ──
[INPUT]
    Name         tail
    Path         <default-profile-logs>/metrics.log
    Parser       bal_logfmt_parser
    Tag          ballerina_metrics
    Read_from_Head On
    Path_Key     log_file_path

# ── Enrich app logs ──
[FILTER]
    Name    lua
    Match   ballerina_app_logs
    Script  scripts/scripts.lua
    Call    extract_app_from_path

[FILTER]
    Name    lua
    Match   ballerina_app_logs
    Script  scripts/scripts.lua
    Call    enrich_bal_logs

[FILTER]
    Name    lua
    Match   ballerina_app_logs
    Script  scripts/scripts.lua
    Call    construct_bal_app_name

# ── Enrich metrics logs ──
[FILTER]
    Name    lua
    Match   ballerina_metrics
    Script  scripts/scripts.lua
    Call    extract_app_from_path

[FILTER]
    Name    lua
    Match   ballerina_metrics
    Script  scripts/scripts.lua
    Call    enrich_bal_logs

[FILTER]
    Name    lua
    Match   ballerina_metrics
    Script  scripts/scripts.lua
    Call    construct_bal_app_name

[FILTER]
    Name    lua
    Match   ballerina_metrics
    Script  scripts/scripts.lua
    Call    extract_bal_metrics_data

# ── Document IDs (deduplication) ──
[FILTER]
    Name    lua
    Match   ballerina_app_logs
    Script  scripts/scripts.lua
    Call    generate_document_id
    time_as_table true

[FILTER]
    Name    lua
    Match   ballerina_metrics
    Script  scripts/scripts.lua
    Call    generate_document_id
    time_as_table true

# ── Outputs ──
[OUTPUT]
    Name            opensearch
    Match           ballerina_app_logs
    Host            localhost
    Port            9200
    Logstash_Format On
    Logstash_Prefix ballerina-application-logs
    Replace_Dots    On
    Suppress_Type_Name On
    Id_Key          doc_id
    tls             On
    tls.verify      Off
    HTTP_User       admin
    HTTP_Passwd     <password>

[OUTPUT]
    Name            opensearch
    Match           ballerina_metrics
    Host            localhost
    Port            9200
    Logstash_Format On
    Logstash_Prefix ballerina-metrics-logs
    Replace_Dots    On
    Suppress_Type_Name On
    Id_Key          doc_id
    tls             On
    tls.verify      Off
    HTTP_User       admin
    HTTP_Passwd     <password>
| Setting | Notes |
|---|---|
tls On / tls.verify Off | Required when using the demo setup from step 1 (self-signed certificate). Set tls Off for plain HTTP. |
HTTP_User / HTTP_Passwd | OpenSearch credentials set during setup. |
Id_Key doc_id | Enables deduplication. If Fluent Bit restarts and re-reads the same lines, OpenSearch overwrites instead of creating duplicates. |
Replace_Dots On | Required. Ballerina logfmt fields contain dots (e.g. src.module, http.method) which OpenSearch rejects as field names. This converts them to underscores. |
Start Fluent Bit
Run Fluent Bit from the working directory with your configuration file:
fluent-bit -c /path/to/fluent-bit/fluent-bit.conf
Fluent Bit will begin tailing the log files immediately. Check the console output for any connection errors to OpenSearch.
Verification
Check OpenSearch indices
After the default profile runtime has been running for a minute or two:
curl -sk -u admin:<password> https://localhost:9200/_cat/indices/ballerina-*?v
You should see:
ballerina-application-logs-2026.04.30
ballerina-metrics-logs-2026.04.30
For plain HTTP OpenSearch (no TLS), use http:// and drop -k.
Check ICP console
- Log into the ICP console at
https://<icp-host>:9446. - Navigate to Projects > <project> > Integrations > <integration>.
- The integration overview shows the service endpoints and environment cards with runtime status.
- Click Logs in the sidebar. You should see runtime log entries with timestamps, log levels, and messages. Use the environment, level, and time range filters to narrow results.
- Click Metrics in the sidebar. You should see:
- Summary cards: Total Requests, Error Count, Error Percentage, 95th Percentile latency
- Requests Per Minute chart (success vs. failed)
- Request Latency chart (average, P50, P95, P99)
- Most Used APIs table showing each endpoint with request count, error count, and average response time
Metrics are generated per inbound HTTP request. If the Metrics page shows "No metrics data", send some traffic to your integration first:
curl http://localhost:8090/<your-endpoint>
Troubleshooting
| Symptom | Cause | Fix |
|---|---|---|
| Metrics page shows "No metrics data" | No inbound HTTP requests have been made | Metrics are generated per request. Send traffic to the integration first. |
| Metrics page shows "No metrics data" | metricsLogsEnabled not set | Add metricsLogsEnabled = true to [ballerina.observe] in Config.toml |
| Metrics page shows "No metrics data" | Metrics log file not configured | Set logFilePath in [ballerinax.metrics.logs] |
| Metrics page shows "No metrics data" | Lua enrichment scripts missing from Fluent Bit config | Add the Lua [FILTER] blocks (especially extract_bal_metrics_data). See step 4. |
| Logs page shows "Observability service is unavailable" | ICP Server can't reach OpenSearch | Verify opensearchUrl in ICP Server's deployment.toml |
| OpenSearch rejects documents with "total fields [1000] exceeded" | Deeply nested JSON in log messages | Increase limit: curl -X PUT '.../_settings' -d '{"index.mapping.total_fields.limit": 2000}' or add to the index template |
Index lifecycle
Indices are created daily with a date suffix (e.g. ballerina-metrics-logs-2026-04-28). To manage disk usage:
- Use OpenSearch Index State Management (ISM) policies to automatically delete or roll over old indices.
- A typical retention policy keeps 30 days of logs and 90 days of metrics.
Security notes
- In production, enable TLS on OpenSearch and set
tls.verify Onin Fluent Bit. - Use dedicated OpenSearch credentials for Fluent Bit (write-only) and ICP server (read-only).
- The ICP server generates short-lived JWTs (2 min) for internal communication between its observability service and its OpenSearch adapter. No user configuration is needed.
What's next
- Manage integrations — view logs and metrics for connected integrations from the ICP console
- Manage runtimes — monitor runtime health and status alongside observability data
- Access control — control who can view logs and metrics in the ICP console