Profiling
The Ballerina profiler samples your integration at runtime and produces an interactive flame graph that shows where execution time is spent. Use it when you have a slow integration and need to find the hot path before tuning anything.
The profiler is experimental and adds significant overhead. Run it in development or a load-test environment, not in production.
Run the profiler
From the project root, run:
bal profile
The profiler proceeds through six stages: initializing the session, copying the executable, performing analysis, instrumenting functions, running the executable, and generating output. When it finishes, an interactive HTML report is written to target/bin/ProfilerOutput.html.
Profile a service
For an HTTP service or any long-running integration, drive traffic at the profiled process and stop it when you have a representative sample.
# Terminal 1: start the service under the profiler
bal profile

# Terminal 2: drive requests
curl http://localhost:9090/api/orders
curl -X POST http://localhost:9090/api/orders \
  -H "Content-Type: application/json" \
  -d '{"product": "Widget", "quantity": 5}'
Press Ctrl+C in the first terminal to stop the run. The profiler writes target/bin/ProfilerOutput.html; open it in a browser to explore the flame graph.
Read the flame graph
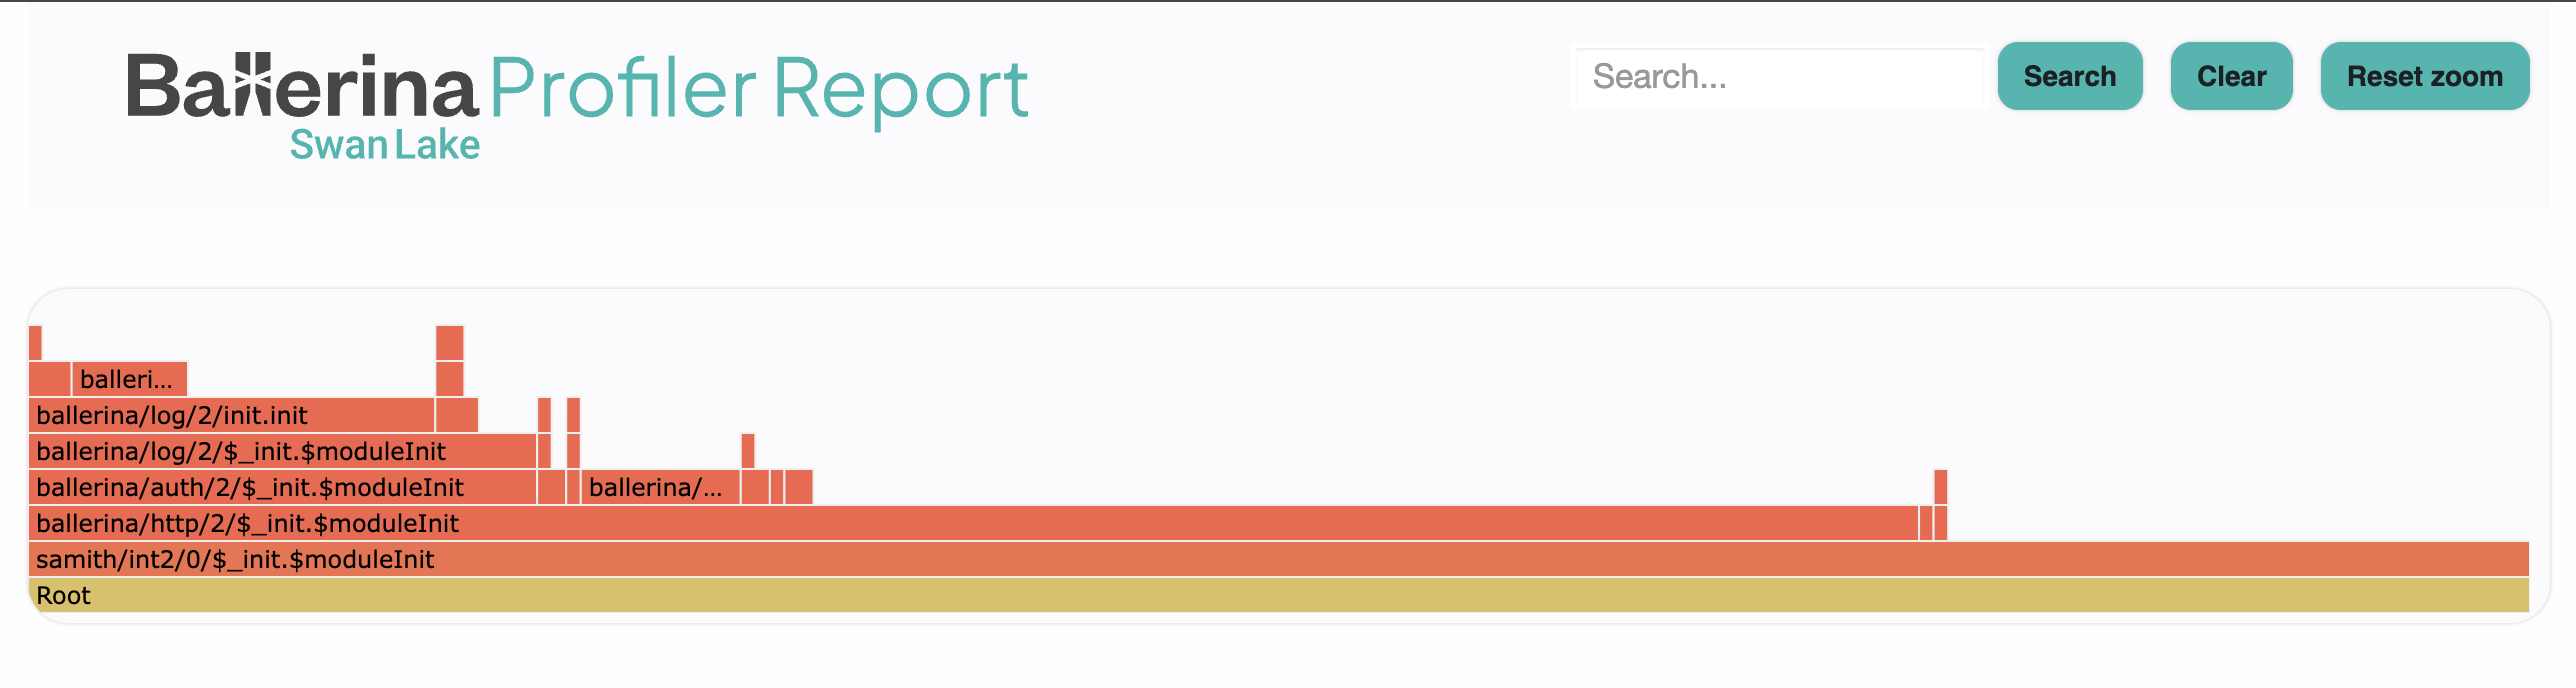
Each bar in the graph represents a function call.
- Bar width is proportional to time spent in that function.
- Vertical stacking shows the call hierarchy. Callers are below, callees above.
- Wide bars at the bottom consume the most total time, but the time may be spread across their children.
- Wide bars at the top are the actual hotspots, since they have no further callees to pass the time to.
Use the search, zoom, and reset controls to focus on specific call paths.
Tune connection pools
If the flame graph points at network or database calls, the next step is usually pool configuration. A pool that is too small queues requests; a pool that is too large can overwhelm the backend.
HTTP client pool
http:Client apiClient = check new ("http://backend.internal", {
    poolConfig: {
        maxActiveConnections: 200,
        maxIdleConnections: 50,
        waitTime: 10
    },
    timeout: 30
});
SQL connection pool
postgresql:Client dbClient = check new (
    host = "localhost",
    database = "mydb",
    connectionPool = {
        maxOpenConnections: 25,
        maxConnectionLifeTime: 600.0,
        minIdleConnections: 5
    }
);
If many strands are waiting on a pool, see Strand dump analysis to confirm the bottleneck before raising limits.
Tune the runtime thread pool
Ballerina's scheduler defaults to a thread pool of number of CPU cores × 2. Override it with the BALLERINA_MAX_POOL_SIZE environment variable:
export BALLERINA_MAX_POOL_SIZE=16
bal run .
Standard Ballerina I/O (HTTP, SQL via Ballerina libraries) is non-blocking, so the default pool is usually enough. Raise the value when long-running blocking calls (legacy JDBC drivers, external Java libraries) tie up scheduler workers and starve other strands. If the blocking call is from a single library, wrap it in a worker so the block is isolated from the main strand.
This is distinct from the SQL connection pool (maxOpenConnections) and the HTTP client pool (maxActiveConnections); those control connections to external services, not the scheduler's worker threads.
Diagnose thread starvation
Symptoms: new HTTP requests stop being accepted even though the service is up, and latency climbs linearly with concurrent requests.
- Capture a strand dump with
kill -SIGTRAP <pid>. Many strands inBLOCKEDstate on external calls indicate scheduler workers are tied up. See Strand dump analysis. - Capture a JVM thread dump with
jstack <pid>and look for threads namedballerina-scheduler-*. If they sit inBLOCKEDorWAITINGinside a blocking call (Java interop, synchronous I/O), the pool is starved.
Tune JVM memory
Ballerina runs on the JVM, so JVM memory tuning applies. Reach for this section when:
OutOfMemoryErrorappears in stderr.- The integration runs for a while and then crashes.
- GC pauses cause latency spikes.
Increase the heap:
export JAVA_OPTS="-Xmx2g -Xms512m"
bal run .
Have the JVM emit a heap dump automatically on OOM so you can analyze it after the fact:
export JAVA_OPTS="-Xmx2g -XX:+HeapDumpOnOutOfMemoryError \
  -XX:HeapDumpPath=/tmp/"
bal run .
If the issue needs deeper investigation, also collect a JVM thread dump (jstack <pid> or kill -3 <pid>) and a strand dump (kill -SIGTRAP <pid>) at the time of the issue.
JAVA_OPTS does not apply to GraalVM native images — they manage their own memory. To control native-image heap size, set -R:MaxHeapSize=512m in graalvmBuildOptions or pass it at runtime.
Verify concurrency safety
The isolated keyword turns concurrency safety into a compile-time check. Mark a service or function isolated and the compiler flags any unsafe access to shared mutable state. This catches data races before they reach production.
Note that even without isolated, the runtime may invoke a resource function concurrently. Without isolation guarantees, you have to enforce safety yourself.
Optimization checklist
- Run independent external calls in parallel using workers.
- Pool connections for databases and HTTP clients.
- Cache values that are read often and change rarely.
- Use typed records instead of repeatedly parsing JSON.
- Minimize serialization and deserialization on the hot path.
- Use query expressions for collection processing.
- Set timeouts on every external call.
- Stream large payloads instead of buffering them in memory.
Best practices
- Measure before optimizing. Profile first, then change one thing at a time.
- Test under realistic load. Single-request profiling hides contention.
- Focus on the critical path. Optimizations off the hot path rarely pay back.
- Compare profiler output before and after each change.
- Monitor production with observability metrics so regressions show up early.
Related
- Strand dump analysis - diagnose concurrency issues spotted while profiling.
- Logging - when logs are a better diagnostic than a live profile.
- Errors and stack traces - read failures back to source.