Insights dashboards
Once Advanced Analytics is enabled, the Insights section of the Console shows a set of interactive dashboards built on your organization's identity activity. This page describes what each dashboard tells you, what your subscription includes, and what to do when you need more than the built-in dashboards offer.
Using the dashboards
Each dashboard is a page of charts you can interact with:
- Switch dashboards using the tabs at the top of the Insights page.
- Change the time range with the duration selector. All charts on the dashboard follow it.
- Hover a chart to read exact values, and click a segment to see the activity behind it.
What your subscription includes
The dashboards you see depend on your WSO2 Identity Platform subscription tier. Higher tiers unlock more of them, and new dashboards appear automatically when you move up a tier - there is nothing to enable.
| Tier | Dashboards |
|---|---|
| Free | Overview |
| Essentials, Professional, and Enterprise | Overview, Authentication, Registrations, Token Issuance, and Agent |
To move to a higher tier, see Subscribe to WSO2 Identity Platform.
Note
The dashboard set grows over time as new insights are added. This page is updated as that happens.
The dashboards
Each dashboard below answers a different set of questions. The charts you see depend on your tier, as listed above.
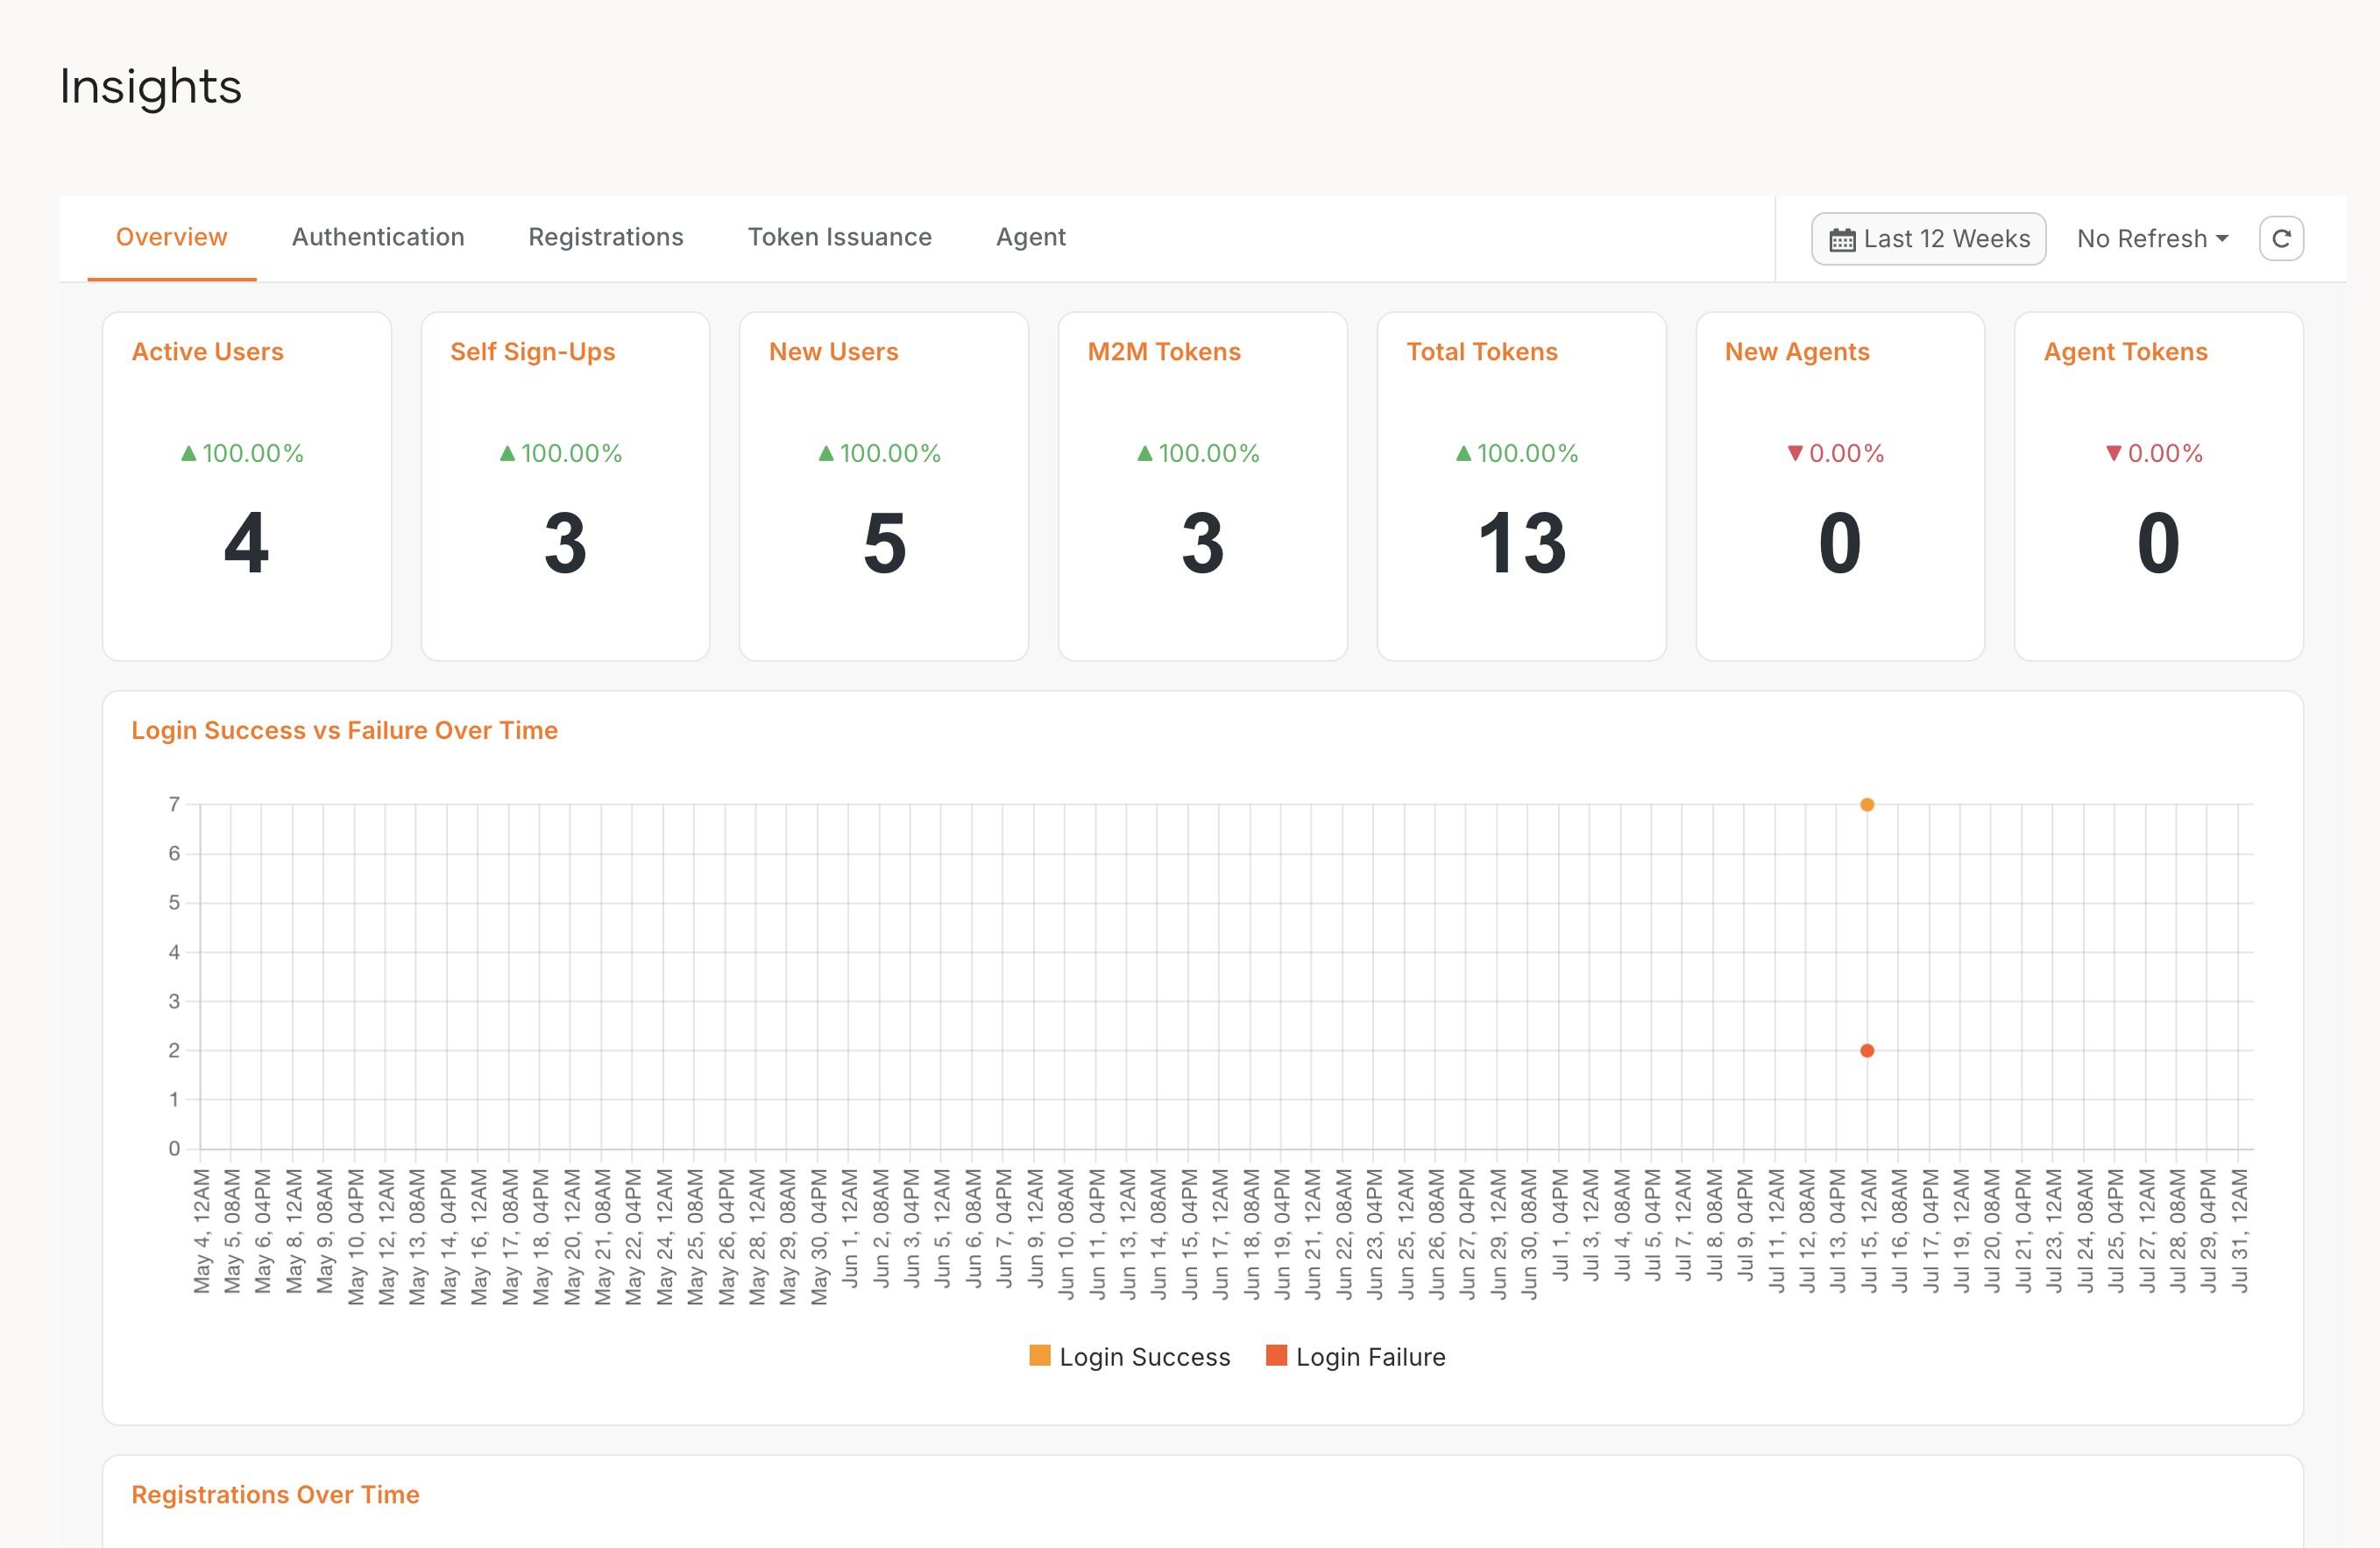
Overview
The starting point: a single page that answers "how is my organization doing right now?"
Every tier shows these:
- Active Users - how many distinct users were active in the selected period.
- M2M Tokens - machine-to-machine (M2M) token issuance.
- New Agents and Agent Tokens - agent activity in your organization.
- Login Success vs Failure Over Time - the login health trend line. A rising failure share is often the first sign of a problem.
- Registrations Over Time - your growth curve.
- Agent Tokens Over Time - agent token issuance trend.
Essentials and above add two more:
- New Users and Self Sign-Ups - how many accounts were created, and how many of those came from self sign-up.
- Total Tokens - total token issuance, alongside the M2M share.
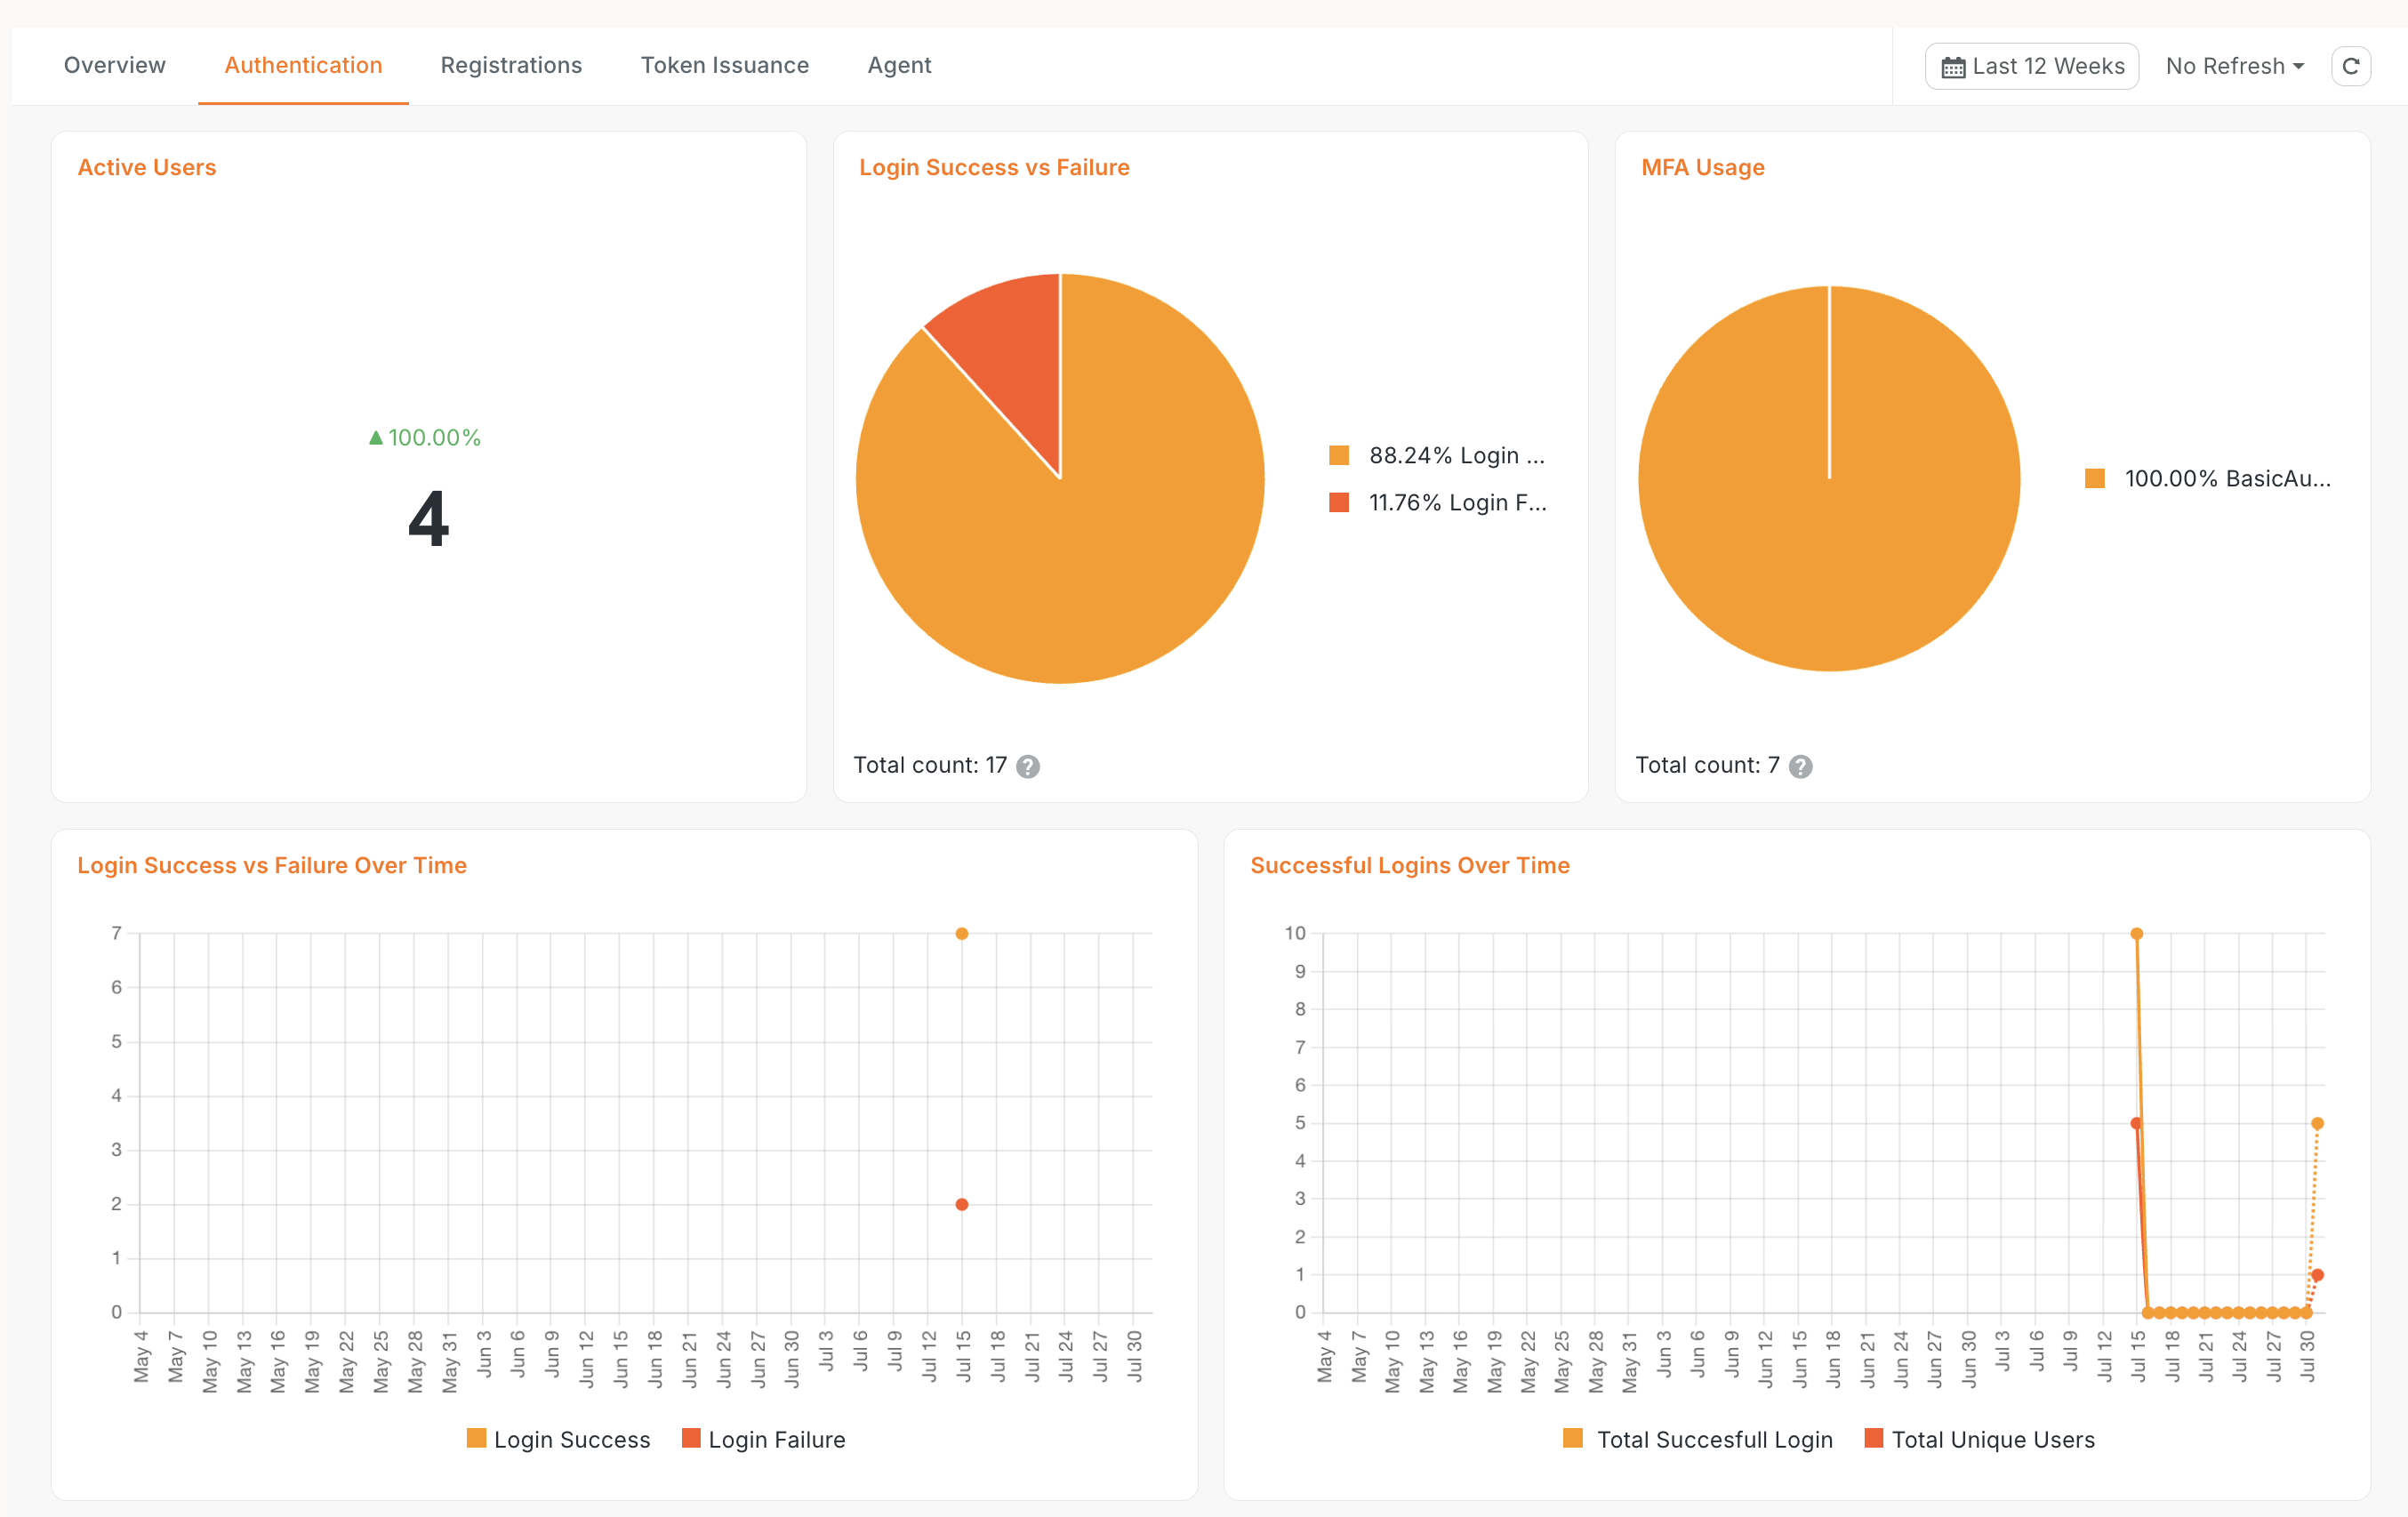
Authentication
Everything about how people log in.
- Active Users - distinct users who logged in.
- Login Success vs Failure - the split for the period.
- MFA Usage - how much of your login traffic goes through multi-factor authentication (MFA), that is, a second factor.
- Login Success vs Failure Over Time and Successful Logins Over Time - trends, useful for spotting the moment something changed.
- Logins by Device - which devices and browsers your users actually use.
- Logins by Application - which applications carry your login traffic.
- Logins by Location - where your users log in from.
Registrations
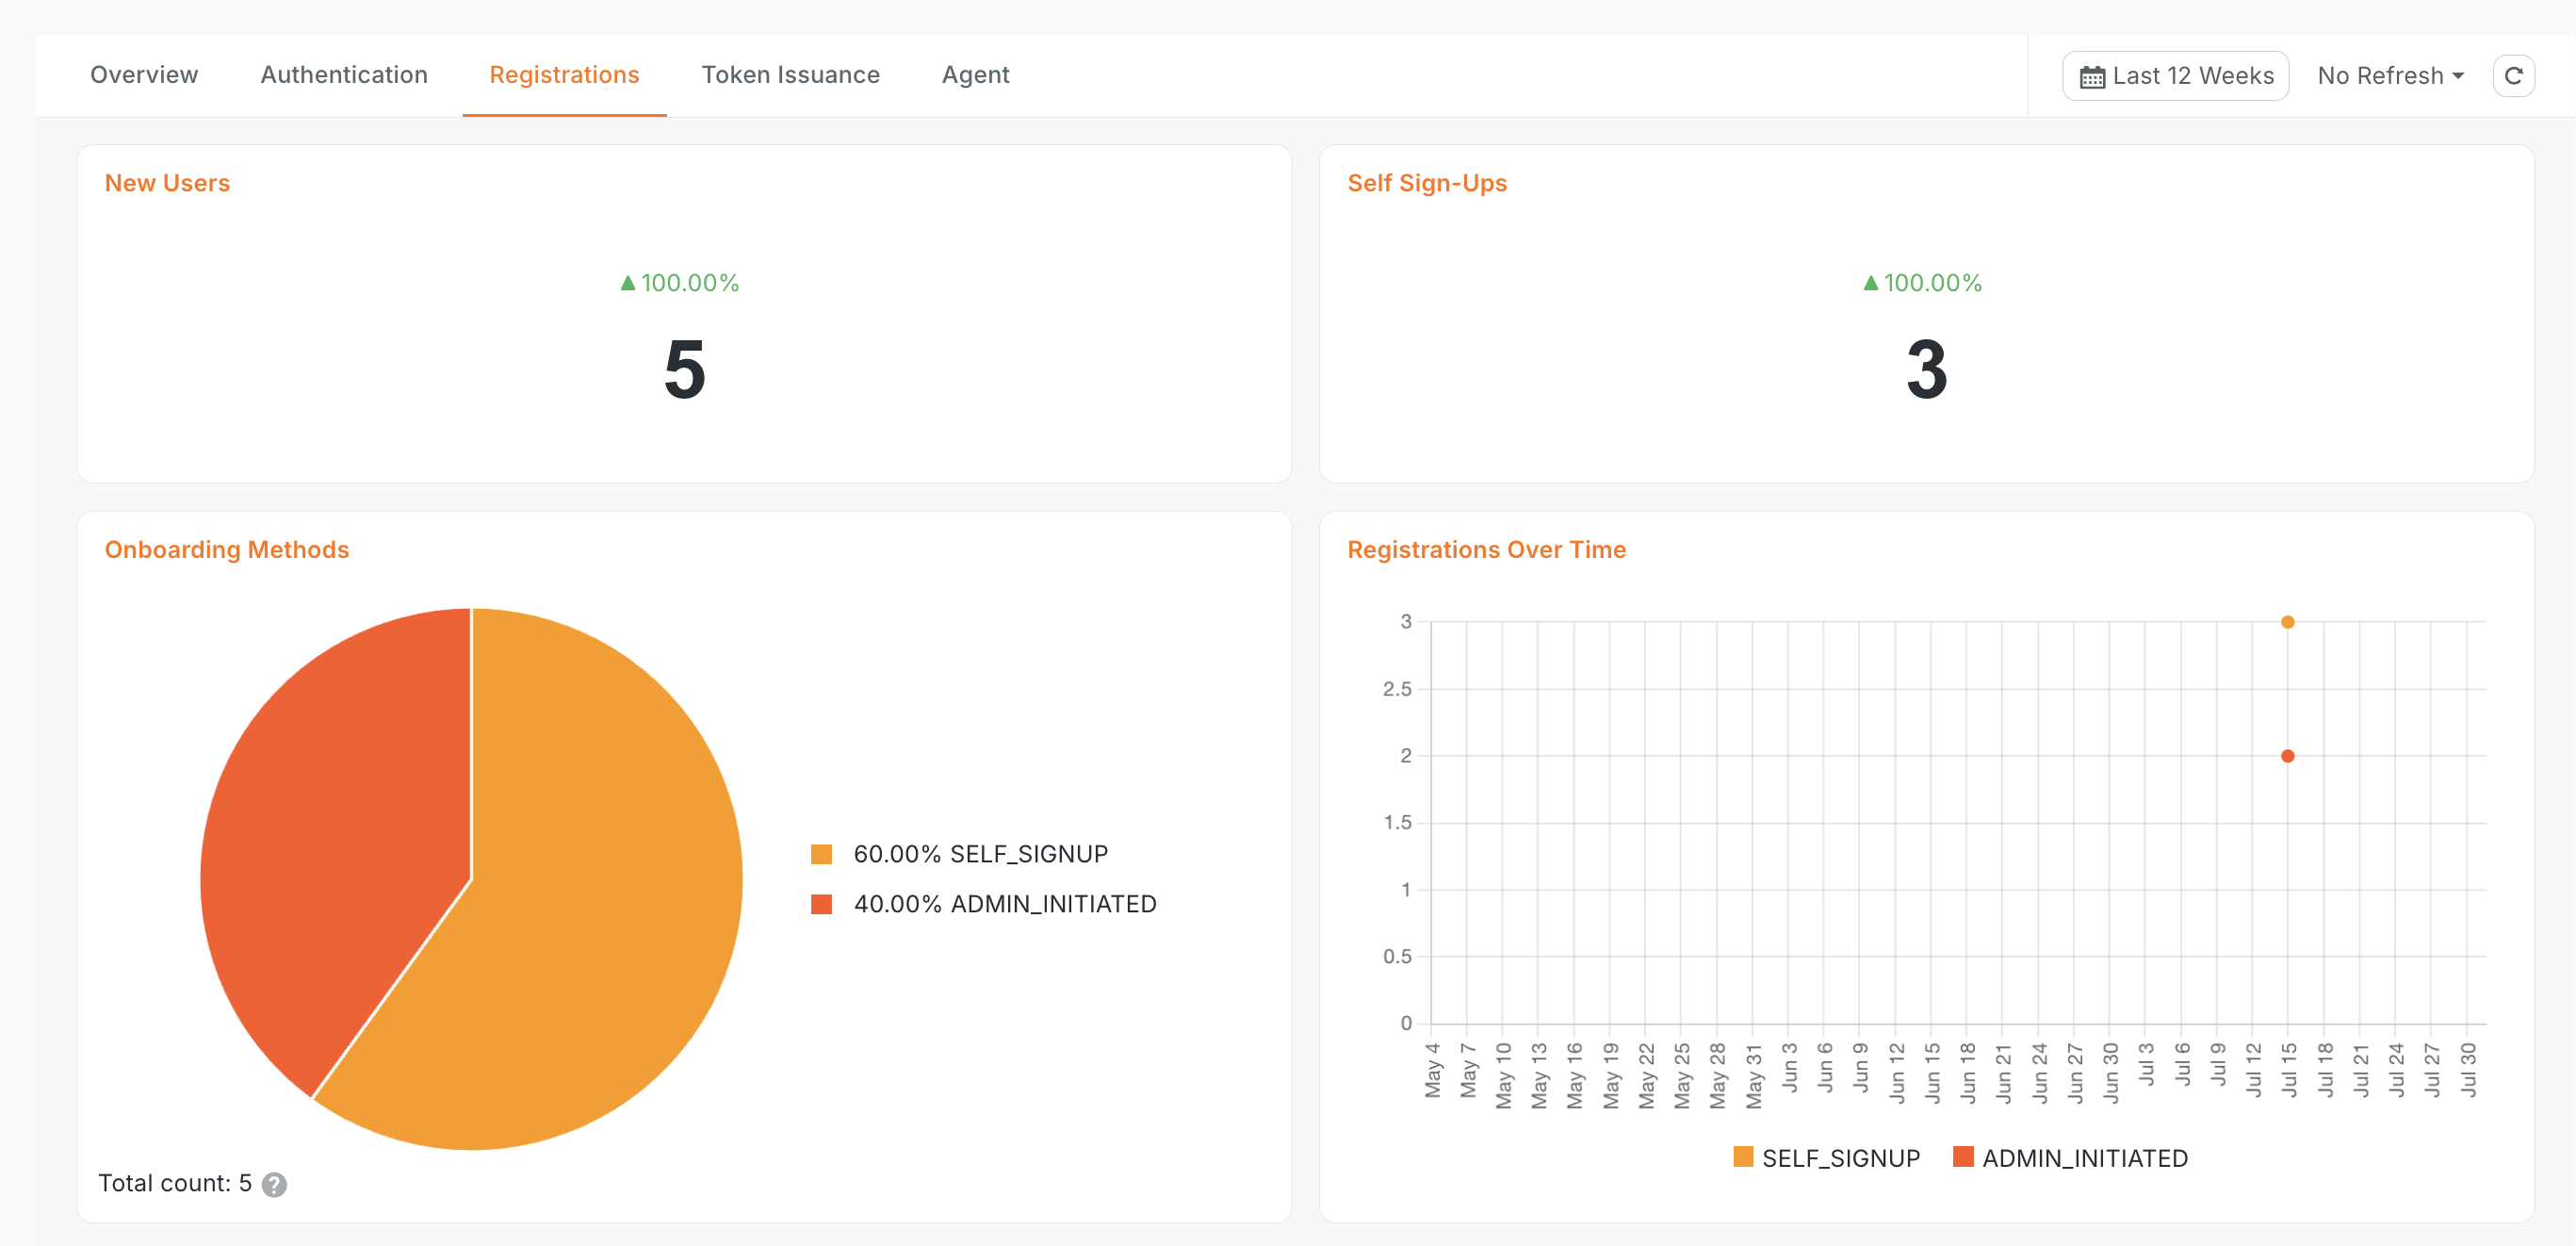
How your user base grows, and through which door.
- New Users - accounts created in the period.
- Self Sign-Ups - how many of those users signed themselves up.
- Onboarding Methods - the split between self sign-up, invitation, and administrator-created accounts.
- Registrations Over Time - the growth trend.
- Registrations by Application - which applications bring you new users.
Token Issuance
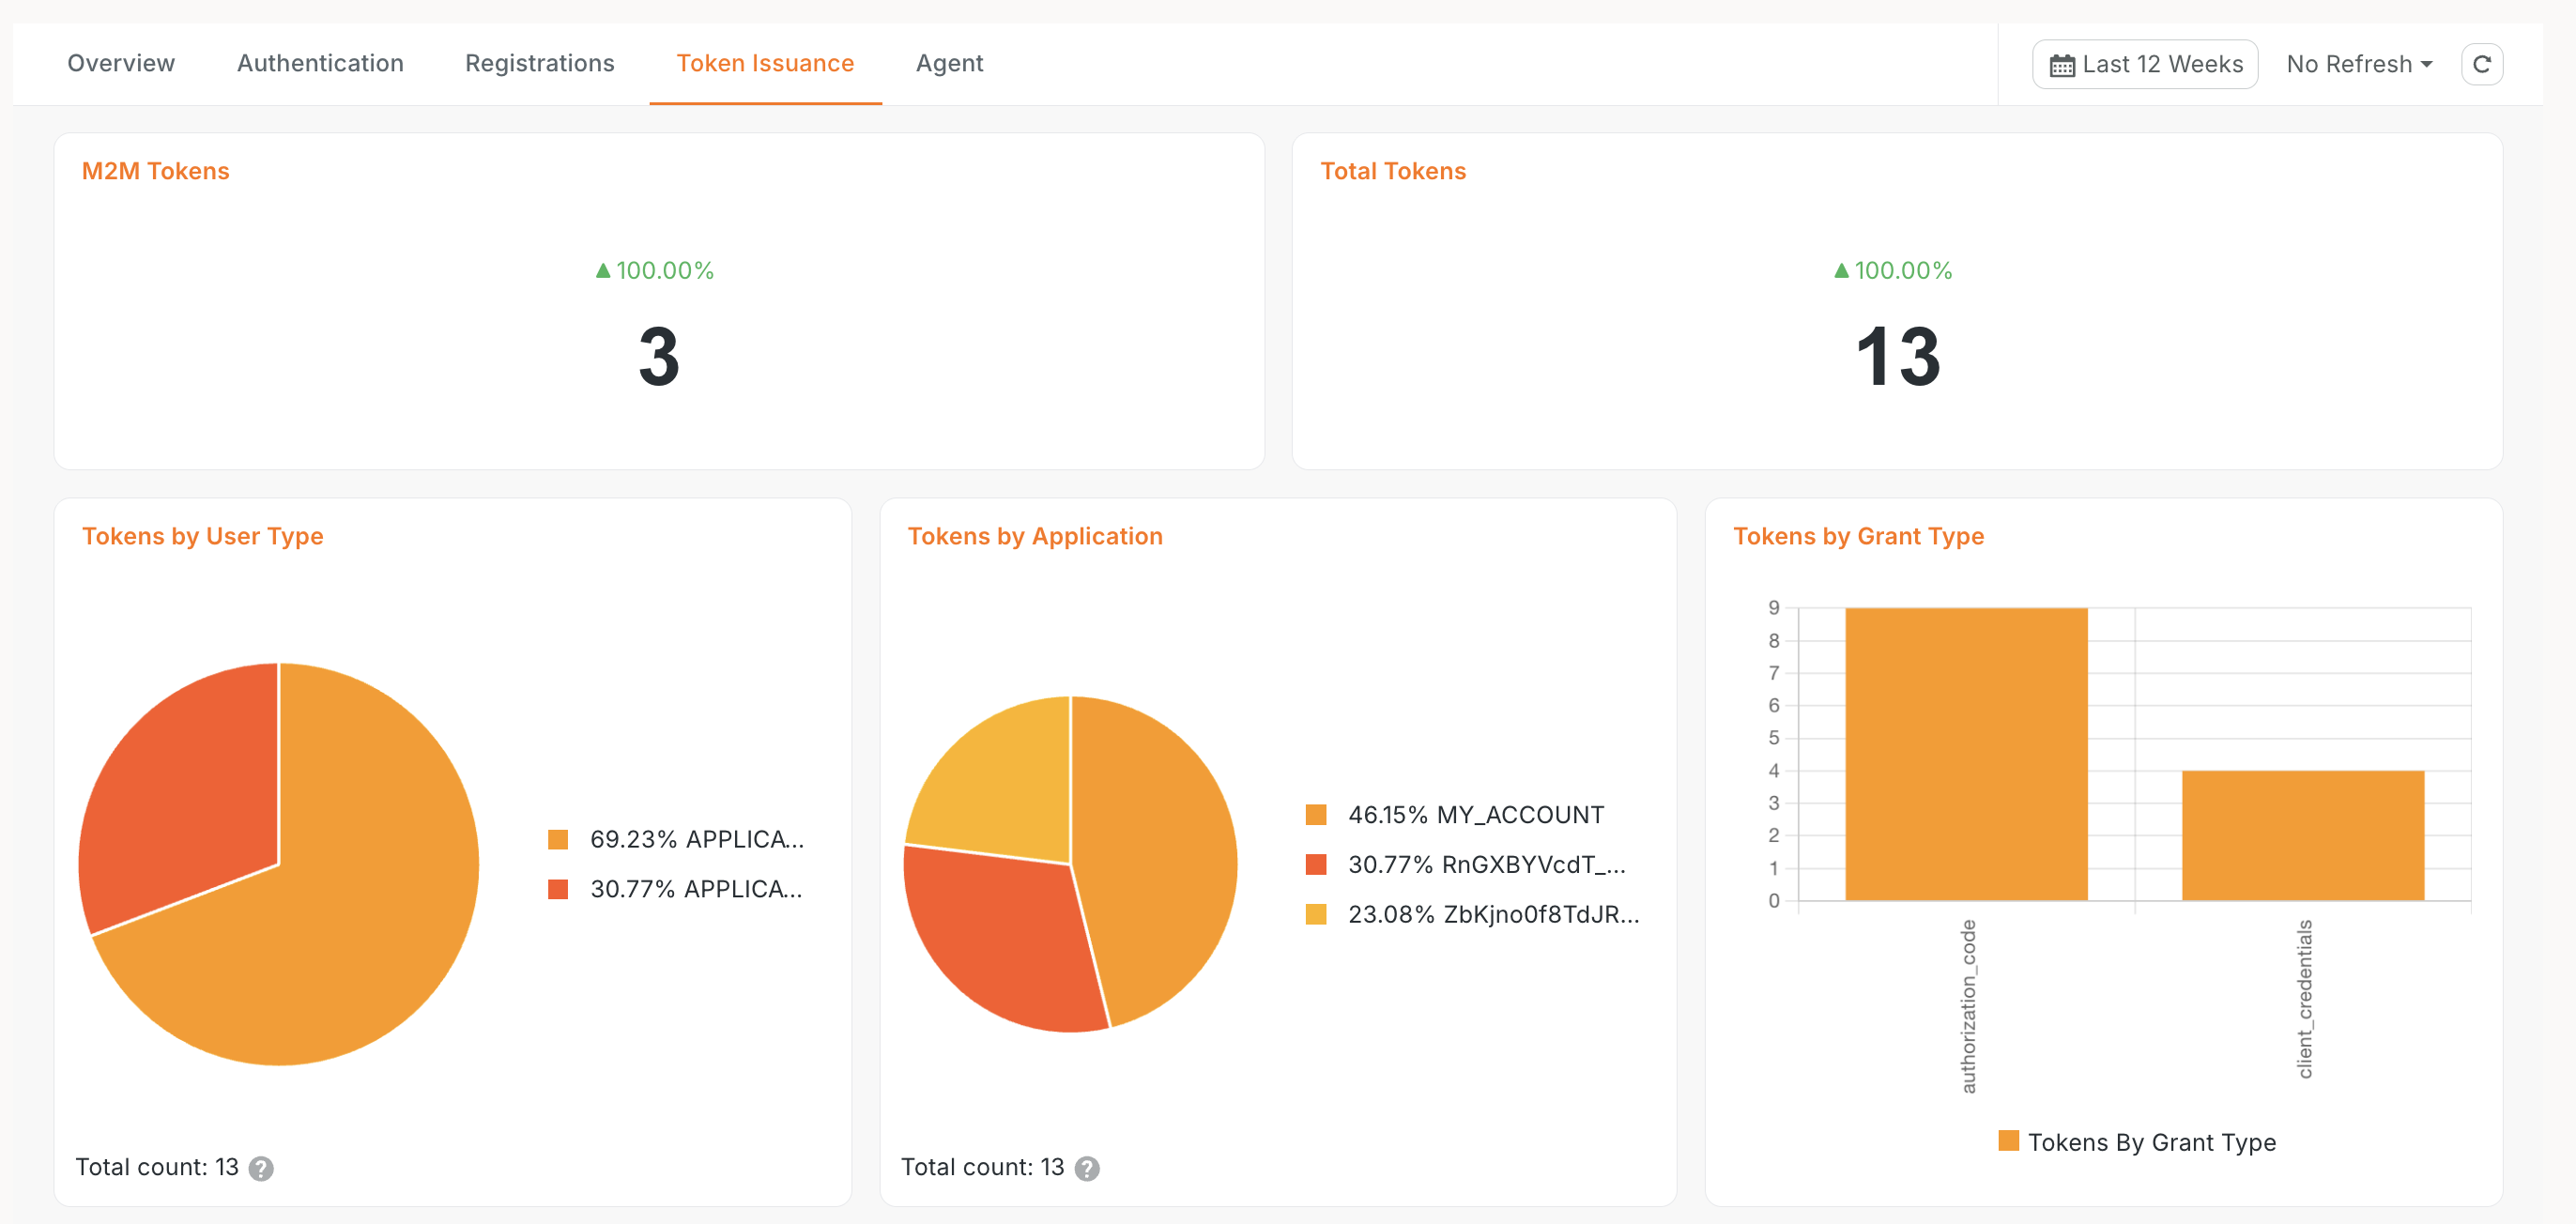
What your applications are consuming.
- Total Tokens and M2M Tokens - total issuance and the machine-to-machine share.
- Tokens by User Type - end-user tokens versus application tokens.
- Tokens by Application - which clients consume the most.
- Tokens by Grant Type - which OAuth2 grants are in use.
- Tokens Issued Over Time - the issuance trend.
Agent
Activity from AI agents in your organization.
- New Agents and Active Agents - how many agents exist and how many are in use.
- Agent Tokens - tokens issued to agents.
- Agent Logins Over Time and Agent Tokens Over Time - agent activity trends.
Data retention
Your analytics data is retained for 1 to 3 months by default. The dashboards show activity within that window, so the longest period you can select is bounded by it.
Going beyond the built-in dashboards
The built-in dashboards cover the questions most organizations ask. Sometimes you need more: a chart shaped around your own business, a longer view of history, or analytics data pulled into your own tools. For those cases, move to a dedicated Moesif subscription for your organization.
With your own Moesif subscription you get:
- Longer data retention, beyond the default 1 to 3 months.
- Your own dashboards, built on the same identity events that power the built-in ones. Every attribute available to filter and group by is listed in Data published to Moesif.
- Alerts and reports on the metrics that matter to you.
- Direct access to your analytics data through the Moesif portal and APIs.
How to get a Moesif subscription
-
Review the available plans on the Moesif pricing page to work out which one fits your volume and retention needs.
-
Contact WSO2 to arrange the subscription for your organization. Your existing WSO2 Identity Platform identity data continues to flow into the dedicated workspace, so your dashboards keep working while you build on top of them.
-
Once your workspace is provisioned, log in to the Moesif portal and start building.
Building your own dashboards
In Moesif, a dashboard is a collection of charts, and each chart is a query over your identity events. To create one:
-
In the Moesif portal, create a new chart and choose the event type you want to analyze - for example,
User-Authenticationfor logins orOAuth-Token-Issuancefor tokens. -
Choose what to measure (a count of events, or distinct users) and what to break it down by (any attribute on the event, such as the application, the connection, or the grant type).
-
Add filters to narrow the chart, for example to a single application or to failed logins only.
-
Save the chart to a dashboard, and repeat until the dashboard answers your question.
Data published to Moesif is the reference you will want open while doing this: it lists every event and every attribute you can filter or group by.