Editor Debugging
Editor debugging lets you pause an integration mid-run and inspect the values flowing through it. This page covers the everyday quick start: set a breakpoint and launch a debug session. For the full set of features available once the session is running (stepping, inspection panels, advanced breakpoints, and test or remote debugging), see Features.
Before you start
- Open the integration project in WSO2 Integrator.
- Confirm the integration has an executable entry point, such as a service or an automation.
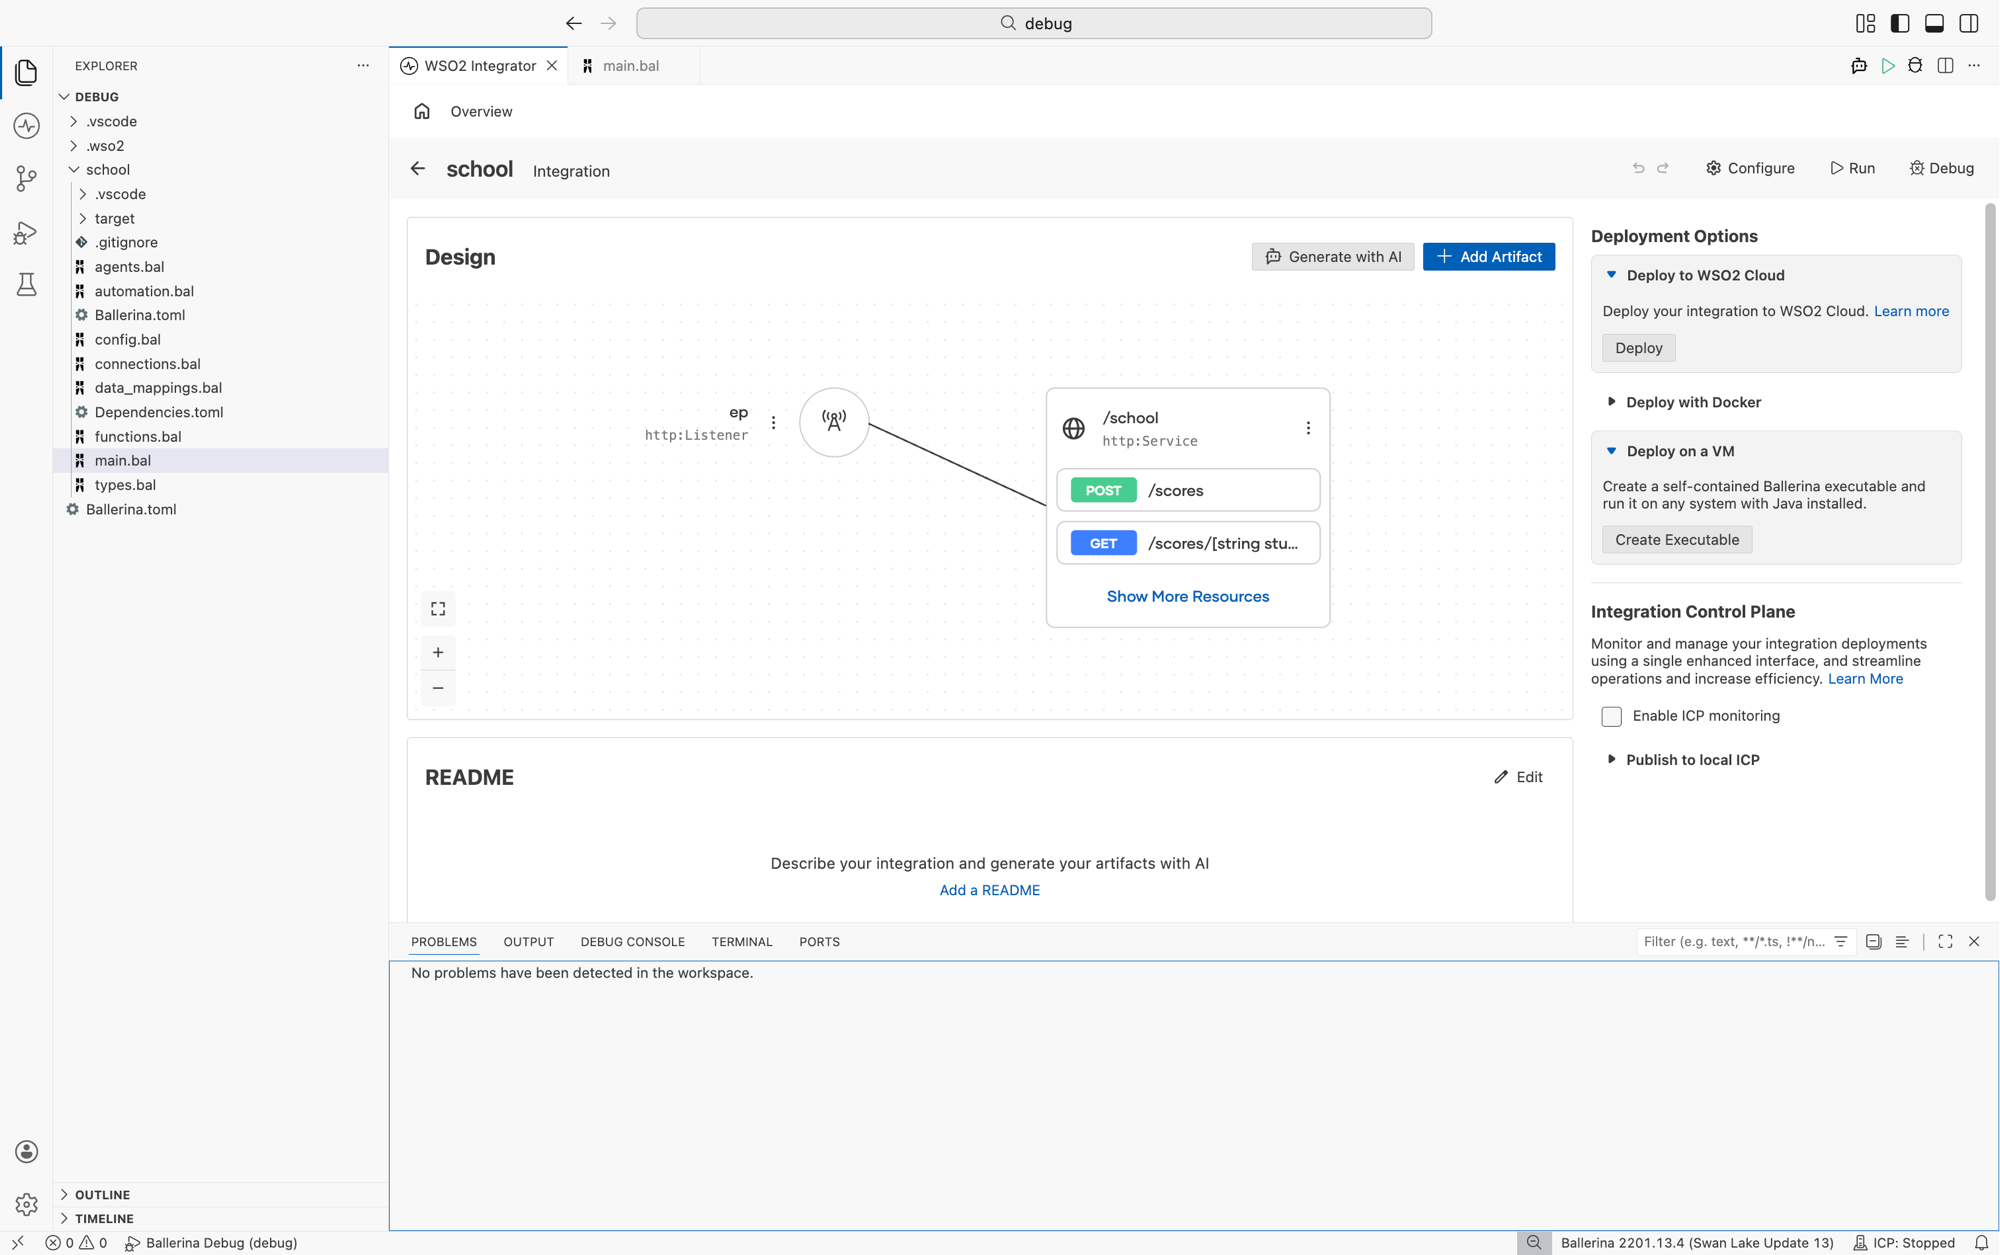
- Open the Problems panel at the bottom of the editor and make sure the workspace is free of compile errors.
Set a breakpoint
Breakpoints tell the debugger where to pause. Set one on the line or node where you want to start inspecting state.
- Visual Designer
- Ballerina Code
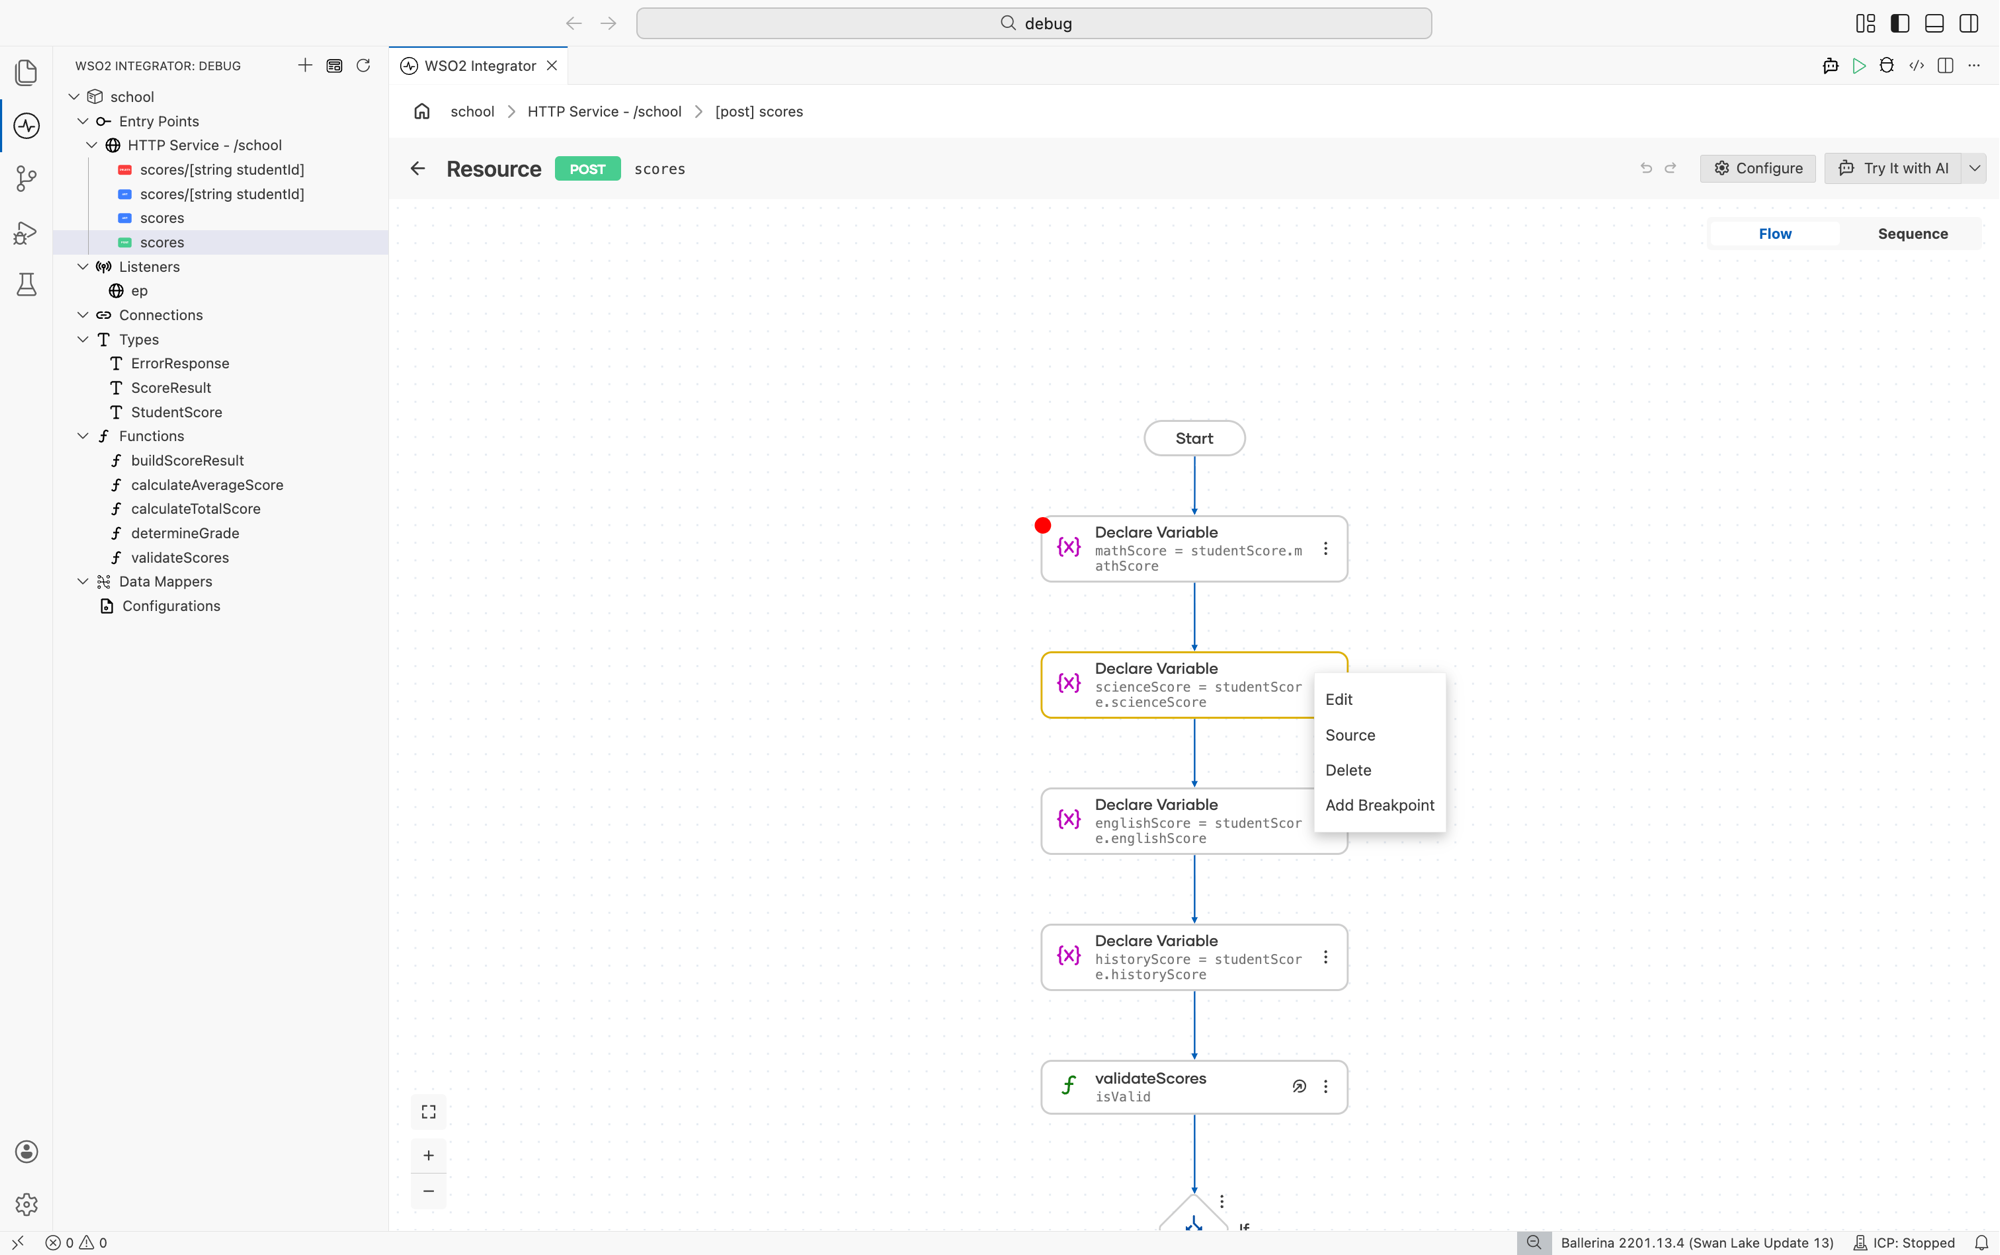
- Open the integration in the visual designer.
- Click the three-dot menu on the node where you want to pause.
- Select Add Breakpoint.
A red dot appears on the node to confirm the breakpoint is active.
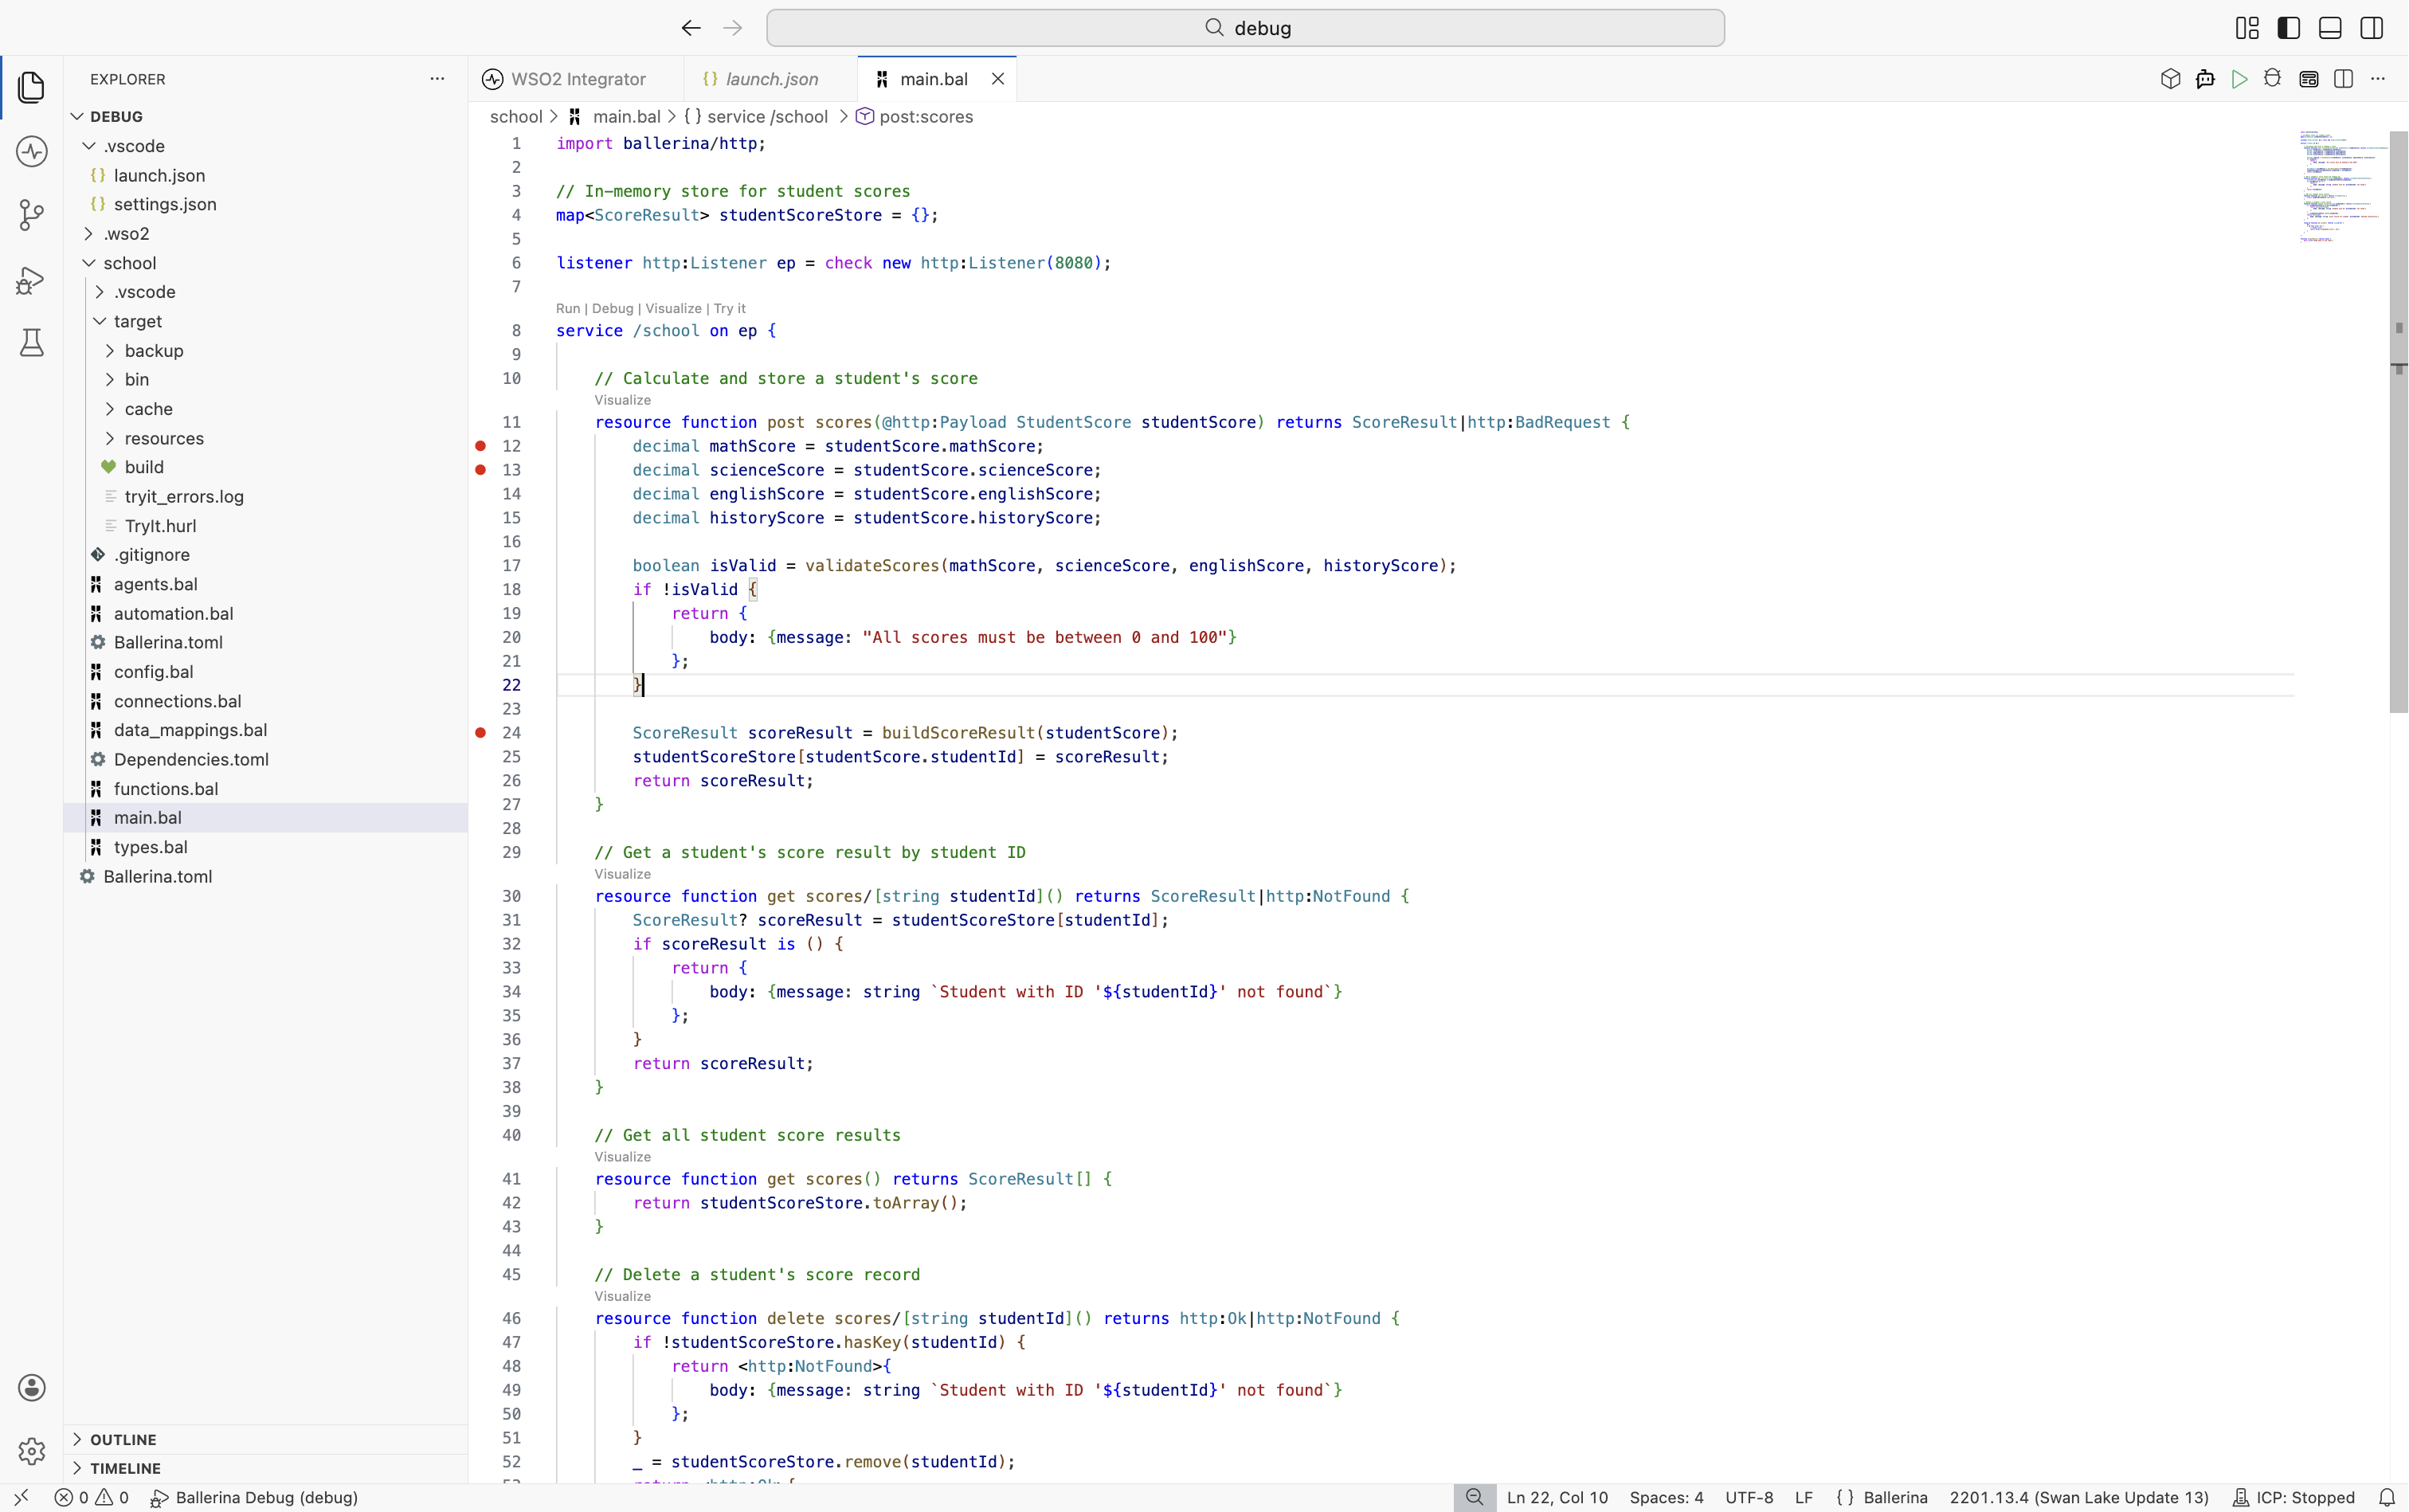
- Open the
.balfile. - Click in the gutter to the left of the line number where you want to pause.
A red dot appears next to the line.
Start a debug session
Click Debug on the editor toolbar, or open the Run and Debug view from the activity bar and select Ballerina Debug. Either path works for most integrations.
Execution pauses at the first breakpoint it hits. Output streams to the Debug Console.
Advanced debugging methods
Most debugging happens against a program running locally from the editor. The next two methods cover the cases that do not fit that pattern: debugging tests, or attaching to an integration that is already running somewhere else.
Test debugging
Set breakpoints inside the test functions first, then launch the test session in one of two ways:
- Open the Run and Debug view from the activity bar, select Ballerina Test from the configuration dropdown, and click Start Debugging.
- Click the Debug CodeLens that appears above each test function to launch the debugger scoped to that single test.
Use test debugging when a test fails and you want to inspect the inputs and intermediate values that produced the failure, rather than the full integration.
Remote debugging
Remote debugging attaches the editor to an integration that is already running on another machine, in a container, or as an executable JAR. Start the integration in debug mode with one of the following commands:
bal run --debug <port> <path>     # package or file
bal run --debug <port> <jar>      # executable JAR
bal test --debug <port> <path>    # tests
Then add a Ballerina Remote configuration to launch.json with the debuggeeHost and debuggeePort matching the running process, and click Start Debugging. The same breakpoints, stepping, and inspection features work against the remote process.
Next steps
- Features - stepping, variable inspection, advanced breakpoints, and test or remote debugging.
- Errors and stack traces - read error messages and trace failures back to source.
- Logging - when adding logs is a better fit than a live debug session.