Features
This page catalogs the features available during a debug session: what each breakpoint type does, how to step through code, and how to inspect program state. For how to set up and launch a debug session (including test and remote debugging), see Editor Debugging.
Breakpoint types
Line breakpoints
The default breakpoint. Execution pauses every time it reaches the marked line or node. See Set a breakpoint for how to add one.
Conditional breakpoints
A conditional breakpoint pauses only when a Ballerina expression evaluates to true. Use them to narrow down a problem inside a loop or a high-traffic handler.
- Right-click an existing breakpoint.
- Select Edit Breakpoint.
- Enter a condition, for example
order.total > 1000orcustomer.tier == "premium".

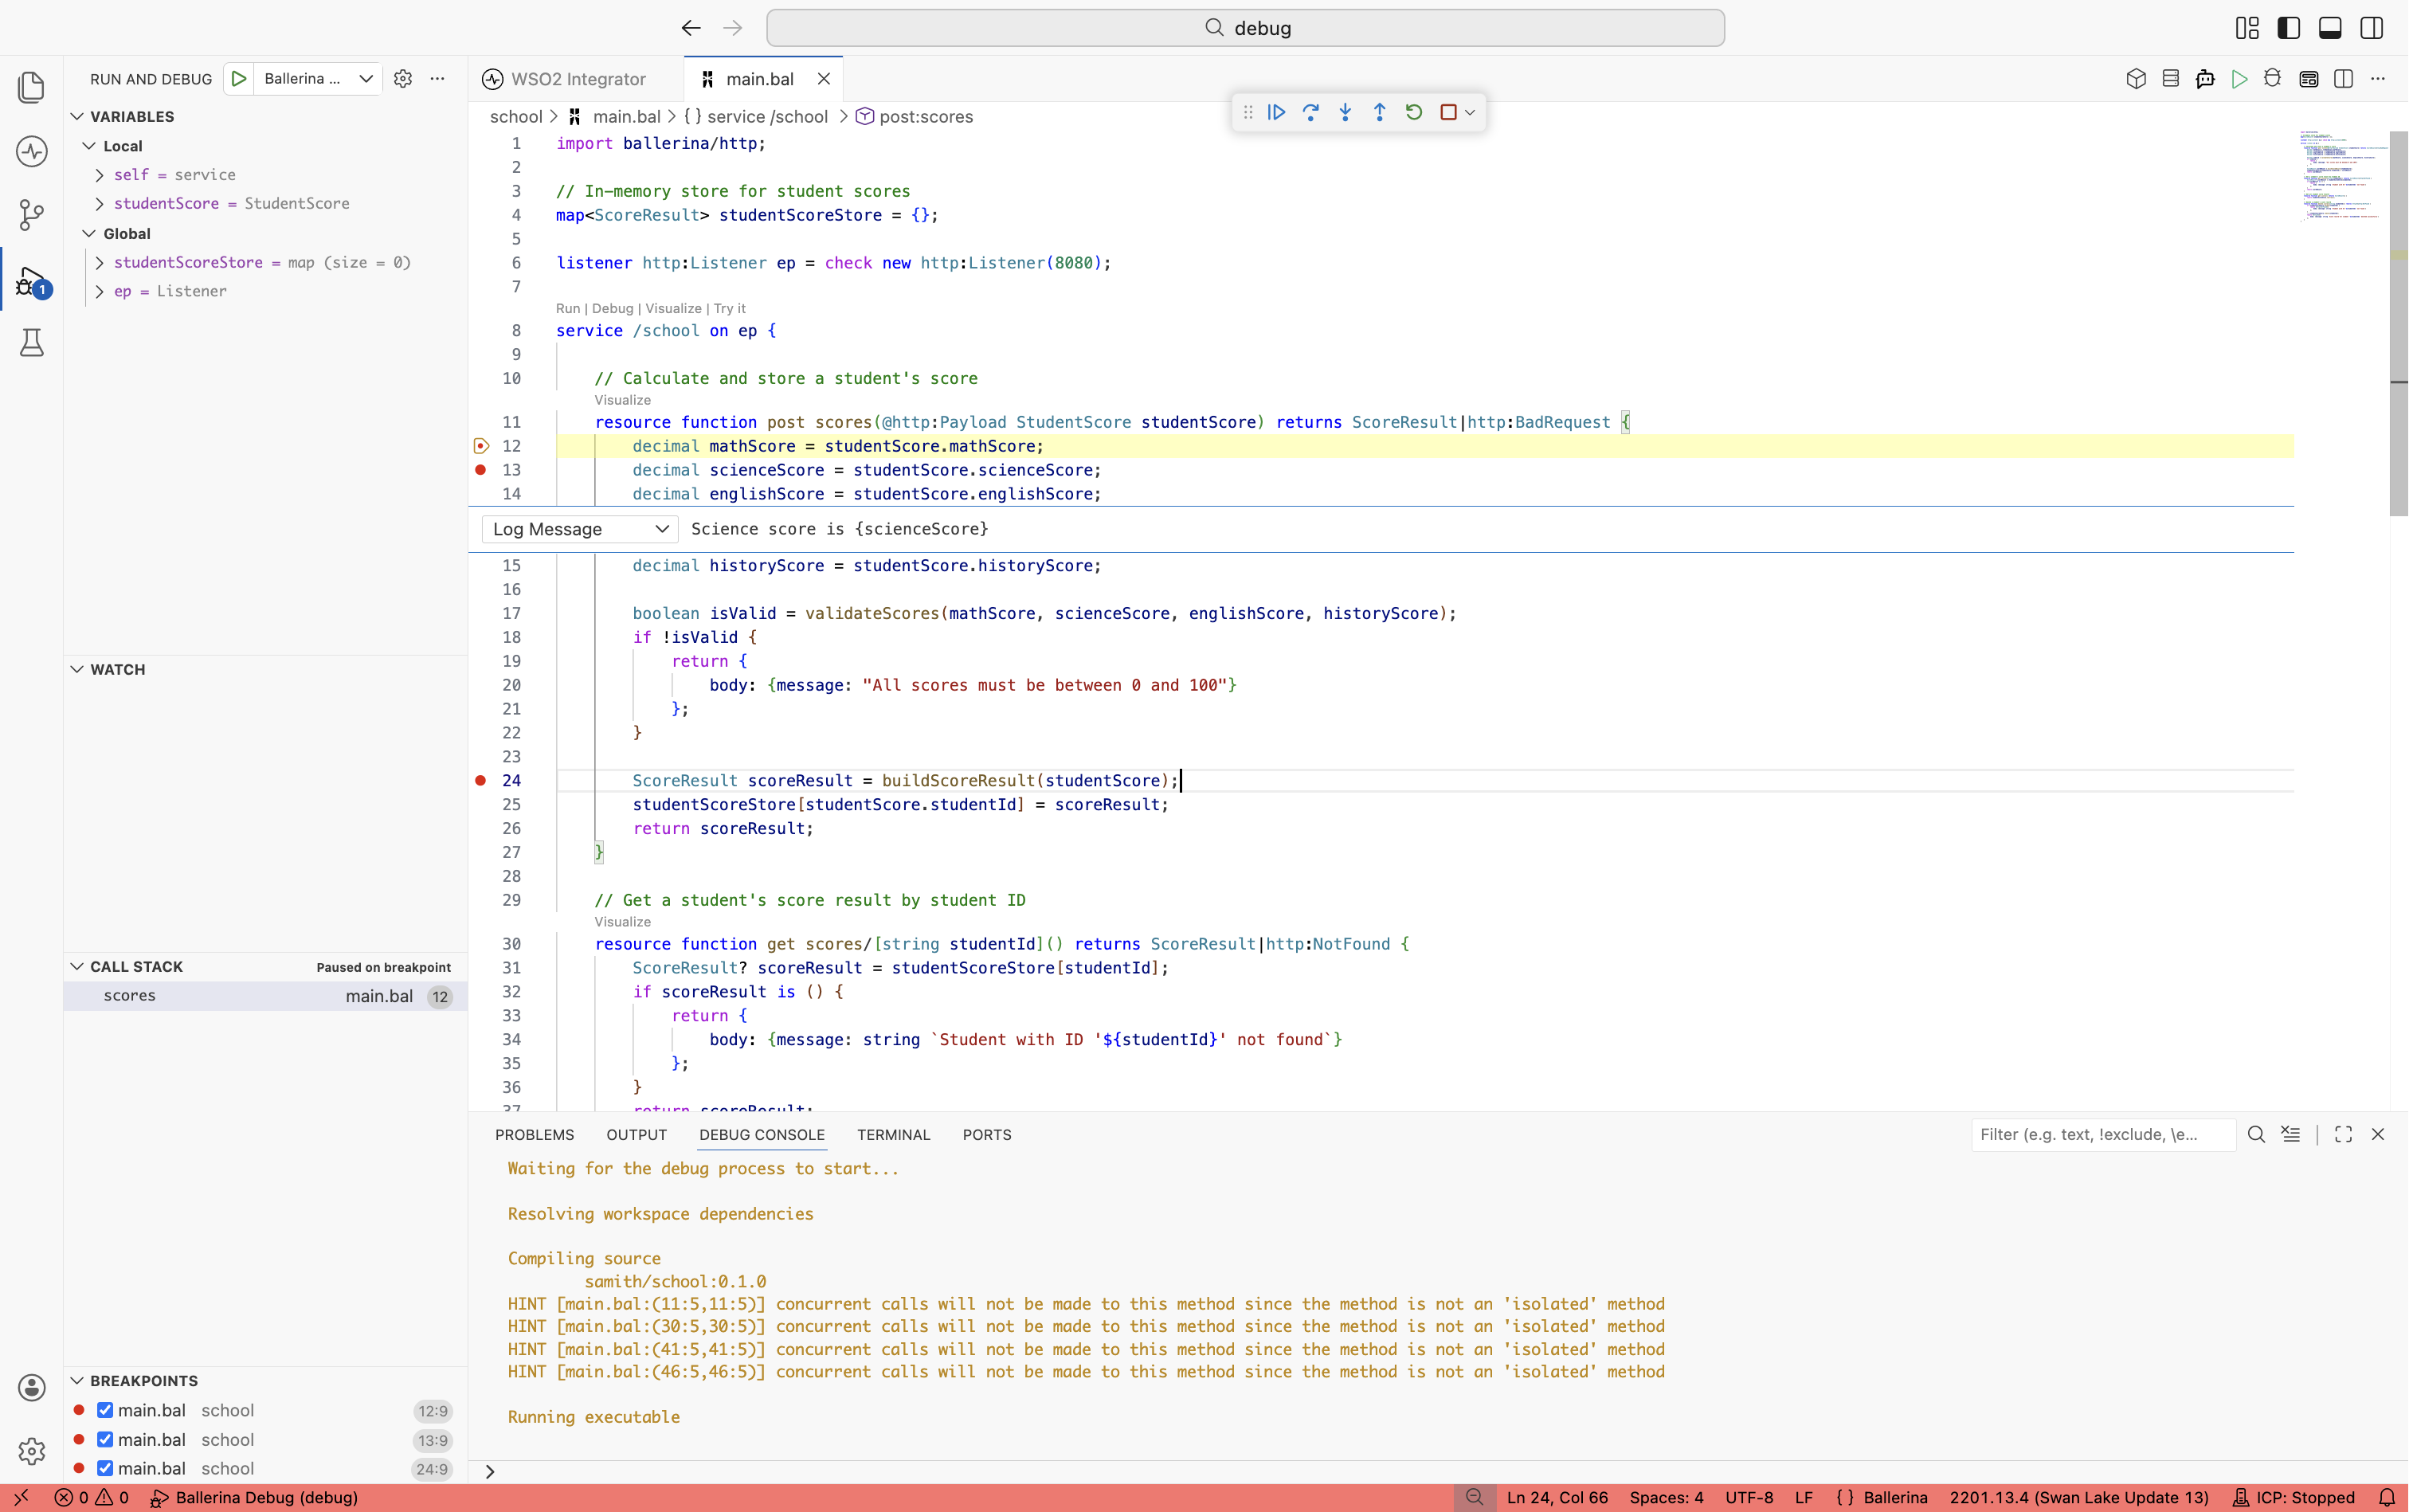
Logpoints
A logpoint prints a message to the Debug Console without pausing execution. Use logpoints when you want trace output but do not want to interrupt the run.
- Right-click in the gutter.
- Select Add Logpoint.
- Enter a message. Wrap expressions in braces, for example
Processing order {order.id} with {items.length()} items.
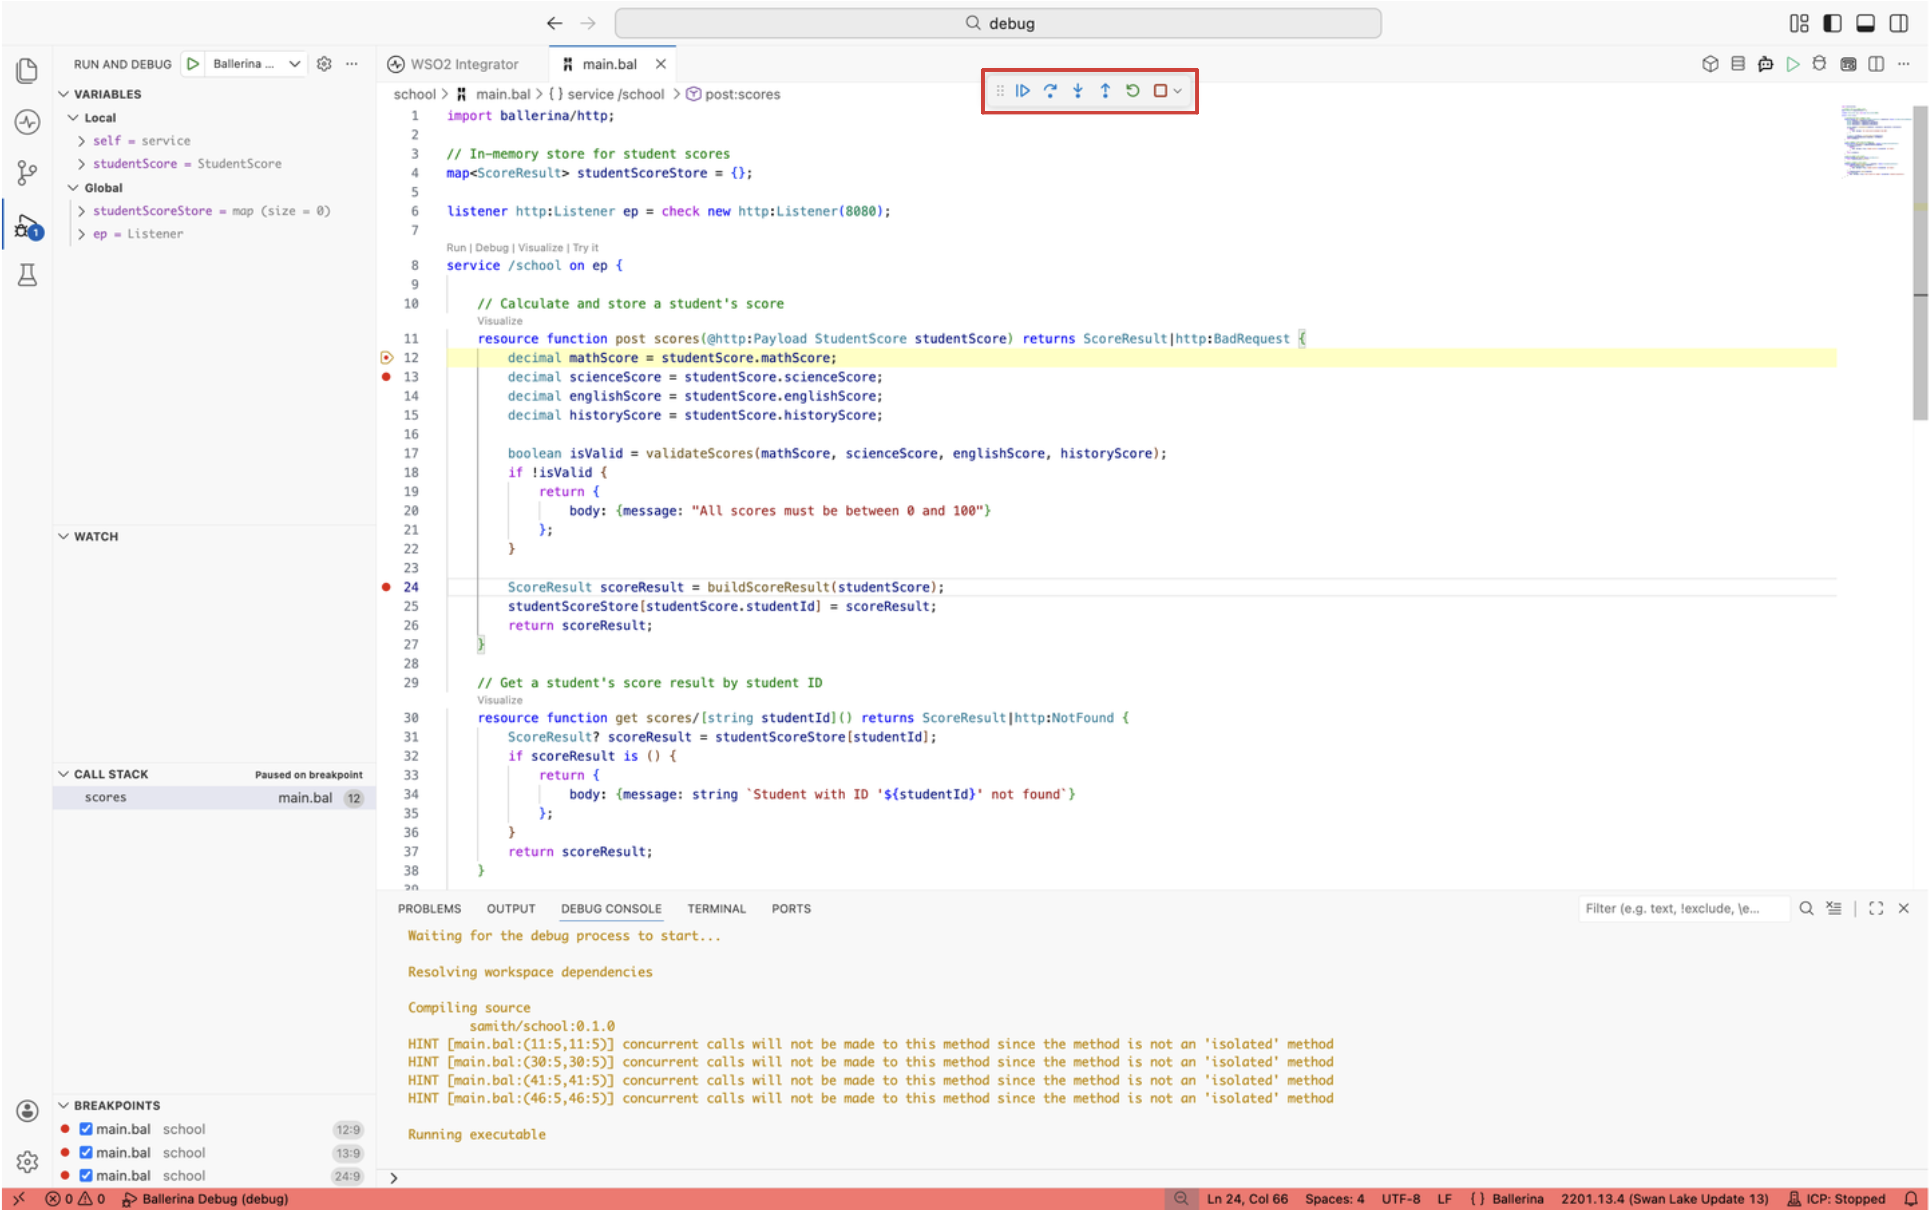
Stepping through code
Once execution is paused, the debug toolbar appears at the top of the editor. Use it to move through the integration one step at a time.
| Action | Shortcut | What it does |
|---|---|---|
| Continue | F5 | Resume execution until the next breakpoint. |
| Pause | Shift+F5 | Suspend a running program at its current line. |
| Step Over | F10 | Run the current line and pause on the next one, without entering function calls. |
| Step Into | F11 | Enter the function called on the current line. |
| Step Out | Shift+F11 | Run the rest of the current function and pause when it returns. |
| Restart | Cmd+Shift+F5 or Ctrl+Shift+F5 | Stop the current session and start a new one. |
| Stop | Shift+F5 | End the debug session. |
Pause and continue
The Pause action suspends a program that is running but is not sitting on a breakpoint. It is the fastest way to investigate an integration that appears to hang or to be caught in an infinite loop: click Pause, look at where execution stopped in the Call Stack panel, then step or continue from there.
Inspect program state
While paused, use the side panels and the debug console to see what data the integration is holding.
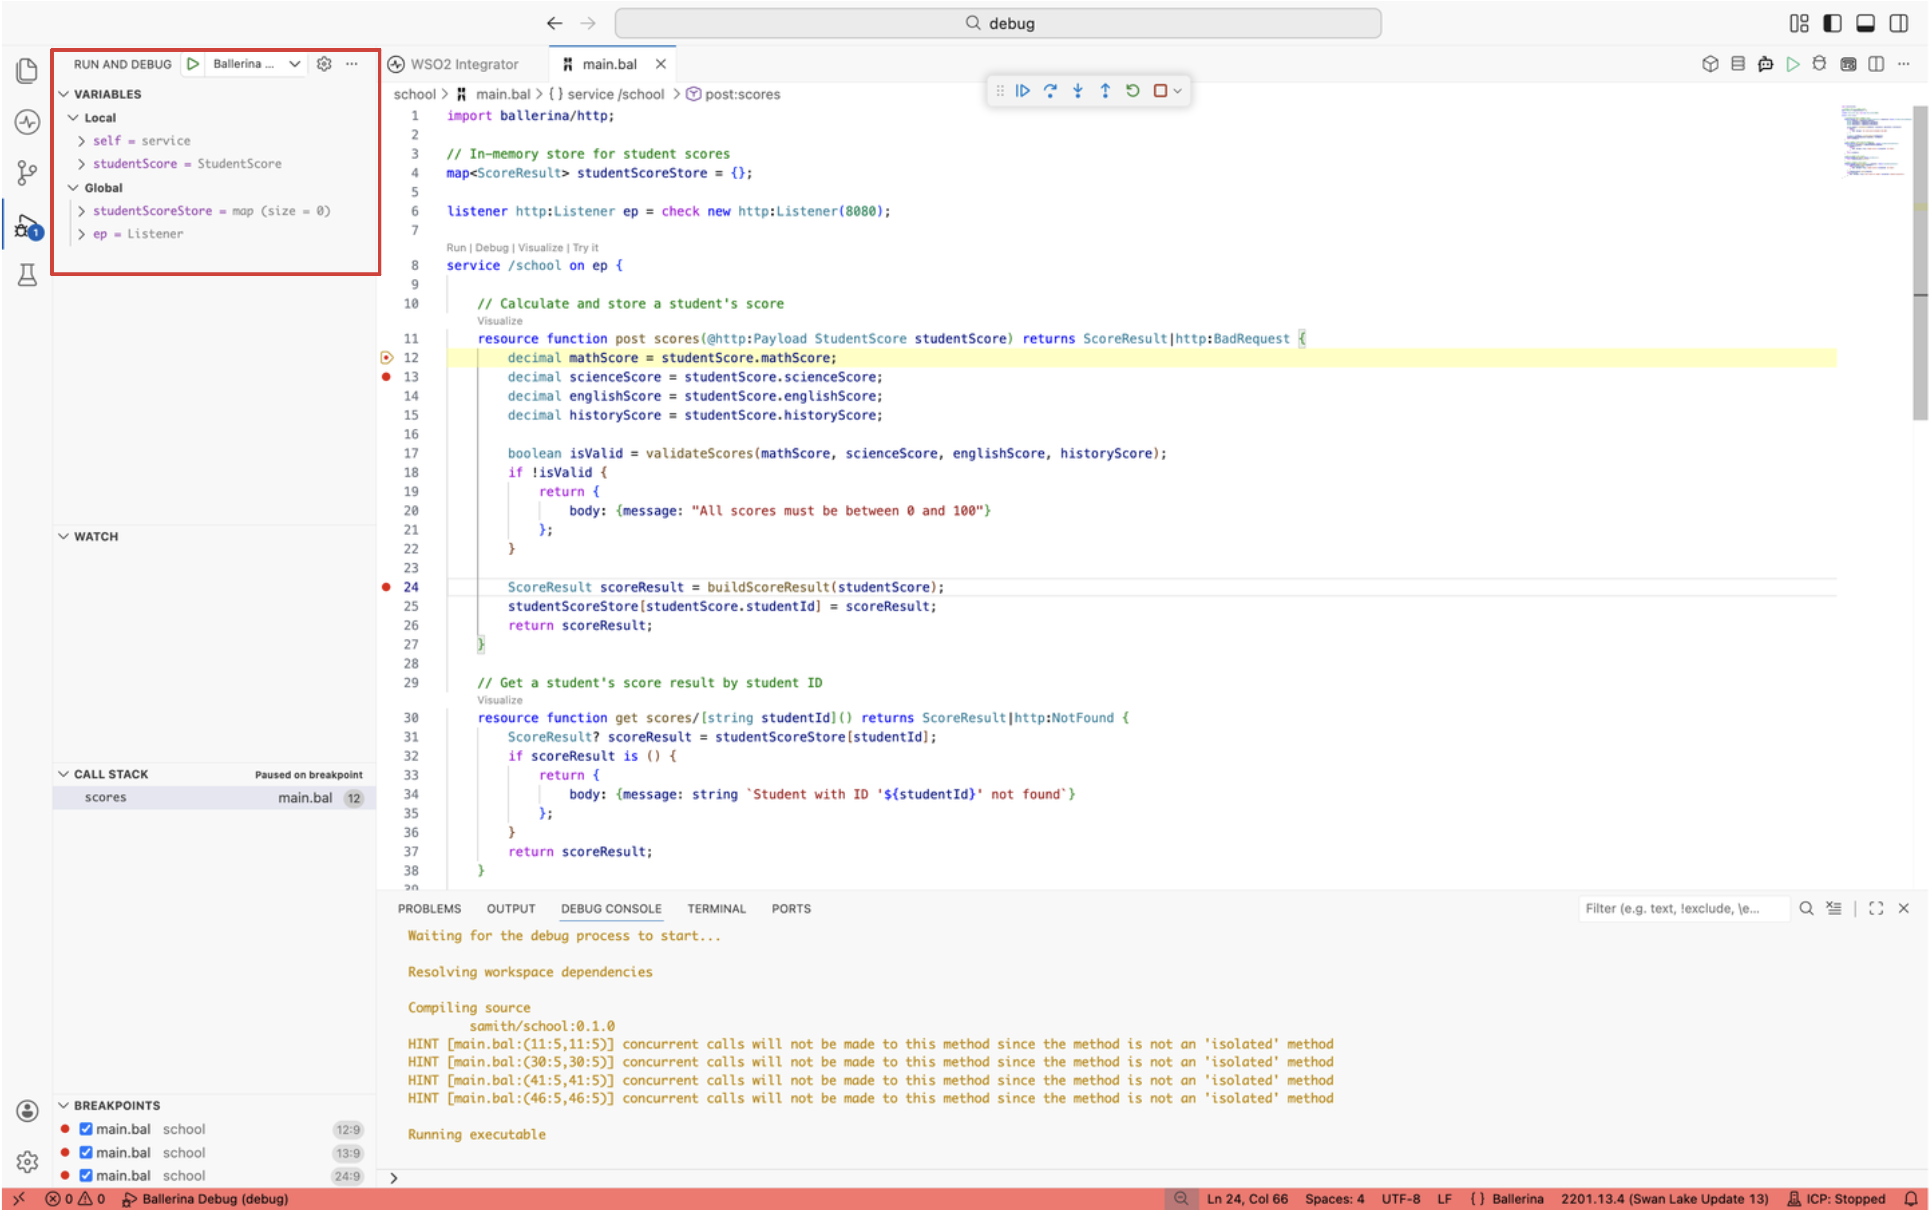
Variables panel
The Variables panel groups data into Local (current function scope) and Global (module-level) sections. Expand records, arrays, and maps to drill into nested fields.
Hover inspection
Hover over any variable in the editor while paused. The current value appears in a tooltip.
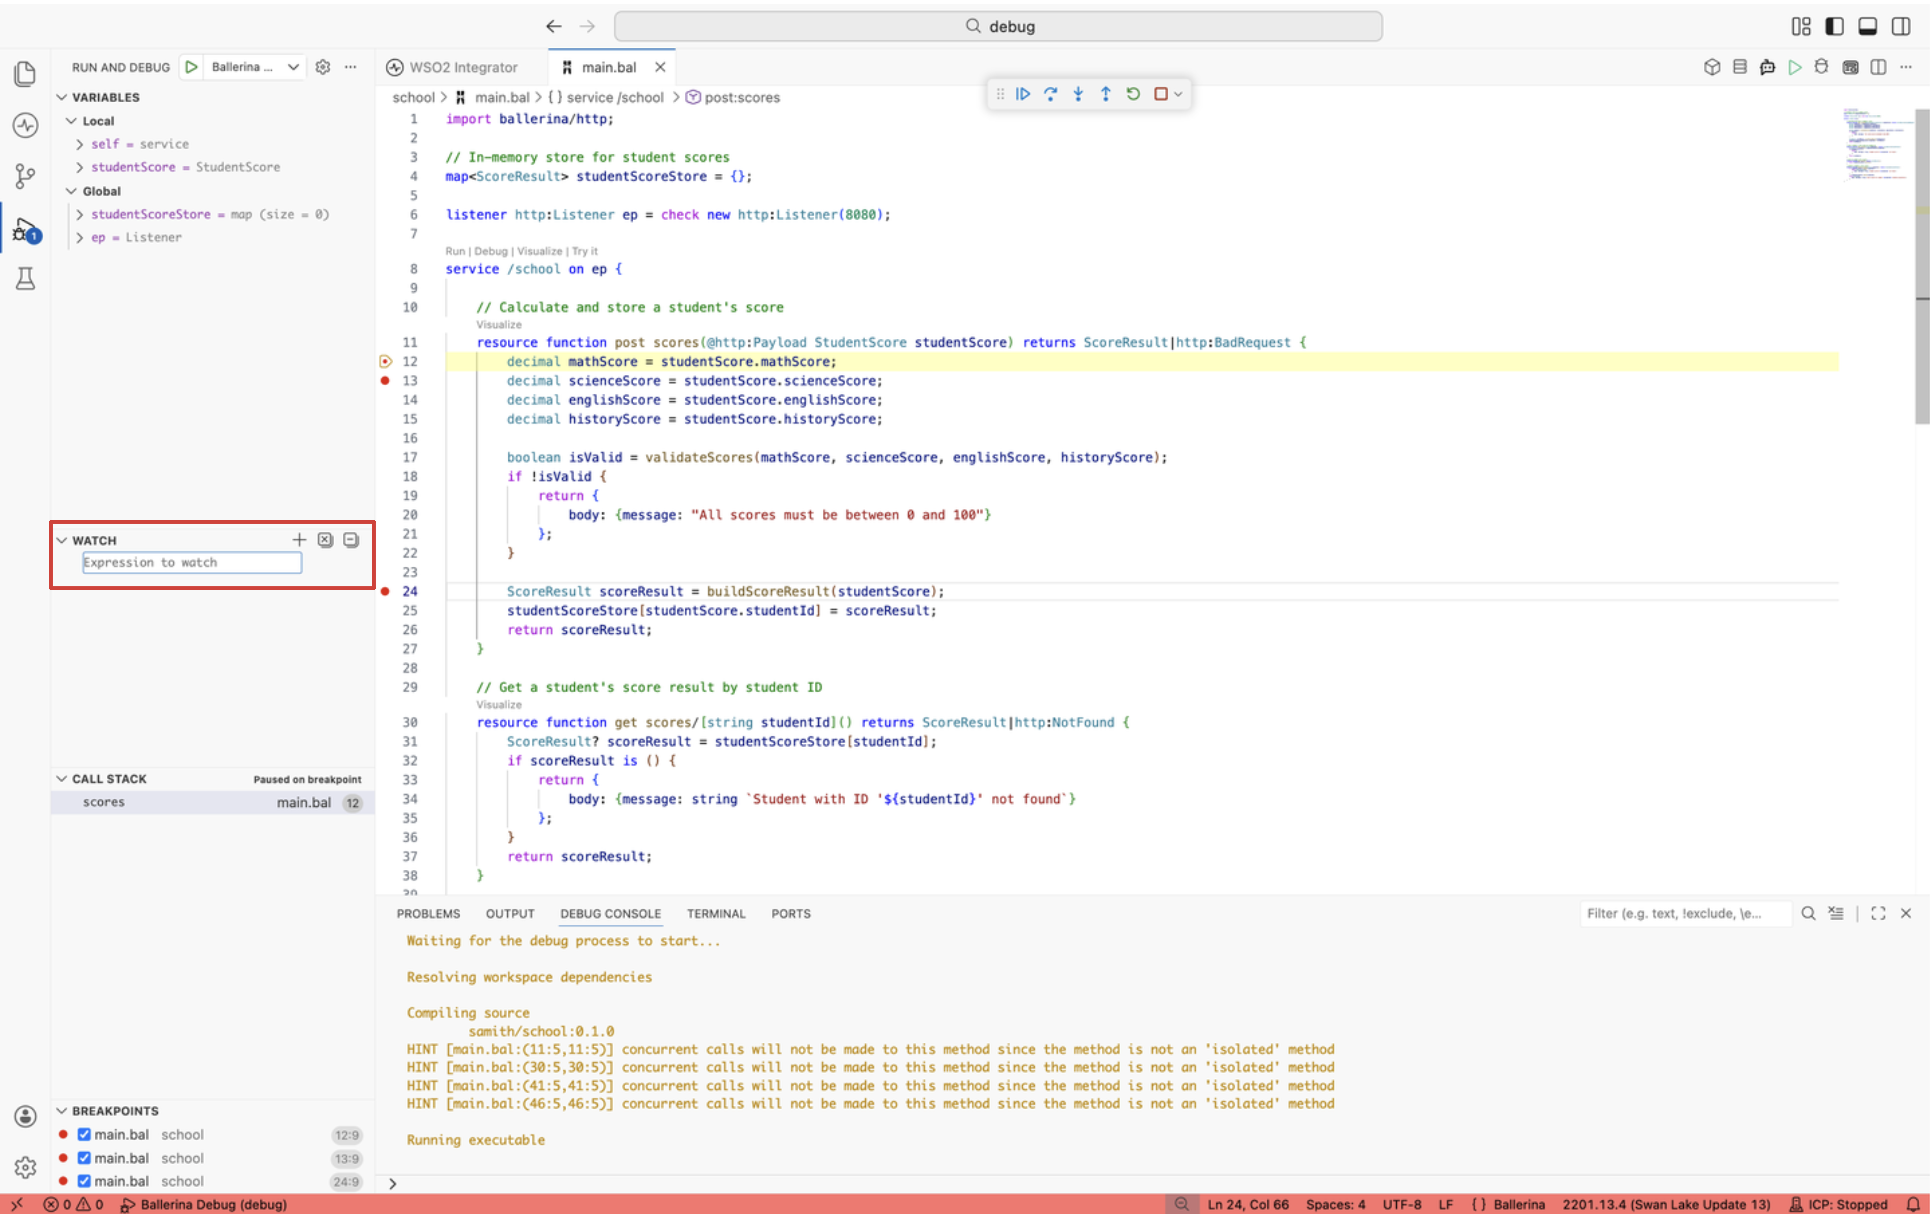
Watch panel
Use the Watch panel to track specific expressions across breakpoints. Add an expression once and it re-evaluates every time execution pauses. For example:
payload.toString(). View the full payload as a string.order.items.length(). Count items in the order.response.statusCode. Check the current HTTP status.
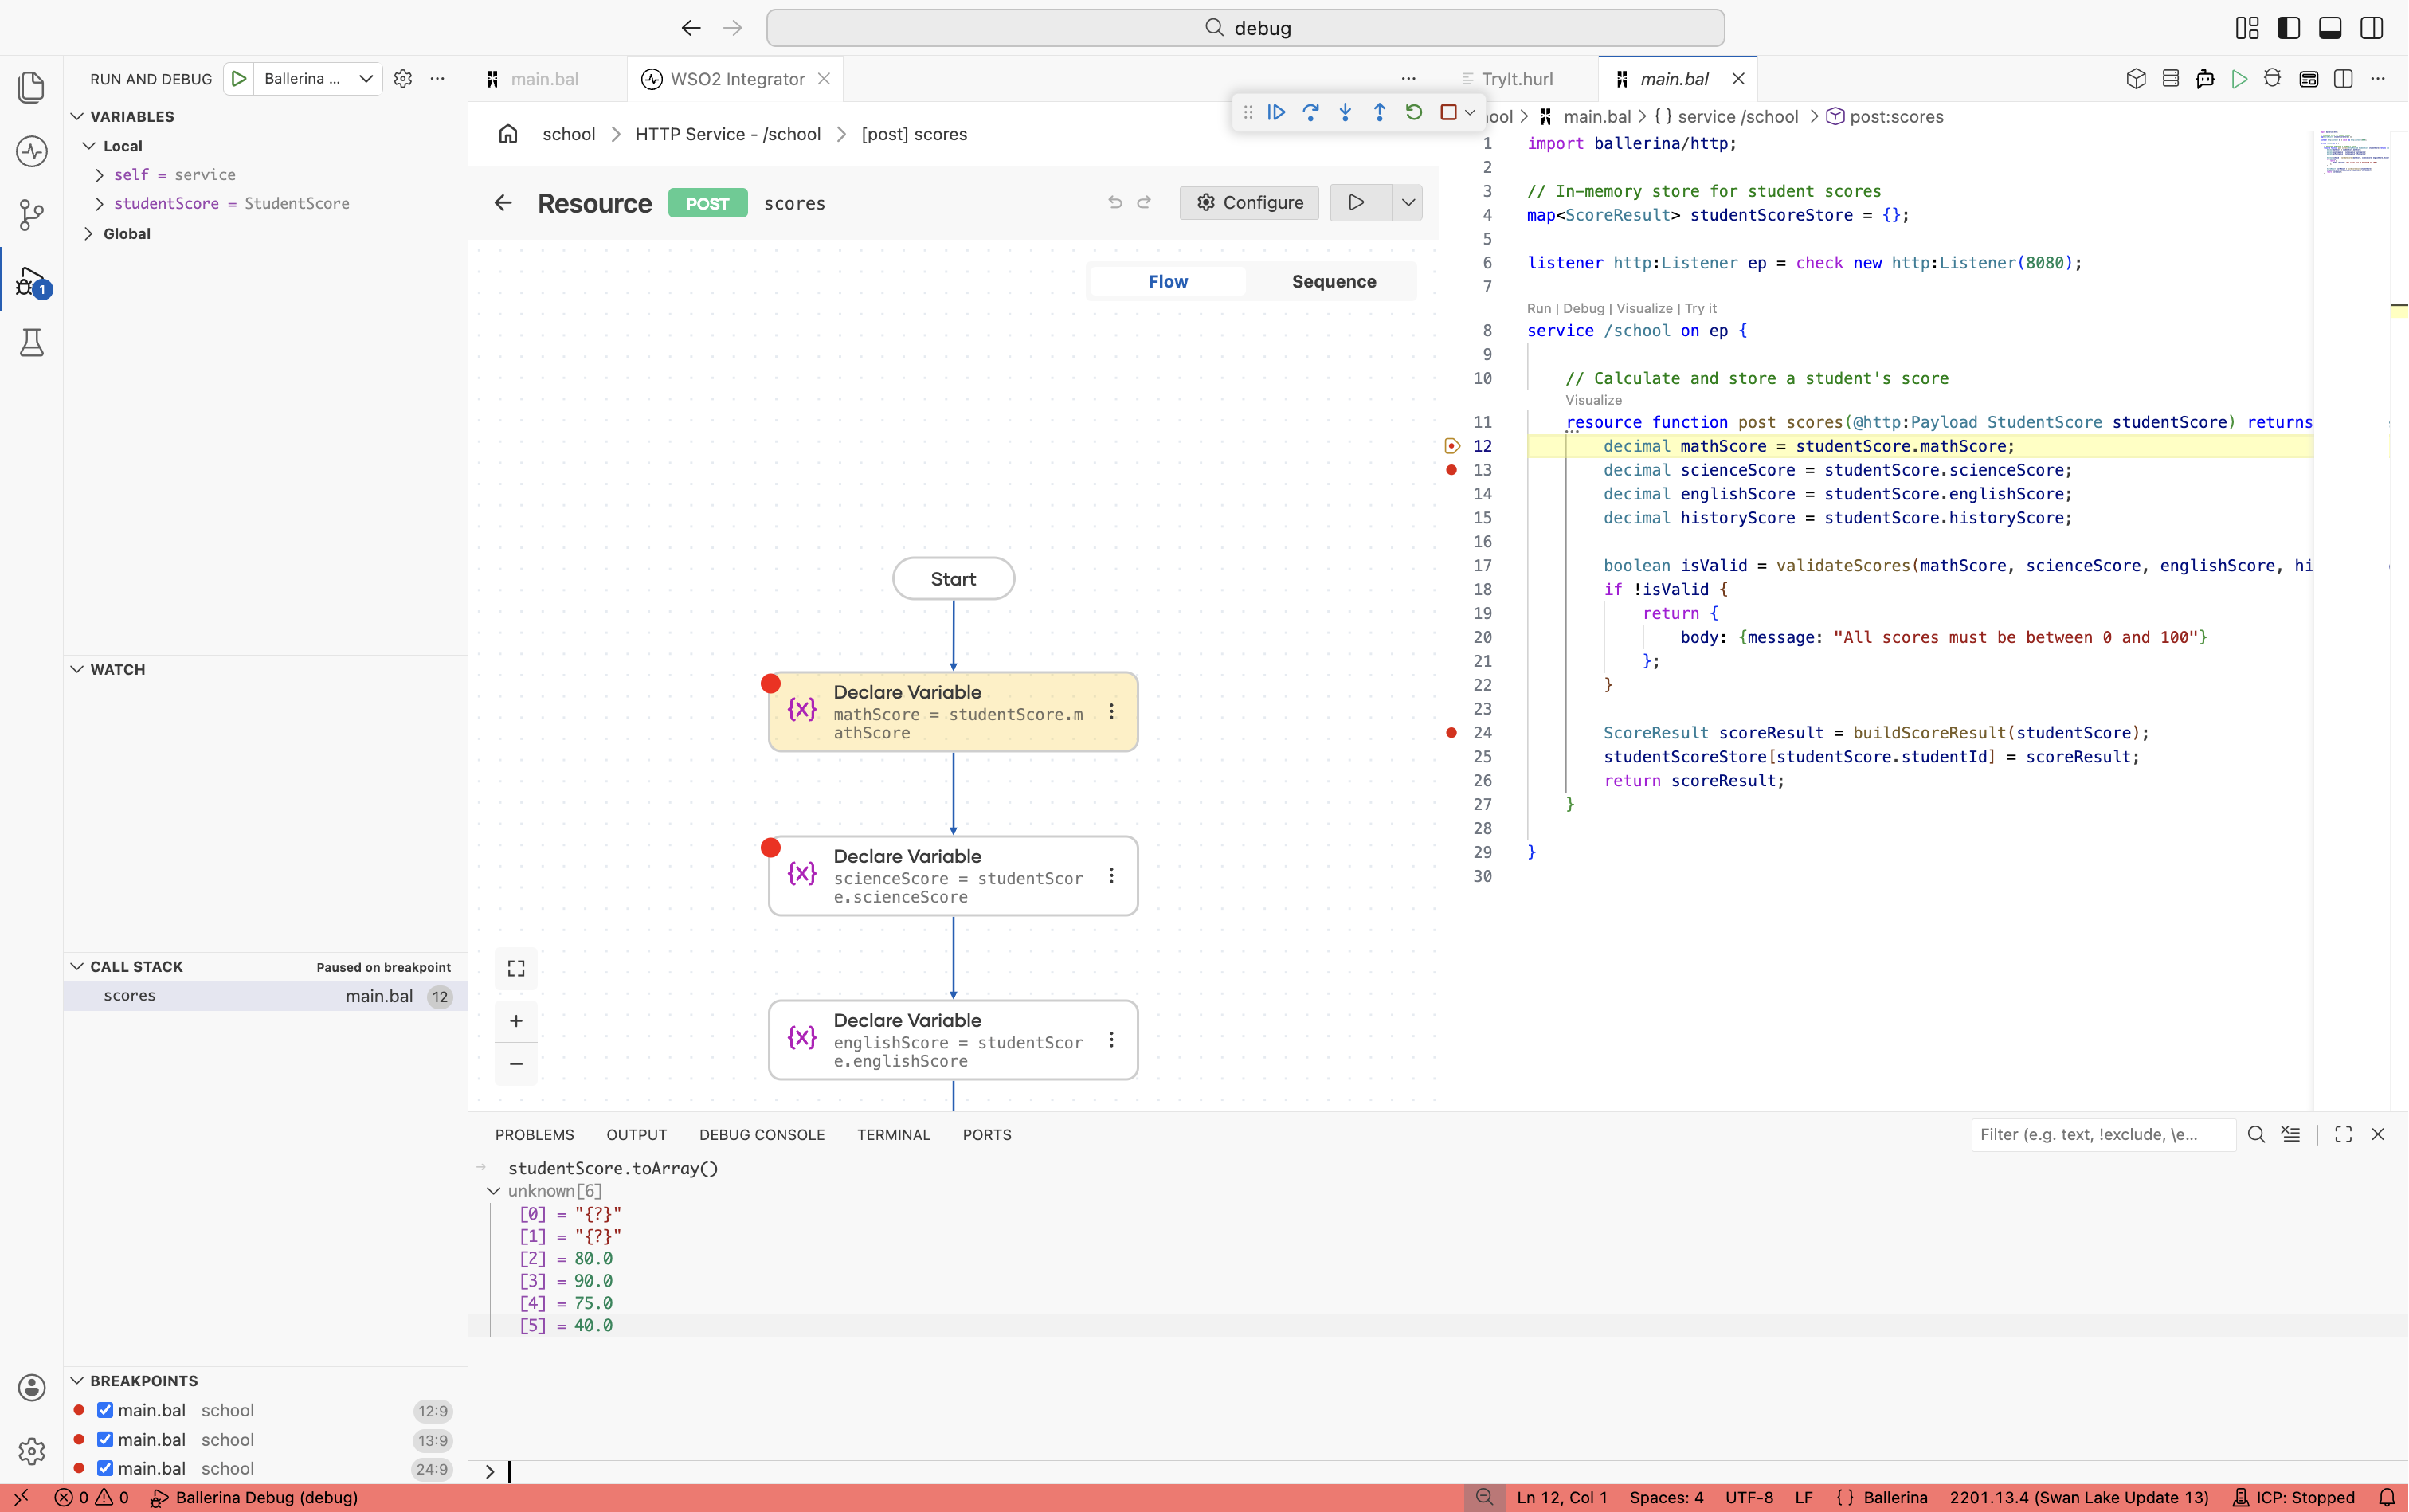
Debug console
The Debug Console evaluates any Ballerina expression in the current scope while the session is paused. Use it for one-off checks that do not warrant a watch expression. The console is also where program output and logpoint messages appear.
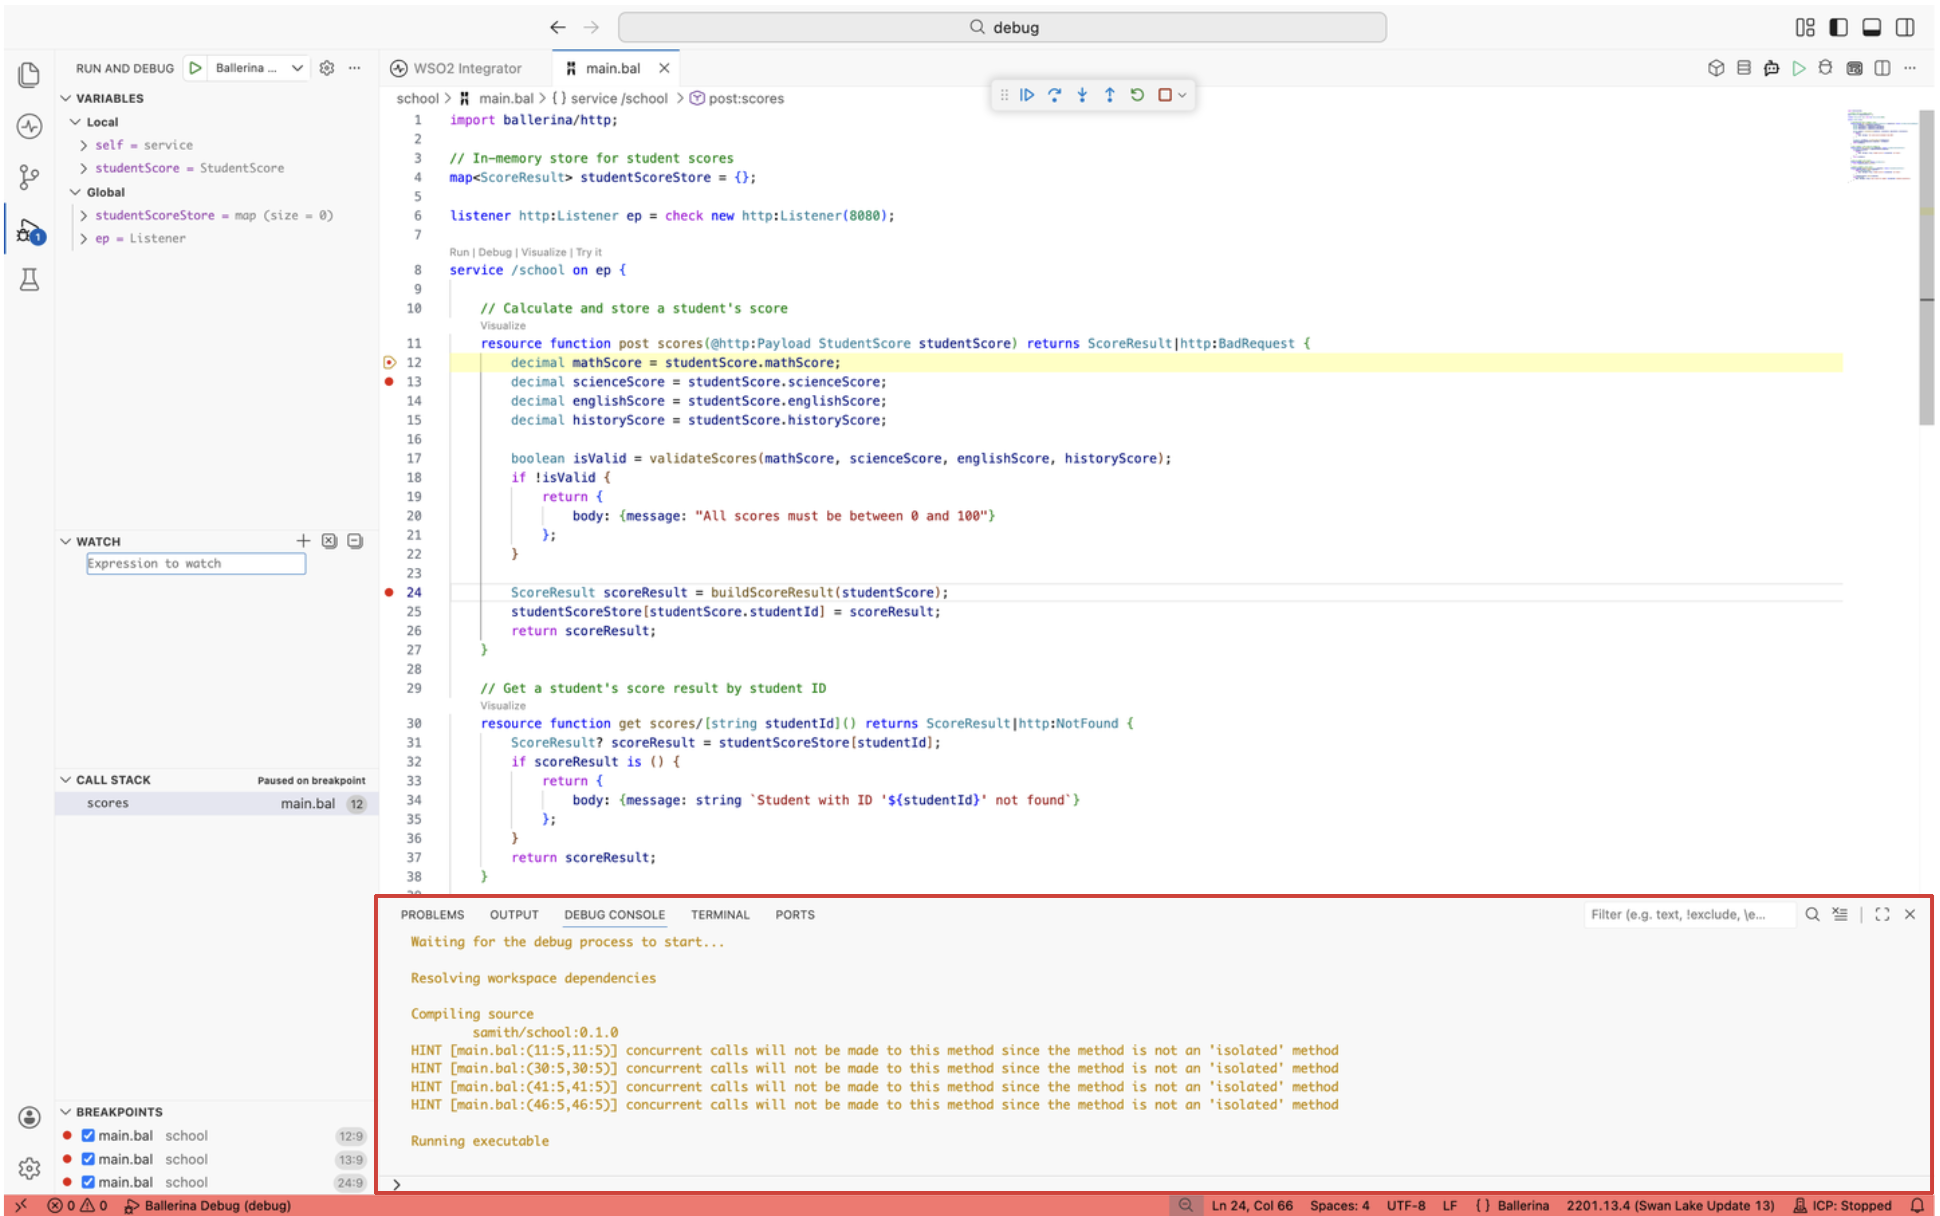
Call stack and strands
The Call Stack panel shows the chain of function calls that led to the current pause point. Each frame is clickable. Selecting a frame retargets the Variables and Debug Console to that frame's scope, so you can inspect state at any level of the call chain. For concurrent integrations, the panel also exposes the active strands, letting you switch between them while paused.
Expression evaluation
Expression evaluation lets you run any Ballerina expression against the current paused state. Use it to verify a fix idea, transform a value, or call a function without editing source and restarting the session.
You can evaluate expressions in three places:
- Debug Console. Type an expression at the prompt and press Enter. The result prints inline.
- Watch panel. Add an expression once and it re-evaluates on every pause.
- Hover. Select an expression in the editor and hover to see its value in a tooltip.
Expressions run in the scope of the selected stack frame, so switching frames in the Call Stack panel changes what is in scope.
Related
- Editor Debugging - quick-start setup for a debug session.
- Errors and stack traces - read error messages and trace failures back to source.
- Logging - when adding logs is a better fit than a live debug session.
- Strand dump analysis - diagnose stuck or hung integrations from a captured dump.