Metrics
The Metrics pane displays graphs for the following metrics:
- Requests per minute
- Latency
- Memory usage
- CPU usage
- Data transfer
- Disk usage
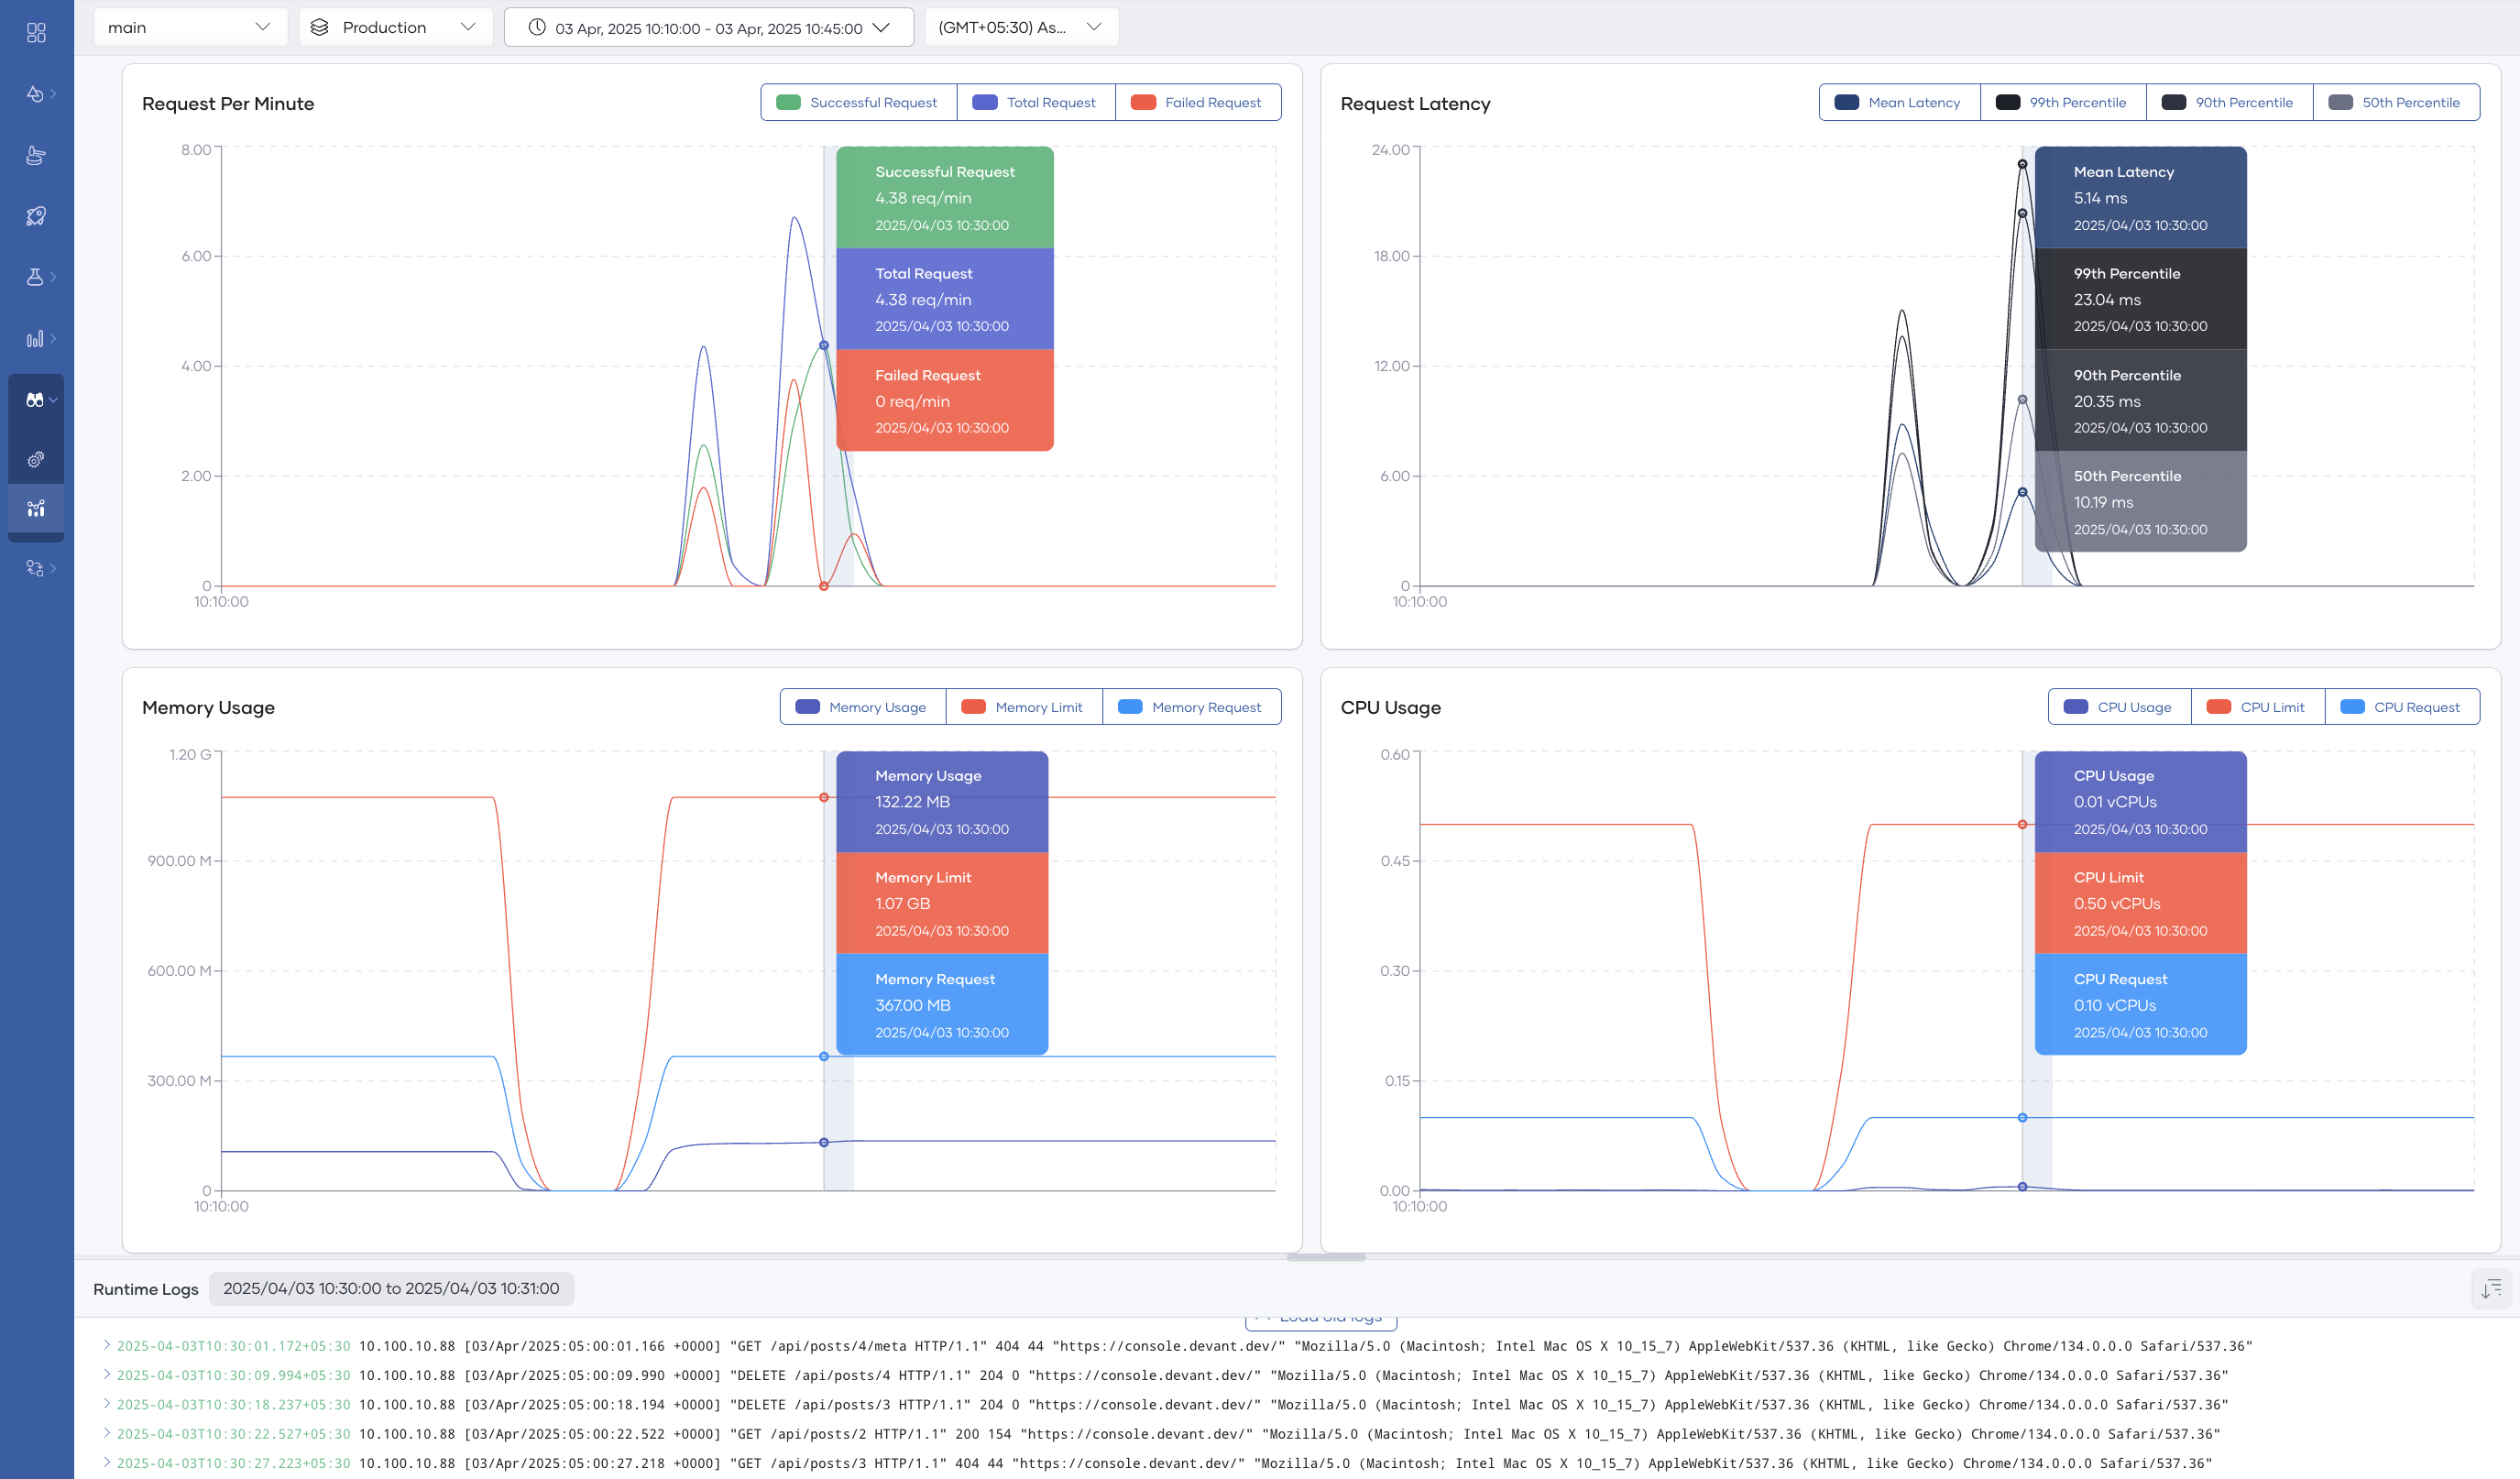
By default, the dashboard shows data from the past 24 hours. You can adjust the time window using the time range and zone selectors in the options bar. To drill down into a specific period, click and drag over the relevant section of the graph.
Clicking a point on a graph filters the Logs pane to show log entries from that time, making it easier to correlate anomalies with specific events in your integration.
What's next
- Anomaly detection and alerts — Configure alerts to get notified when metrics exceed defined thresholds.