Observability Overview
WSO2 Cloud - Integration Platform provides a built-in observability dashboard to help you monitor and diagnose integrations in production. You can track request throughput, latencies, resource consumption, and runtime logs from a single interface, all scoped to the environment you're investigating.
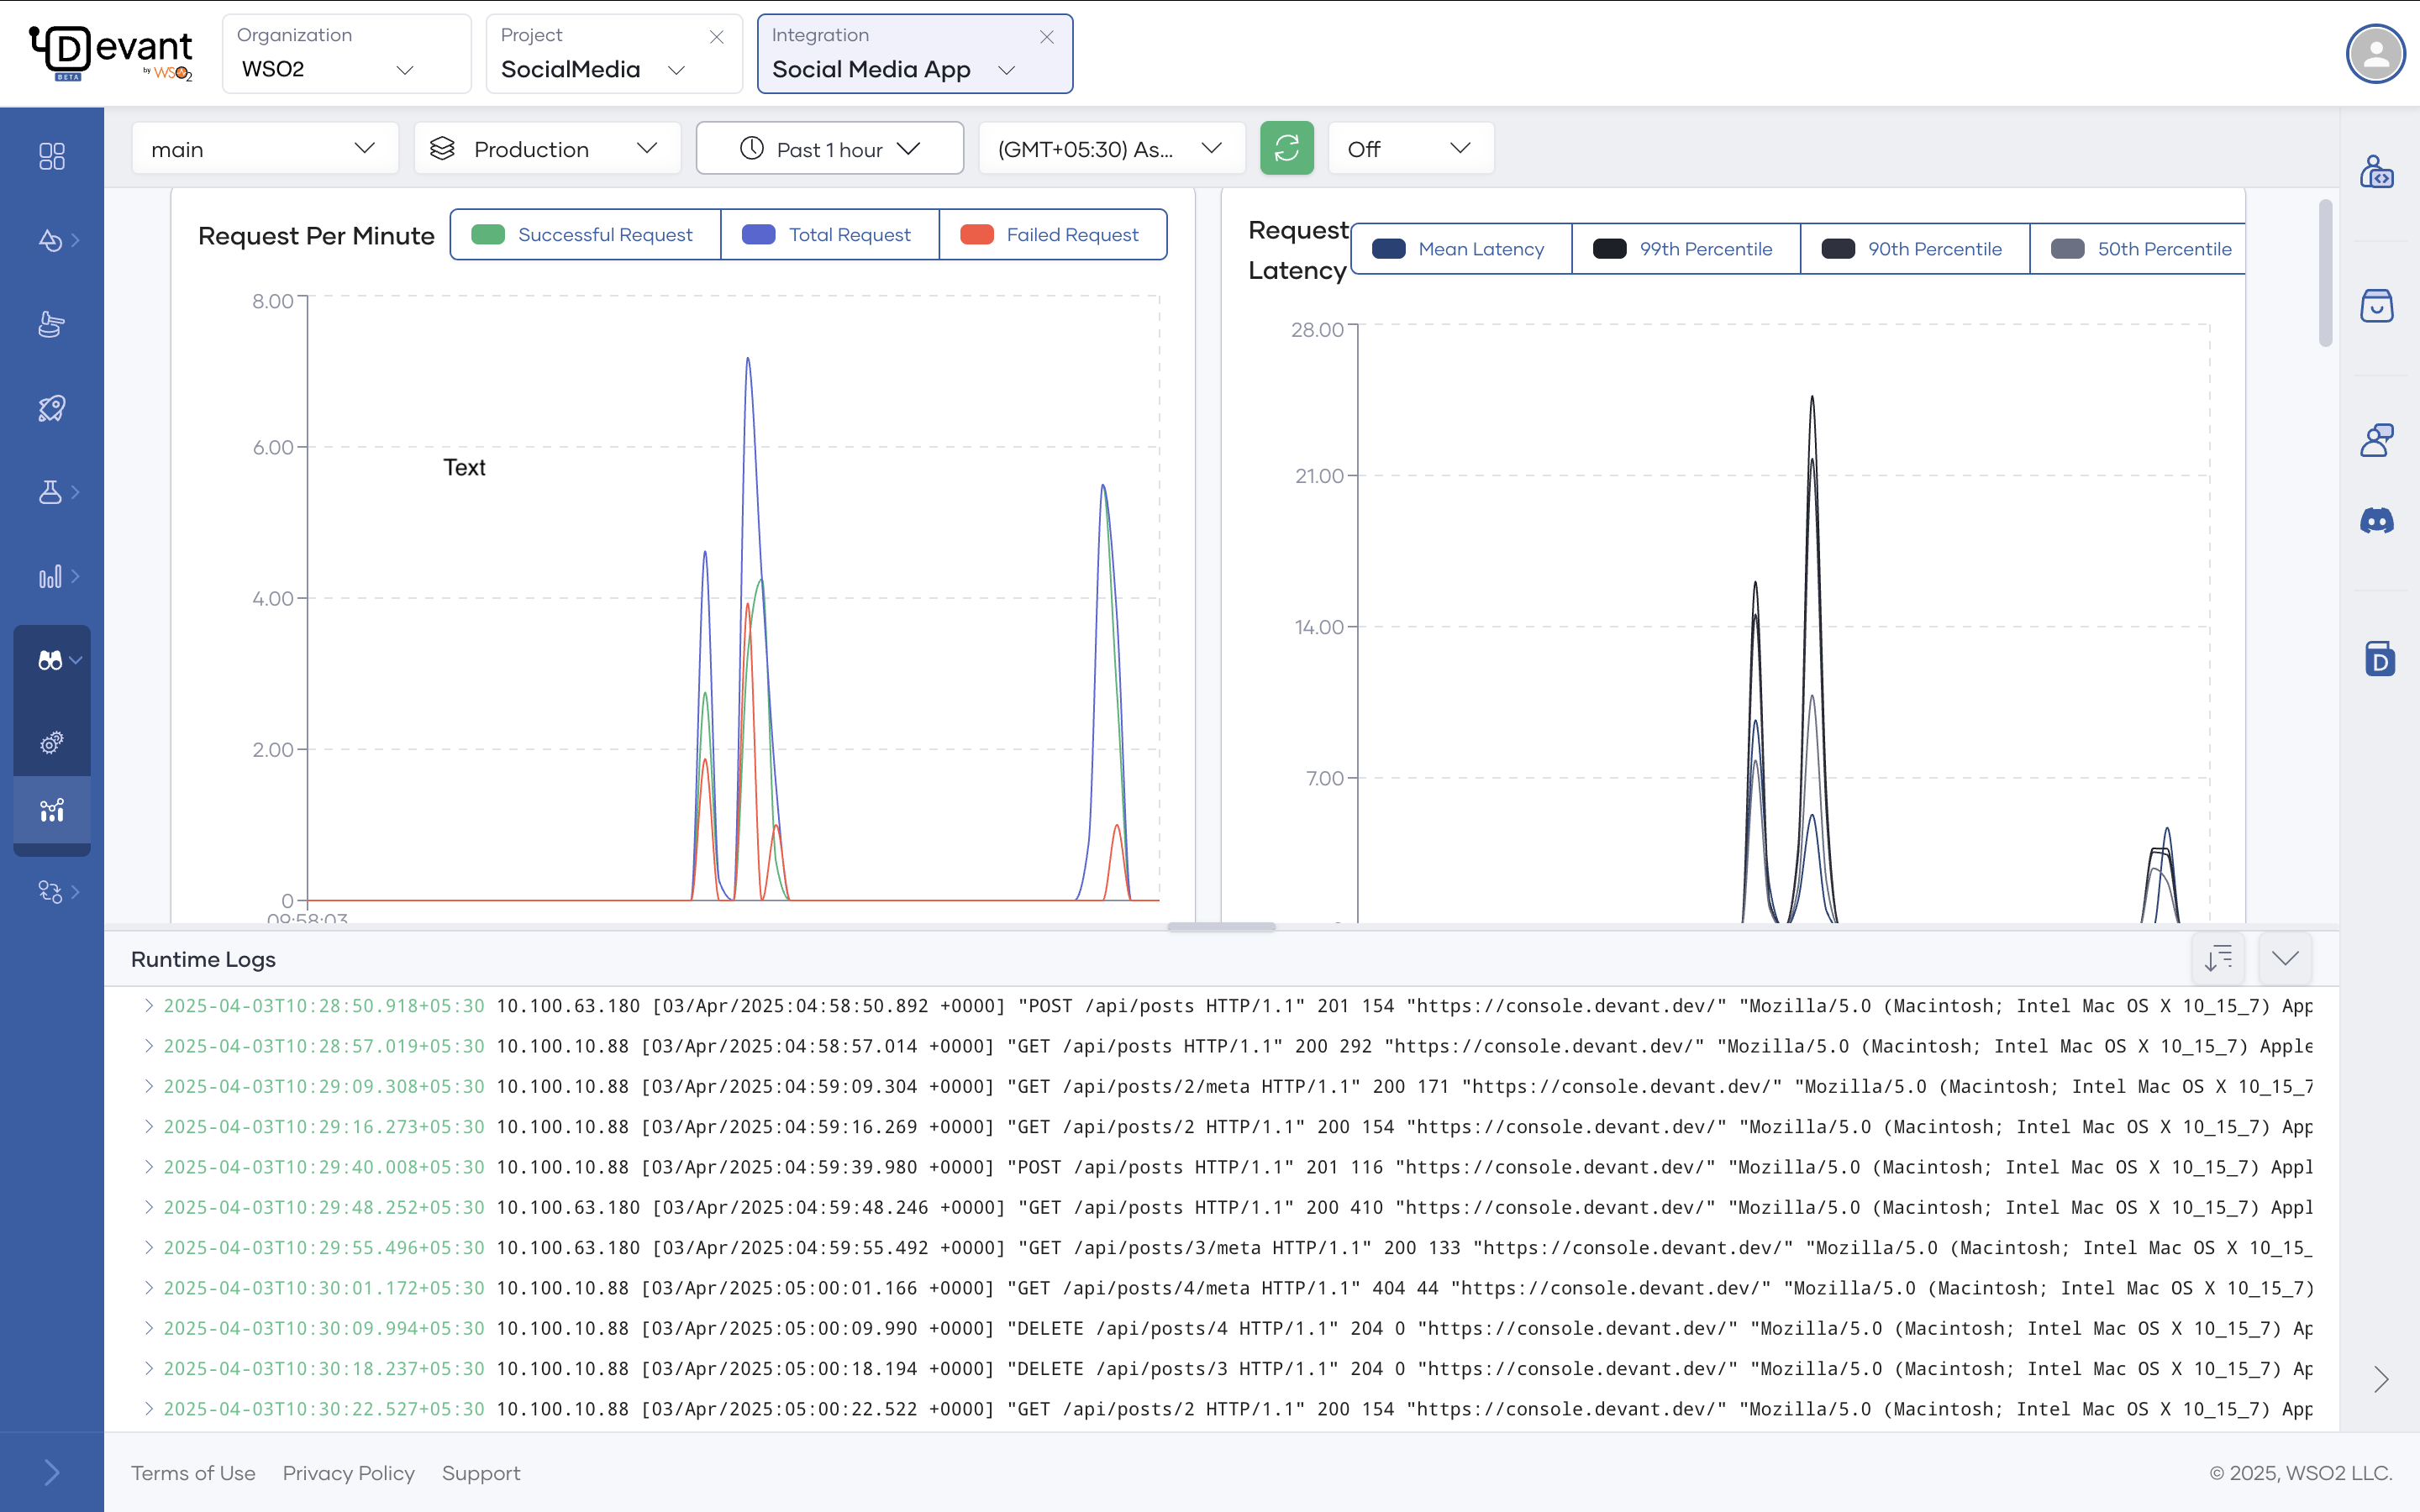
The observability features lets you:
- View runtime logs generated over a specific timeframe.
- Observe the throughput and latencies of requests served over a given period.
- Monitor CPU and memory usage over time.
- Compare metrics side-by-side to diagnose issues efficiently.
- Configure anomaly detection and alerts to get notified when metrics exceed defined thresholds.
What's next
- Runtime logs — Search, filter, and analyze runtime log output.
- Metrics — Monitor request throughput, latency, and resource usage over time.
- Anomaly detection and alerts — Configure alerts to get notified when metrics exceed defined thresholds.