Integrator App
The WSO2 Integrator IDE is the application you install to build integrations. Every view you open (Project view, Integrator view, Library view, and so on) renders inside the same window chrome: a top menu bar, an activity bar on the far-left edge, an editor tab area, and the side panels for the project explorer and deployment options. This page describes the parts of that chrome that stay the same across views, so the view-specific pages do not need to repeat them.
Top menu bar
The top menu bar runs across the top edge of the application window and groups the standard application menus.
| Menu | Description |
|---|---|
| WSO2 Integrator | Application-level actions such as About, Preferences, and Quit. |
| File | Open, save, and close projects, files, and windows. |
| Edit | Standard editing actions such as undo, redo, cut, copy, paste, and find. |
| Selection | Selection and multi-cursor actions for the source editor. |
| View | Toggle the activity bar, side bar, panel, terminal, and other layout elements. |
| Go | Navigation actions such as Go to File, Go to Definition, and Go to Symbol. |
| Run | Run and debug actions for the active integration. |
| Terminal | Open and manage integrated terminals. |
| Window | Manage open windows. |
| Help | Documentation, release notes, and support links. |
The top menu bar covers general application actions. Integrator-specific actions live in the activity bar and the editor toolbar.
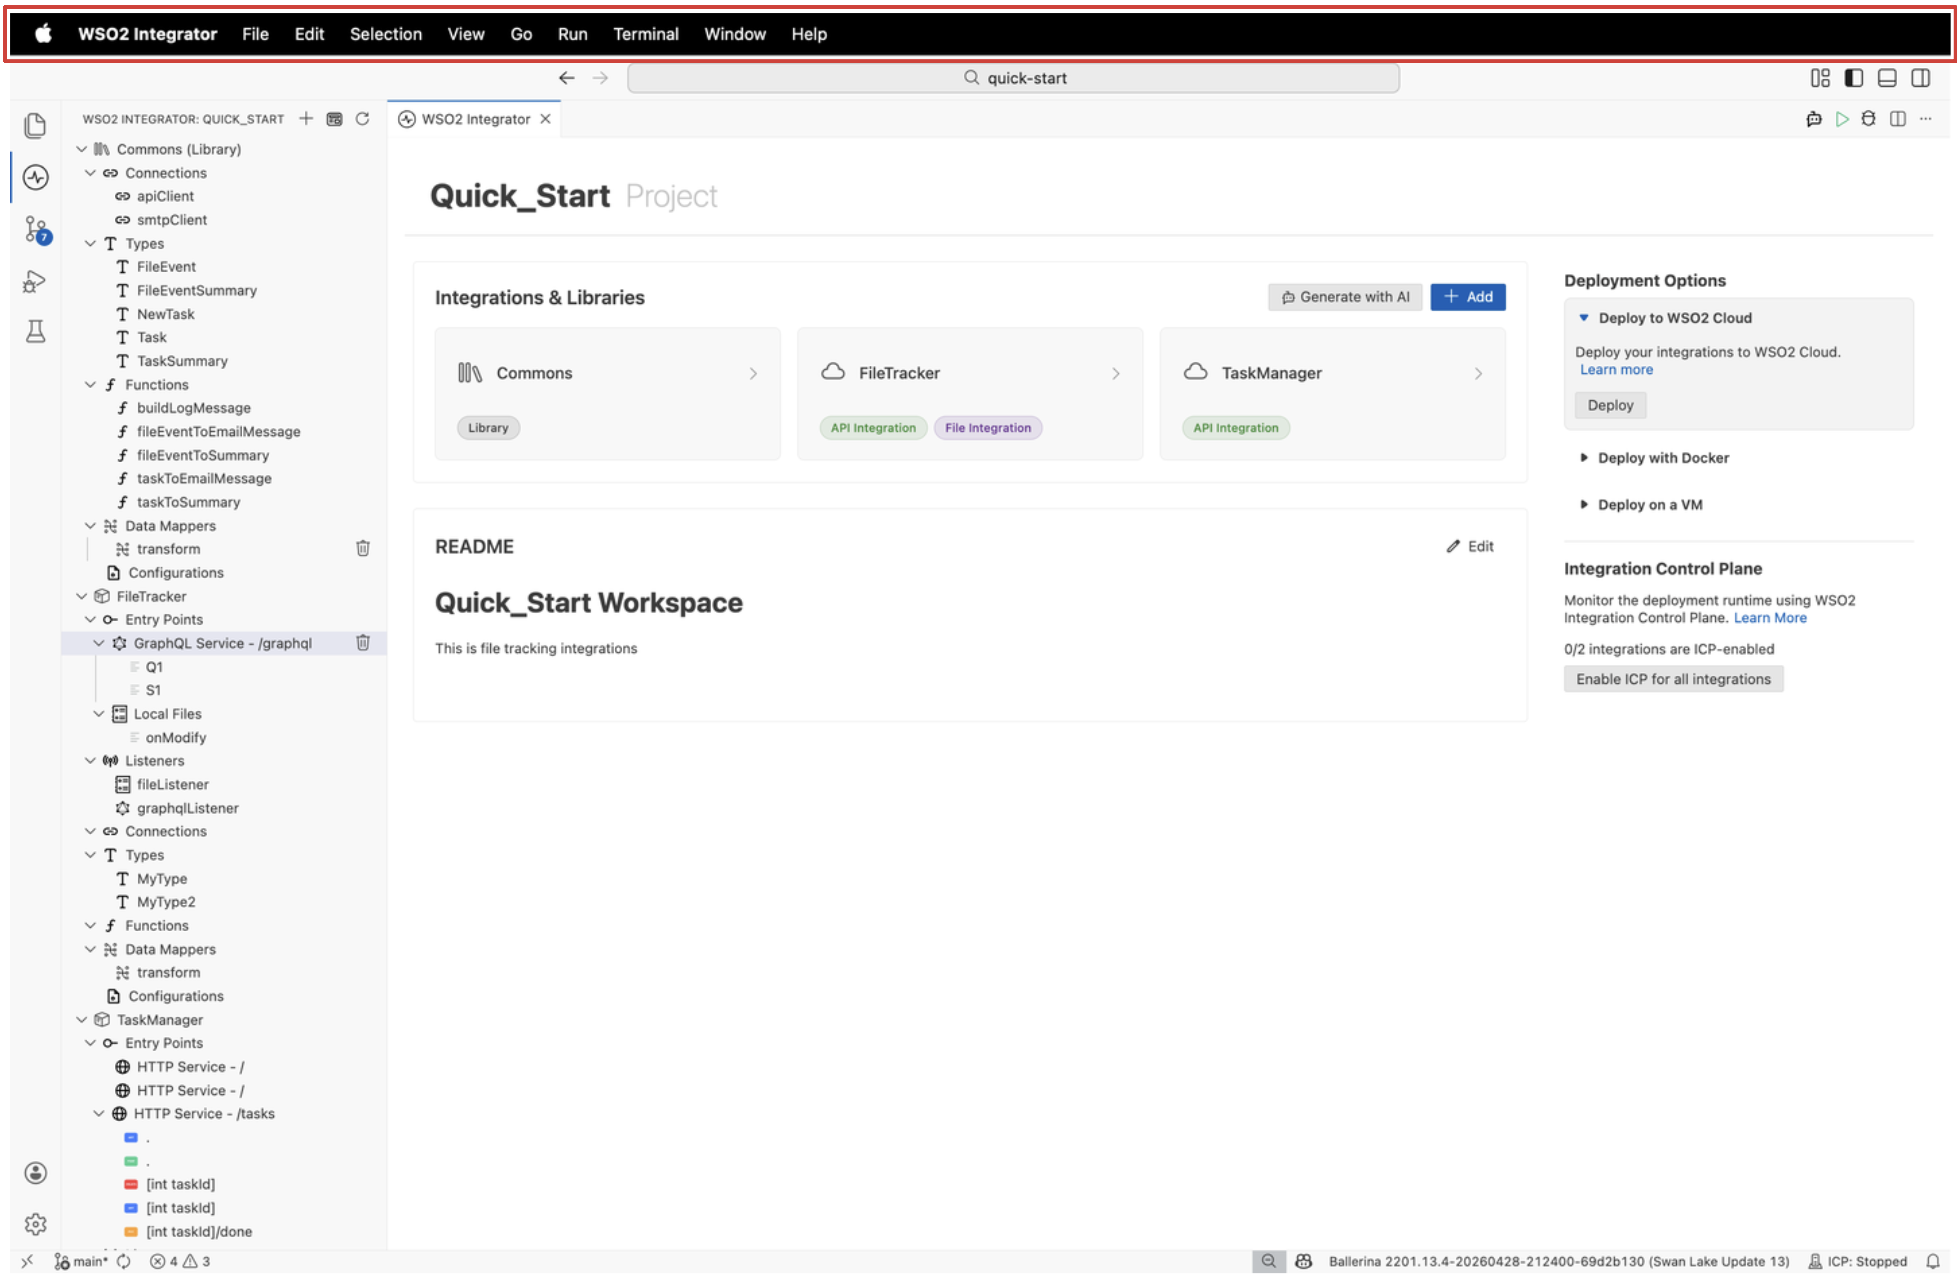
Activity bar
The activity bar is the narrow vertical strip on the far-left edge of the IDE. Each icon opens a different panel or tool, and the active icon is highlighted.
| Name | Description |
|---|---|
| Explorer | Opens the file explorer for browsing project files on disk. |
| WSO2 Integrator | Opens the project explorer for the current view. This is the entry point to the Integrator app. |
| Source Control | Opens the Git source control panel for staging, committing, and reviewing changes. |
| Run and Debug | Opens the debug panel for setting breakpoints, launching the integration with the debugger, and inspecting variables. |
| Test Explorer | Opens the test explorer to view, run, and debug the test cases defined for your integration. |
Select the WSO2 Integrator icon at any time to return to the project explorer and the current view.
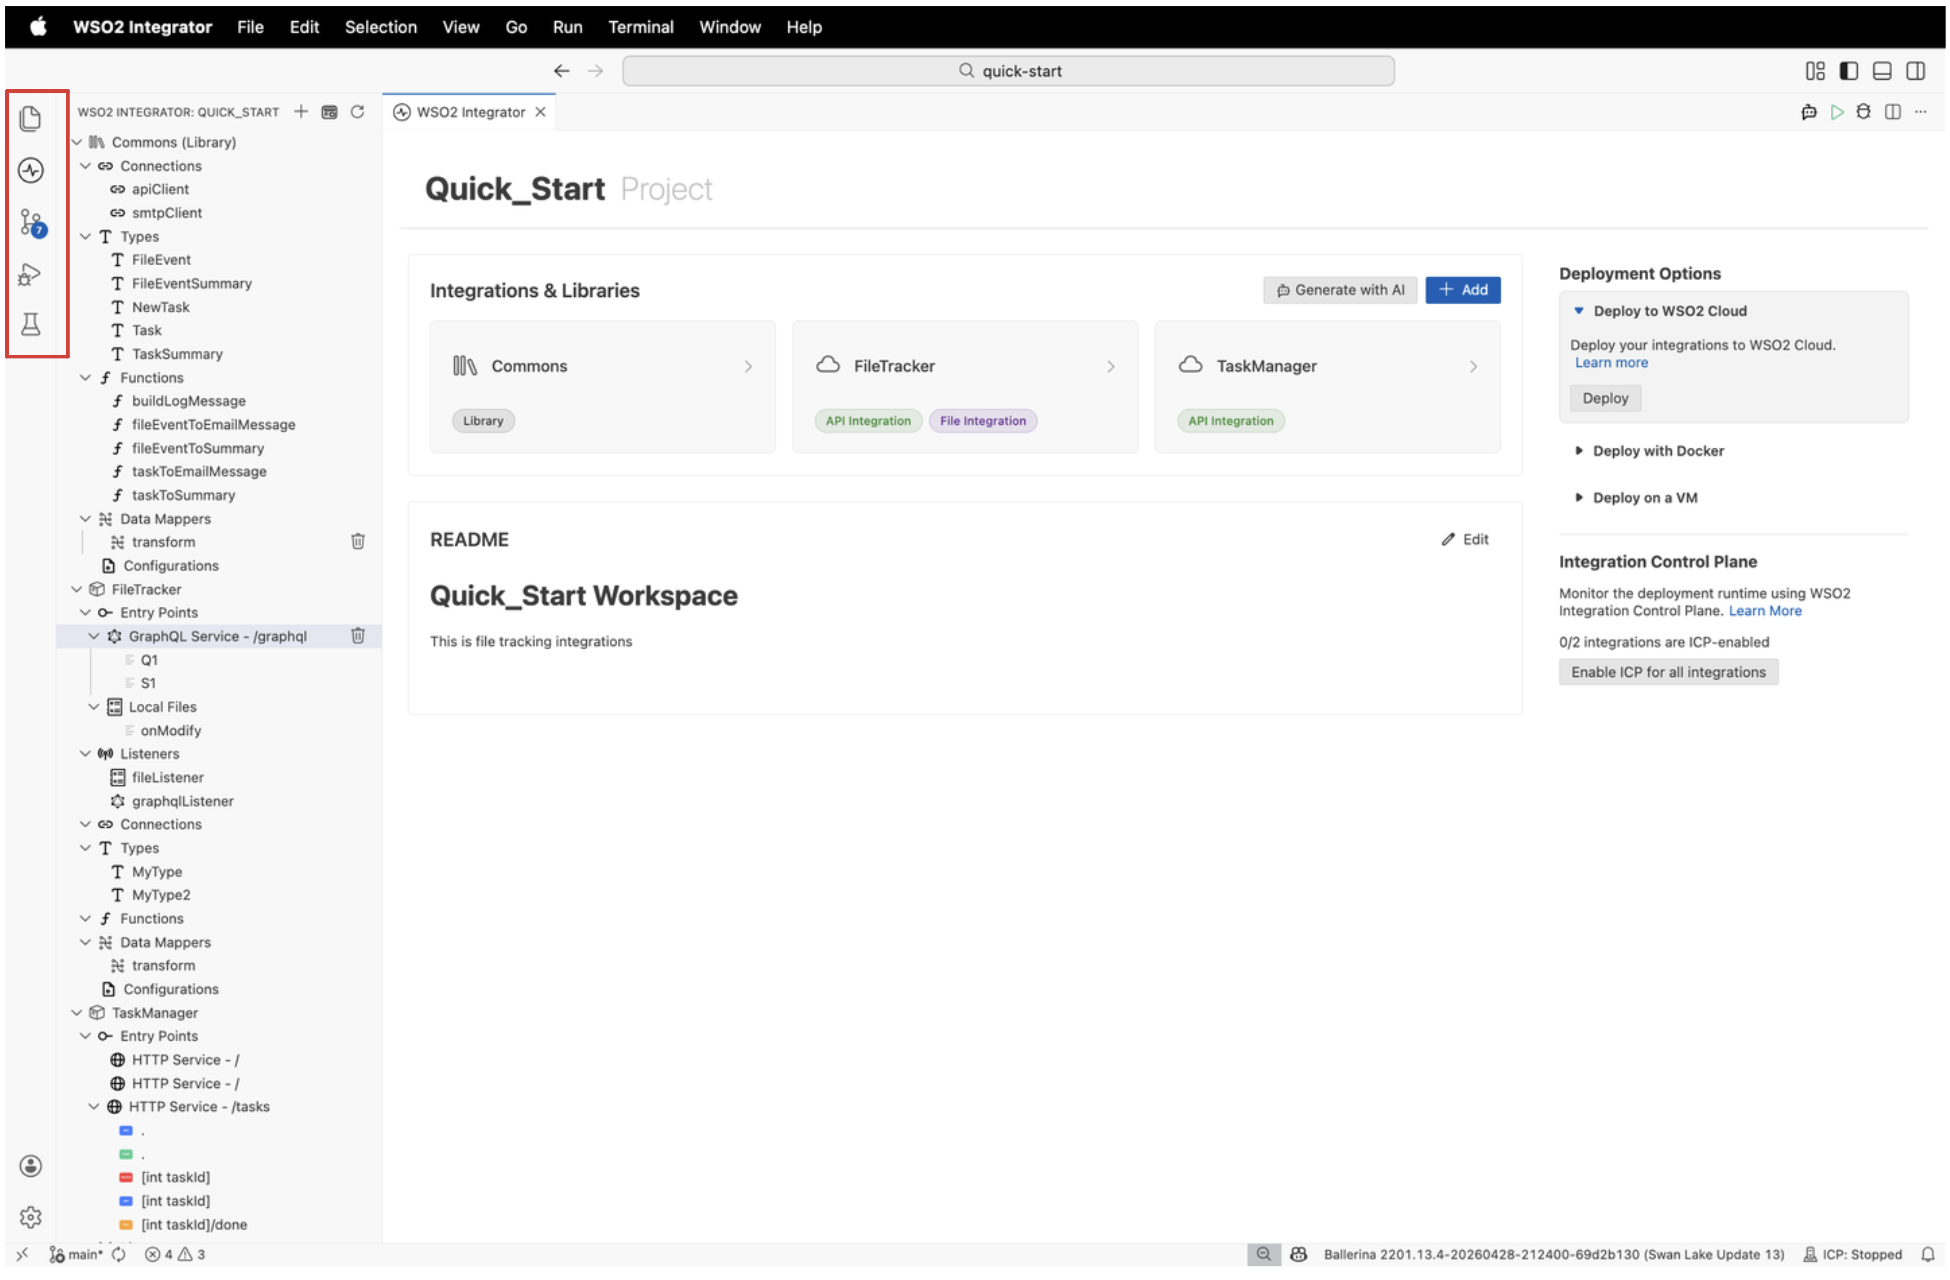
Project explorer
The project explorer is the left sidebar that organizes the contents of your project into a structured tree.
- At the project level, the project explorer lists all integrations and libraries in the project, grouped by name. Each entry is expandable to reveal its own artifact tree.
- Inside an integration or library, the project explorer organizes its components into sections by artifact type, making it easy to locate and manage the building blocks of your integration.
When an integration or library is open, the project explorer groups its artifacts into the following sections. Select an artifact name to open it in its dedicated view, or select the + icon next to a section to add a new one.
| Section | What it shows |
|---|---|
| Entry Points | HTTP services, GraphQL services, automations, and event listeners that trigger your integration. |
| Listeners | Protocol-specific configurations (host, port) that entry points bind to. |
| Connections | Configured links to external systems such as databases, HTTP APIs, and message brokers. |
| Types | Custom records, enums, arrays, service classes, and unions used in your integration. |
| Functions | Reusable logic blocks callable from entry points or other functions. |
| Data Mappers | Visual transformations between source and target types. |
| Configurations | Variables sourced from Config.toml at runtime. |
For details on each artifact type, see Integration artifacts.
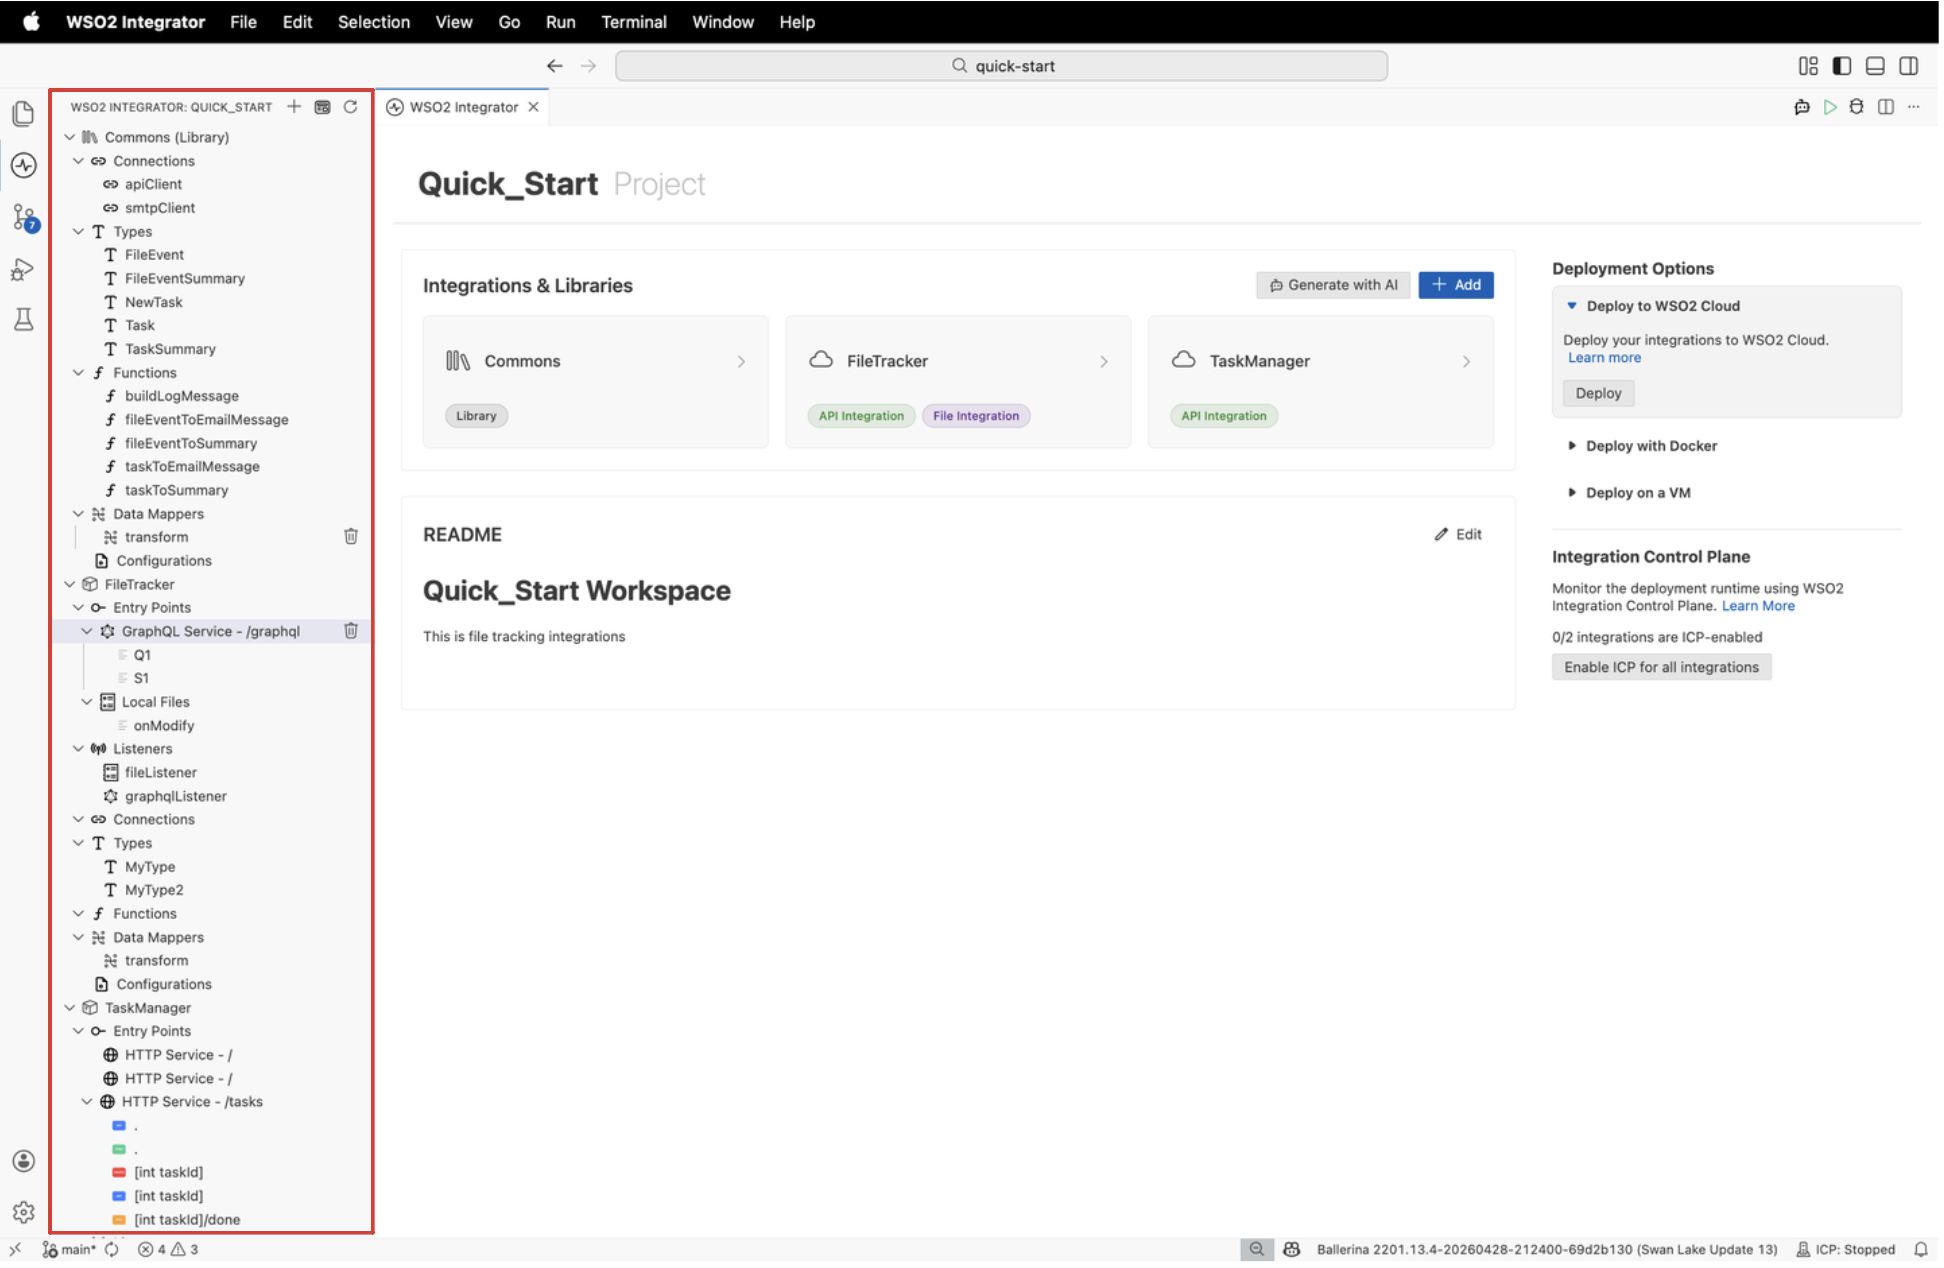
Editor tab area
The editor tab area sits above the canvas and shows one tab per open editor. The active tab is highlighted, and you can close a tab with the × action on it.
The WSO2 Integrator tab represents the visual designer for the current view. Other tabs, such as a Ballerina source file opened from the explorer, appear alongside it.
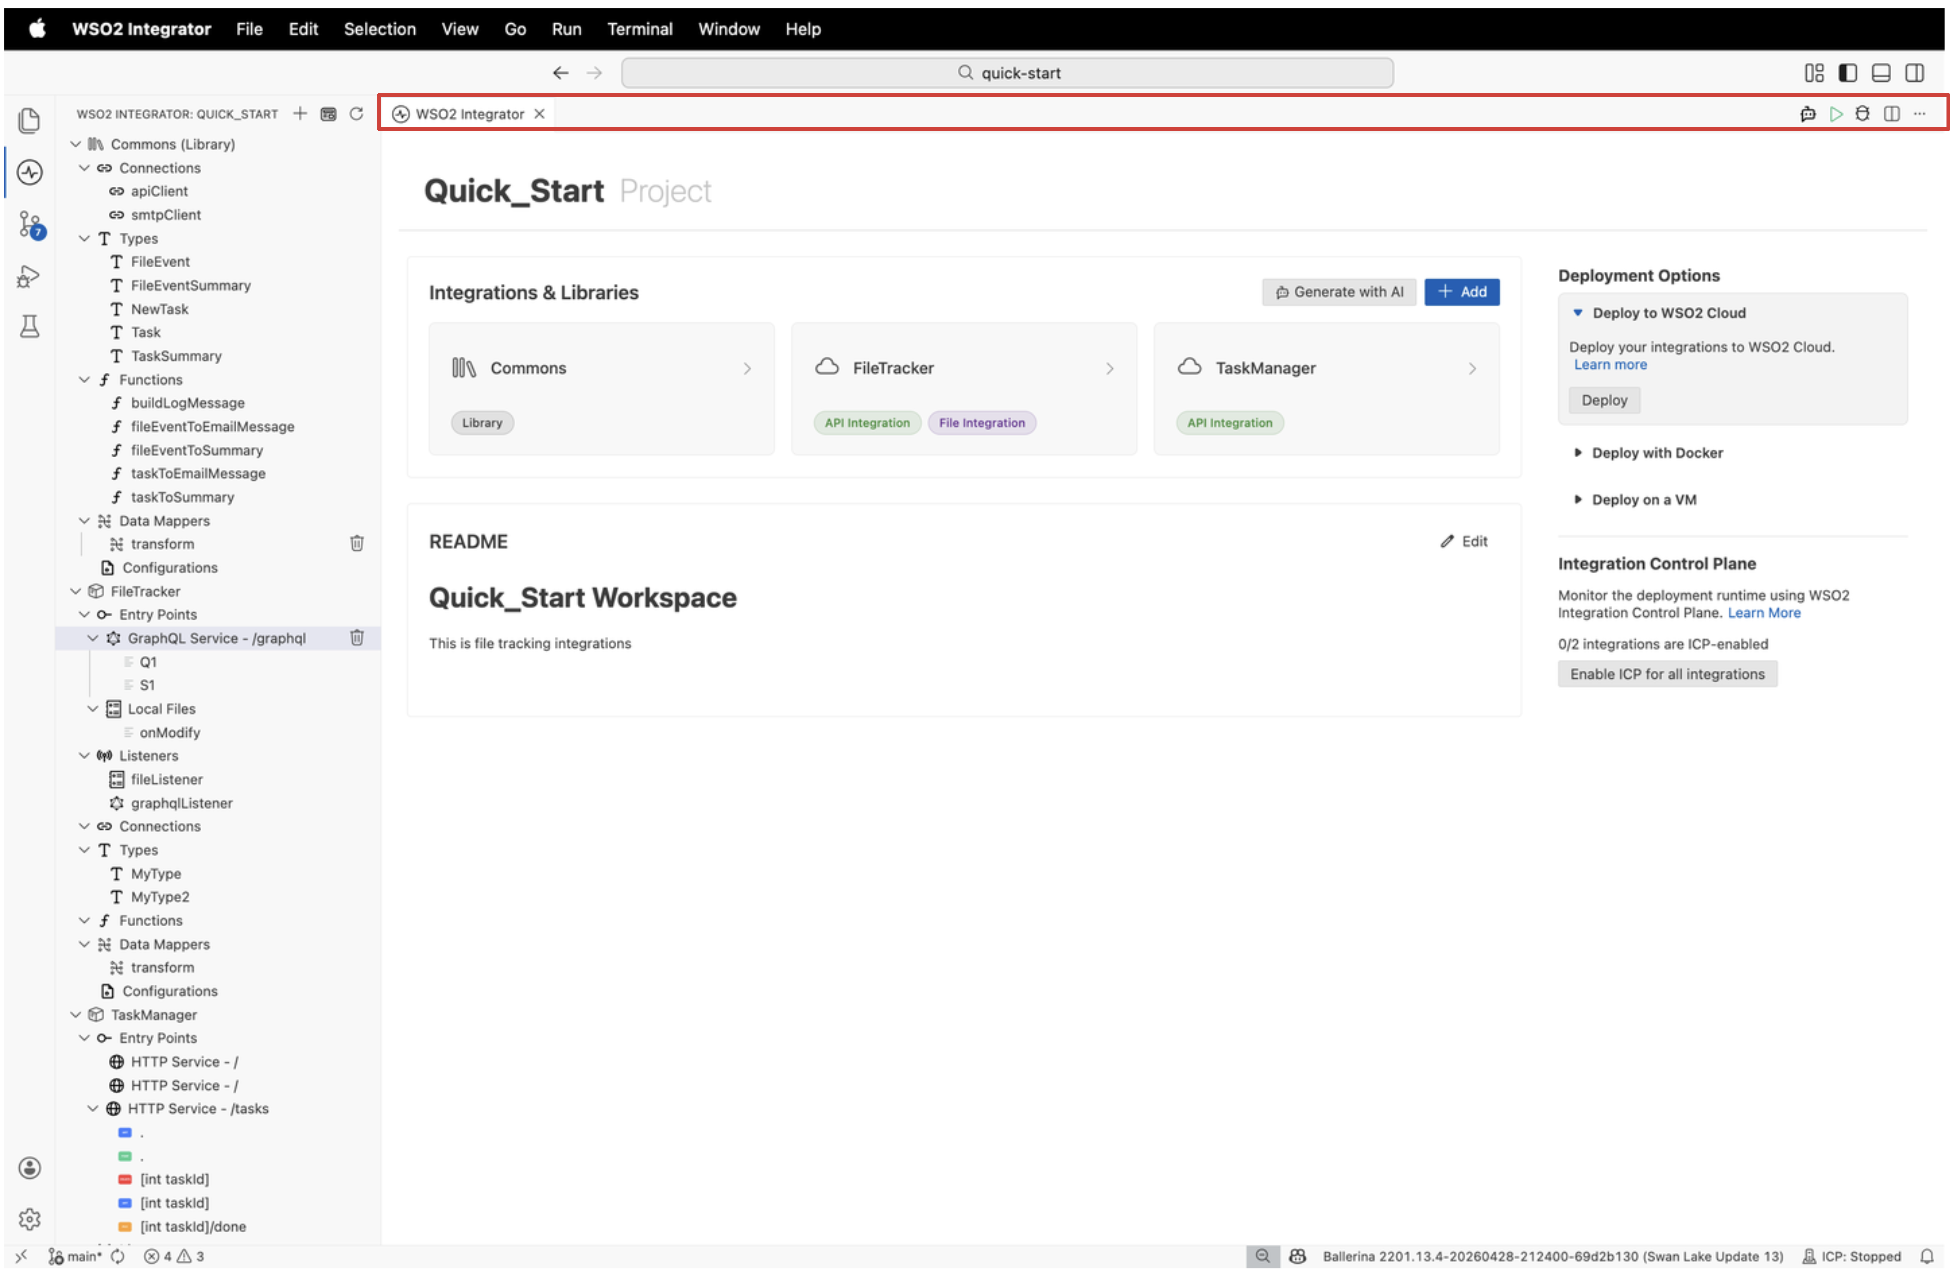
Editor toolbar
The editor toolbar appears on the right side of the editor tab bar and provides quick actions for the active integration.
| Action | Description |
|---|---|
| WSO2 Integrator Copilot | Opens the WSO2 Integrator Copilot chat panel for AI-powered assistance with building and troubleshooting your integration. |
| Run | Builds and runs the integration locally, starting all services and streaming output to the terminal. |
| Debug | Launches the integration with the debugger attached so you can set breakpoints and inspect variables. |
| Show Source | Switches the editor from the visual designer to the Ballerina source for the current artifact. |
| Split editor | Opens the active editor in a second column so you can view two surfaces side by side. |
| More (⋯) | Reveals additional editor actions, such as reopening recently closed editors and pinning the tab. |
The toolbar is the same across the Project view, Integrator view, and Library view, so the view-specific pages refer back to this section instead of repeating it.
What's next
- Project view — Work with multiple integrations and libraries.
- Integrator view — Build and manage a single integration.
- Library view — Build reusable libraries.