Observe MCP traffic on the AI Gateway
Overview
When AI agents call tools through your gateway, ordinary API monitoring tells you very little. A request count doesn't say which tool the agent reached for, how many agent runs it took, or whether a failure came from the agent or from your tool.
The WSO2 AI Gateway reports on the Model Context Protocol (MCP) proxies that expose your tools to agents. For each one you can observe call volume per tool, agent sessions, which client runtimes are calling, latency, and the error types behind every failure.
This guide shows you where to find each of those figures and how to read them.
Learning objectives
- Send MCP traffic through the AI Gateway, including a call that fails
- Find call volume, latency, and error rate on the Overview dashboard
- Read tool usage, agent sessions, and client distribution on MCP Analytics
- Tell a broken tool apart from a misbehaving agent
What you can observe
| Tool calls | Call volume in total and per tool, over any time range |
| Agent sessions | How many separate agent runs your tools served |
| Client distribution | Which agent runtimes are calling, by name and version |
| Latency | Call volume alongside execution time, so a slow tool shows up |
| Error rate and trend | What share of calls failed, and whether it is improving |
| Error types | Parse errors, invalid requests, missing methods, server errors |
| Tool call execution errors | Which individual tools are failing |
| Consumers | Which applications and agents are driving the load |
Prerequisites
- A WSO2 API Platform account. Sign up for free.
- An AI gateway that shows Active in the AI Workspace. See Setting up an AI Gateway.
- An MCP proxy fronting an MCP server, deployed to that gateway.
- The invoke URL for the proxy, and an API key if the proxy has authentication enabled.
curlfor sending test traffic.
If you're new to the AI Workspace, Get started with AI Workspace covers the gateway and proxy setup end to end.
Note
Insights in the AI Workspace is powered by Moesif and comes integrated, so there's nothing to connect. If your organization was created before February 20, 2026 and you already have a Moesif organization you want to use, see Integrate API Platform with Moesif.
Step 1: Send traffic through your gateway
An MCP client introduces itself before it calls anything. It sends an initialize request carrying a clientInfo block with its name and version, and the server replies with a session ID in an Mcp-Session-Id header. Every later call carries that header.
Follow the same sequence here. Skipping it still produces tool calls, but the panels that group by client and by session stay empty.
-
Open a session:
curl -k -i -X POST https://<MCP-PROXY-INVOKE-URL> \
  -H "X-API-Key: <YOUR-API-KEY>" \
  -H "Content-Type: application/json" \
  -H "Accept: application/json, text/event-stream" \
  -d '{
    "jsonrpc": "2.0",
    "id": 1,
    "method": "initialize",
    "params": {
      "protocolVersion": "2025-06-18",
      "capabilities": {},
      "clientInfo": {"name": "insights-demo-client", "version": "1.0.0"}
    }
  }'
Expected result:
HTTP 200, with anMcp-Session-Idheader in the response. Copy that value for the calls below. -
Ask the proxy for its tool list, passing the session ID:
curl -k -X POST https://<MCP-PROXY-INVOKE-URL> \
  -H "X-API-Key: <YOUR-API-KEY>" \
  -H "Content-Type: application/json" \
  -H "Accept: application/json, text/event-stream" \
  -H "Mcp-Session-Id: <SESSION-ID>" \
  -d '{"jsonrpc": "2.0", "id": 2, "method": "tools/list"}'
Expected result:
HTTP 200with the tools the proxy exposes, including the arguments each one takes. -
Call one of those tools a few times, changing the arguments each time:
curl -k -X POST https://<MCP-PROXY-INVOKE-URL> \
  -H "X-API-Key: <YOUR-API-KEY>" \
  -H "Content-Type: application/json" \
  -H "Accept: application/json, text/event-stream" \
  -H "Mcp-Session-Id: <SESSION-ID>" \
  -d '{
    "jsonrpc": "2.0",
    "id": 3,
    "method": "tools/call",
    "params": {"name": "<TOOL-NAME>", "arguments": {}}
  }'
Expected result:
HTTP 200with the tool's result. -
Call a tool that doesn't exist, so the error panels have data:
curl -k -X POST https://<MCP-PROXY-INVOKE-URL> \
  -H "X-API-Key: <YOUR-API-KEY>" \
  -H "Content-Type: application/json" \
  -H "Accept: application/json, text/event-stream" \
  -H "Mcp-Session-Id: <SESSION-ID>" \
  -d '{"jsonrpc": "2.0", "id": 4, "method": "tools/call", "params": {"name": "no-such-tool", "arguments": {}}}'
Expected result:
HTTP 200with a JSON-RPC error saying the method was not found.
Tip
Repeat step 1 with a different clientInfo name to open a second session. Two named clients give Client Distribution and Unique Sessions something to compare.
Step 2: Open Insights and set the scope
- Sign in to WSO2 API Platform, then click AI Workspace in the header.
- Select your organization and project from the selectors at the top of the page.
- In the left navigation menu, click Insights.
- Set Environment to the environment your proxy is deployed to, such as Development.
- Set the time range to cover the period you want to look at.
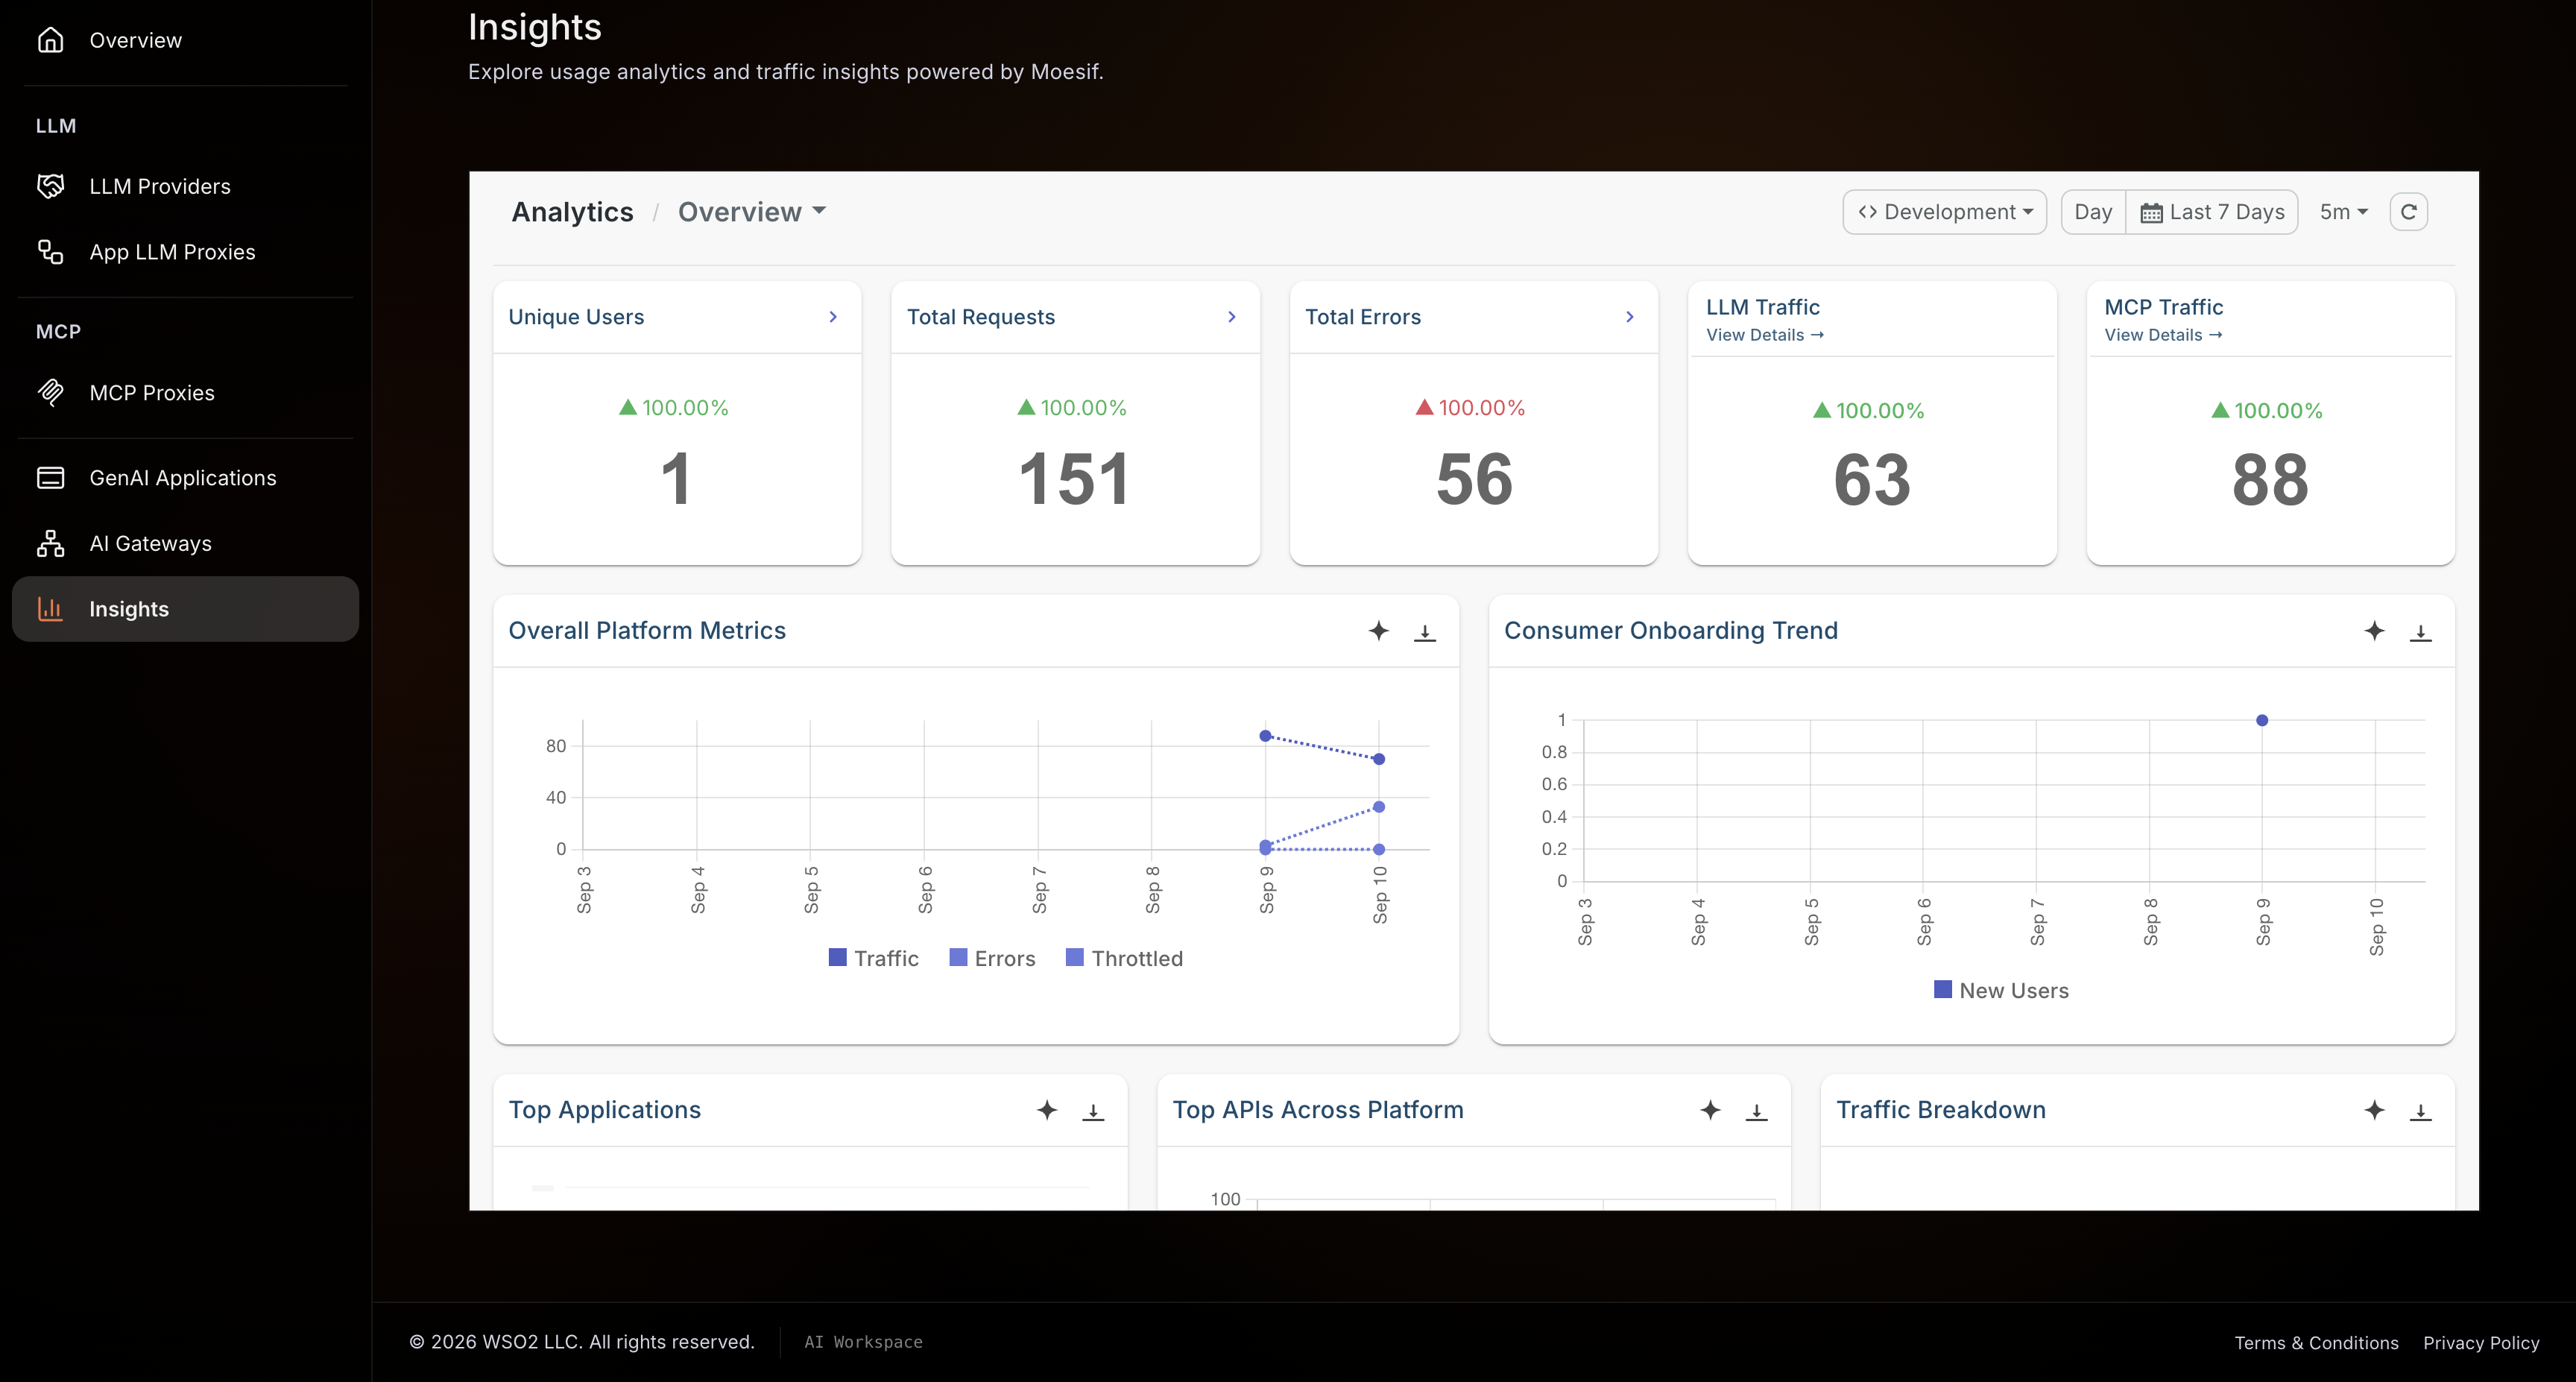
Expected result: The Overview dashboard opens with summary tiles above a set of charts.
Step 3: Check overall health on the Overview dashboard
The Overview dashboard answers one question: is anything wrong right now? Start here before opening a specific dashboard.
- Read the summary tiles. Total Requests and Total Errors cover all your traffic, and MCP Traffic shows how much of it is agent tool calls.
- Check Overall Platform Metrics for traffic, errors, and throttled requests on one chart. Spikes that line up tell you demand caused the failures; errors rising on flat traffic point somewhere else.
- Check Average Latency over Time. A single tall spike is usually one slow call and can be ignored. A line that rises and stays high means something changed, such as a tool's backend slowing down.
- Use Traffic Breakdown, Top APIs Across Platform, and Top Applications to see which proxies and which consumers are generating the load.
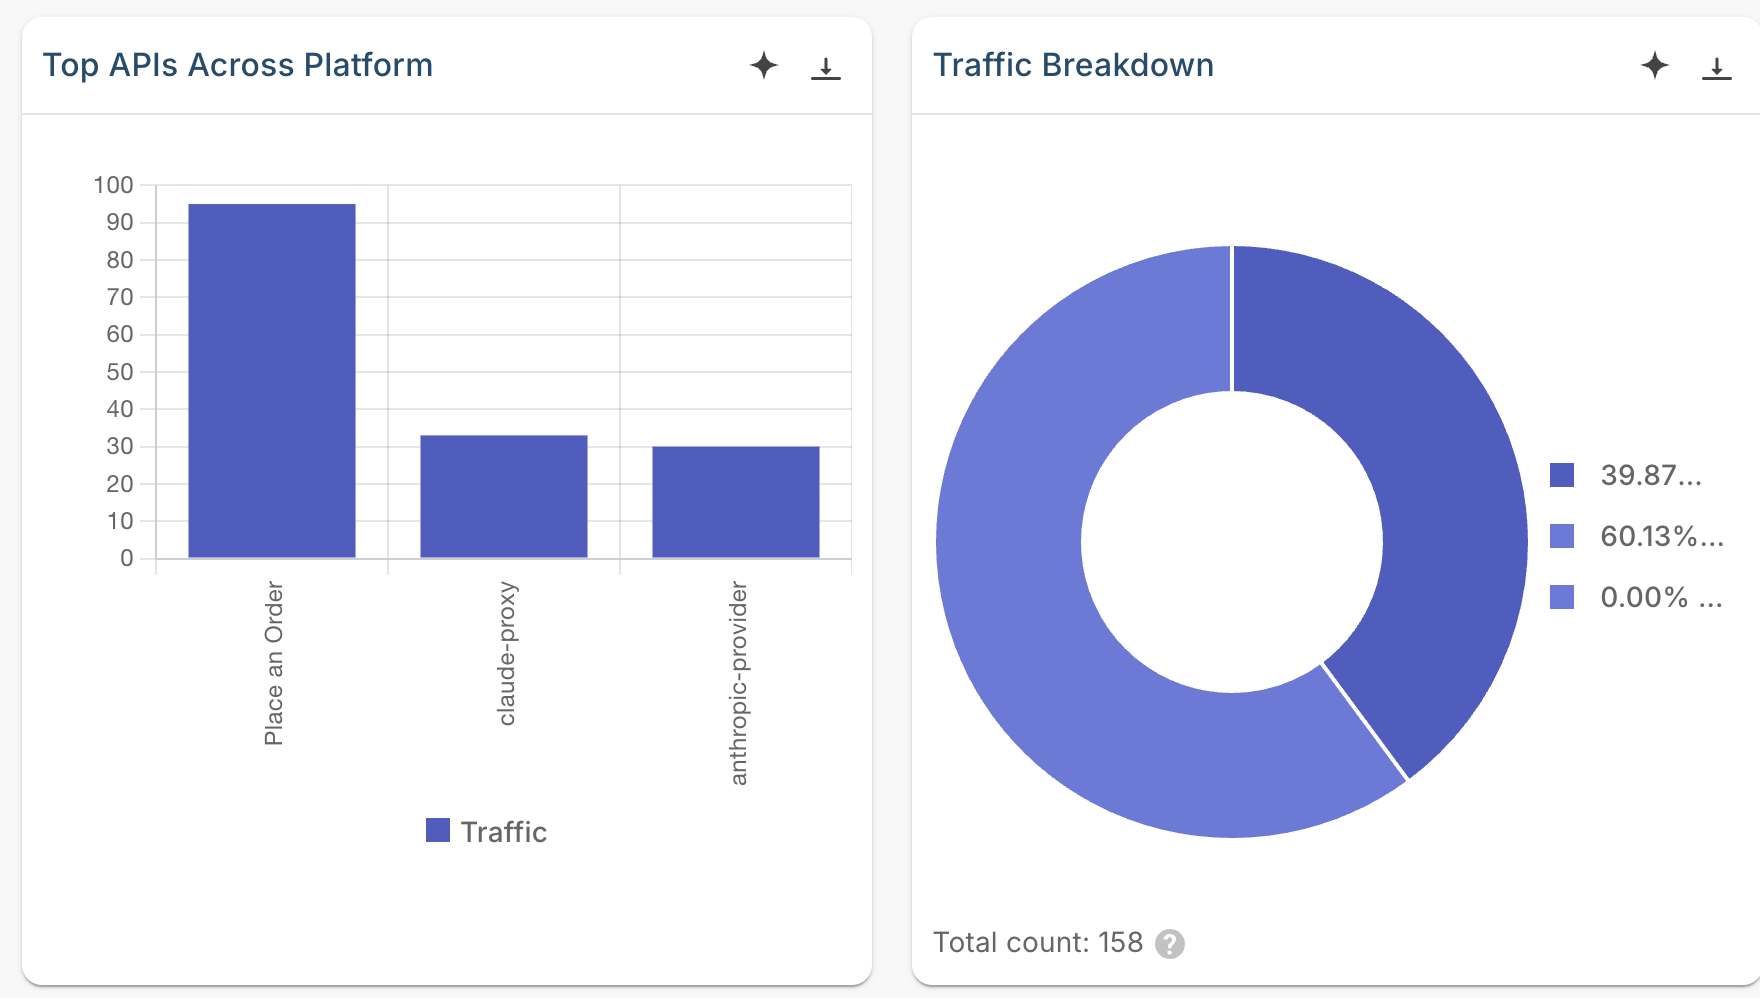
The Overview dashboard also charts traffic intensity by day and hour, client platforms and user agents, new consumer registrations, and request origin on a geographic map. See Insights overview for the full list.
Step 4: Read MCP tool activity
Click View Details on the MCP Traffic tile to open MCP Analytics.
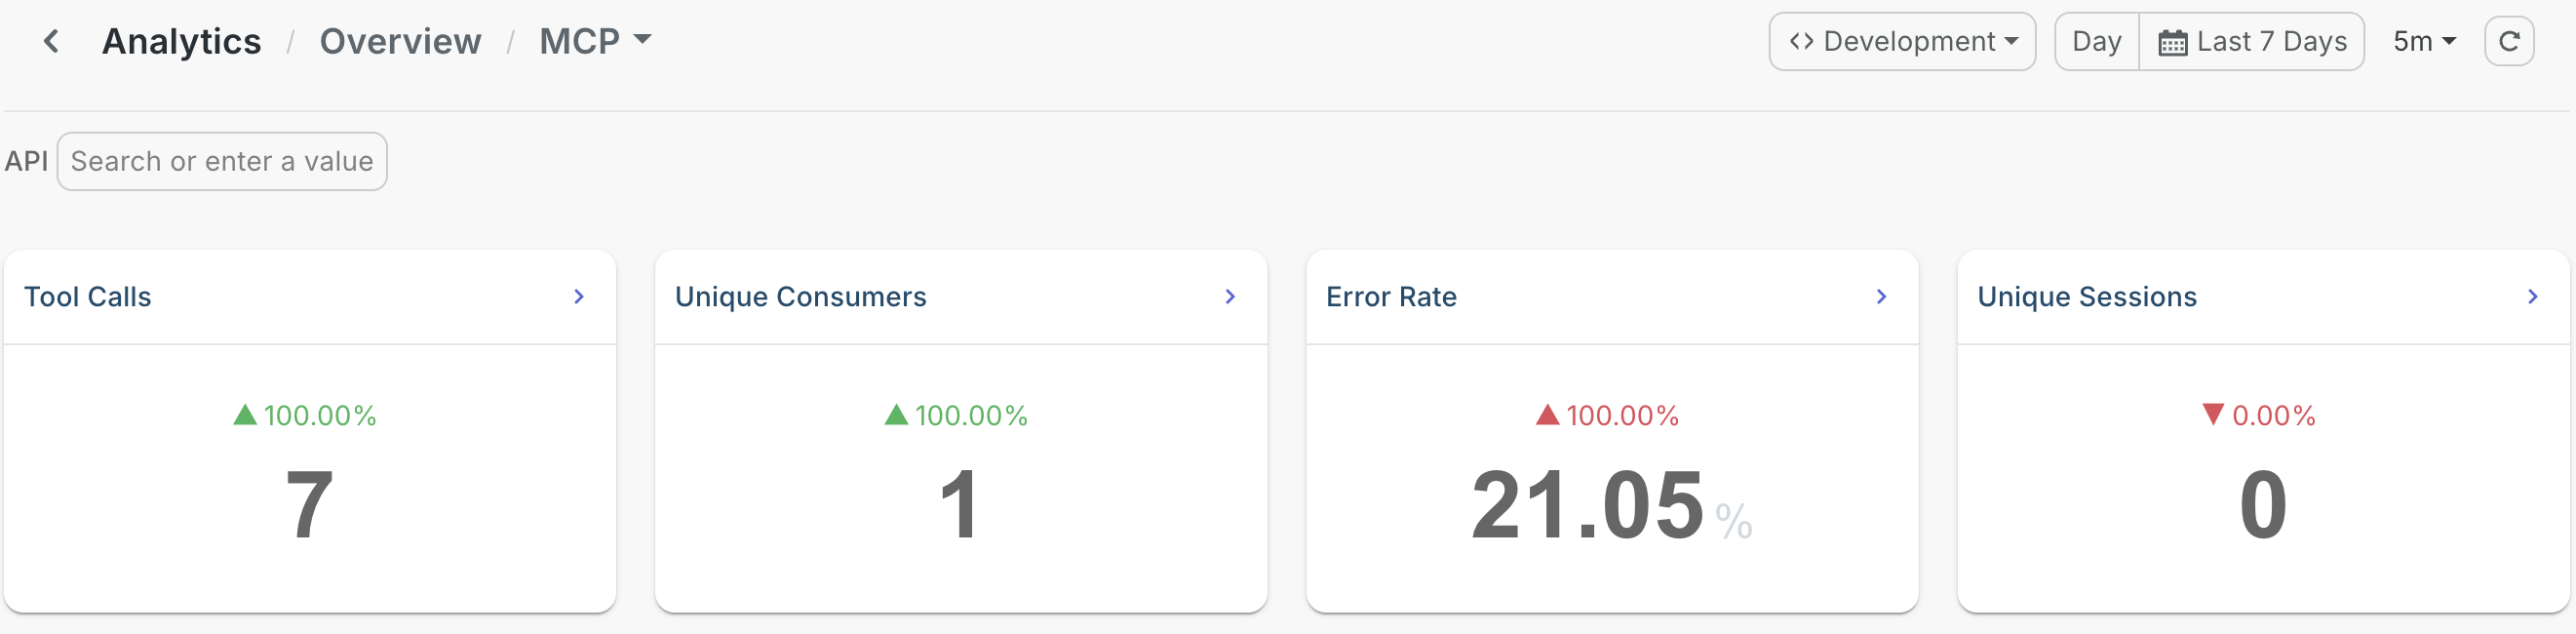
Four summary tiles sit at the top:
- Tool Calls: how many calls your tools served.
- Unique Consumers: how many distinct callers made them.
- Error Rate: what share of those calls failed.
- Unique Sessions: how many agent runs, rather than how many calls.
Then work through the charts:
| Chart | What to look for |
|---|---|
| Top Tools by Calls | Which tools agents actually reach for, so you know which ones to keep reliable. |
| Traffic Volume over Time | Call volume alongside latency, so a spike in tool usage slowing execution is visible. |
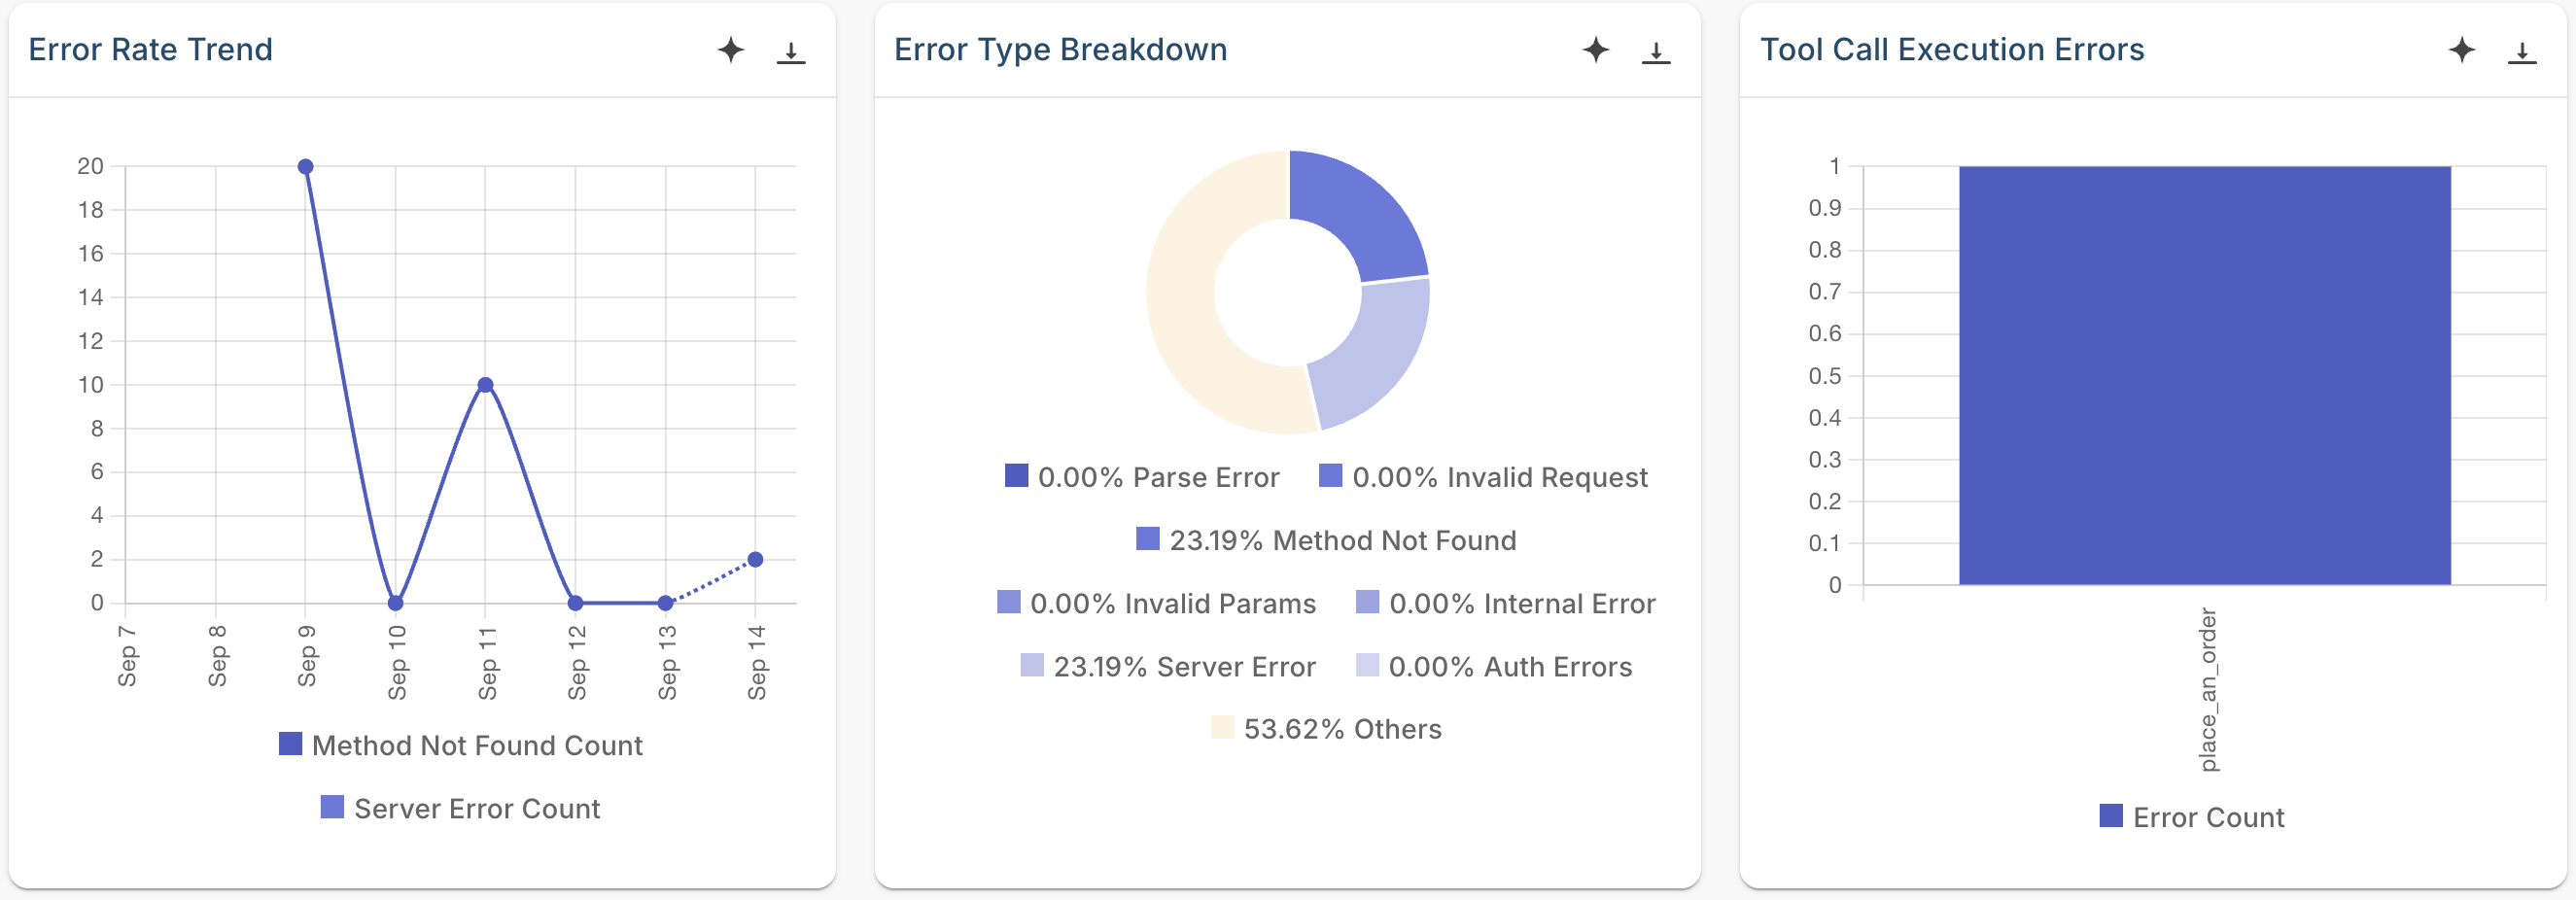
| Error Type Breakdown | Parse errors, invalid requests, missing methods, and invalid parameters point at the calling agent; internal and server errors point at your tool. |
| Error Rate Trend | When a problem started, and whether it's improving. |
| Tool Call Execution Errors | Which individual tools are failing, so you can tell a broken tool from a misbehaving agent. |
| Server Distribution and Client Distribution | Which MCP servers carry the load, and which agent runtimes are calling them. |
| Unique Consumers over Time | Whether MCP adoption is spreading across teams. |
Verify
- On the Overview dashboard, confirm MCP Traffic shows a count and Total Errors counts your failed call.
- On MCP Analytics, confirm your tool appears under Top Tools by Calls.
- Confirm Unique Sessions matches the number of sessions you opened, and Client Distribution names your client.
Troubleshooting
| Symptom | Resolution |
|---|---|
| No data on any dashboard | Start the gateway with docker compose --env-file configs/keys.env up, using the file generated when you registered the gateway. It holds the key the runtime publishes with. |
| Every tile reads zero | Set Environment to the environment your proxy is deployed to. |
| You want calls attributed to individual consumers | Attach the MCP Authentication policy to the proxy. The gateway then records the authenticated caller on each event, and Unique Consumers groups by that identity. |
Next steps
- Insights overview: every dashboard, metric, and chart available in Insights
- Apply policies to MCP proxies: add authentication and access control to your tools, then watch the effect on the consumer and error panels
- Convert a REST API into an MCP tool: expose an existing API as a governed MCP server
- Find and connect to an enterprise MCP server from the MCP Hub: discover MCP servers and connect an agent to them
Try the samples
Two companion samples run the AI Gateway with a ready-made MCP server, so you don't need to build one first.
- MCP analytics with Moesif: generates tool traffic and reports it on the same Insights dashboards this guide covers.
- MCP metrics and tracing: runs Prometheus, Grafana, and Jaeger alongside the gateway for the runtime's own metrics and per-request traces.
On a standalone AI Gateway you choose how to observe it. Point the runtime at Moesif for the analytics dashboards, or at Prometheus, Grafana, and Jaeger for metrics and traces.