Overview
Moesif Basic provides a frictionless and integrated API analytics experience in WSO2 API Platform at no additional expense under your current WSO2 subscription. Without any complex setup or instrumentation, you get real-time observability and telemetry across heterogeneous API environments. You can leverage this unified telemetry plane to monitor traffic, audit system behaviors, diagnose infrastructure latencies, and more. WSO2 gateways directly integrate with and route telemetry to Moesif, helping enterprise architects eliminate the overhead associated with constructing bespoke analytical pipelines.
This document describes the setup processes and the available features to help you get started with Moesif in WSO2 API Platform.
Setup and access configurations
Moesif is available in:
- SaaS/cloud-managed endpoints in WSO2 API Platform Cloud
- Self-managed, hybrid deployments using the self-hosted API Platform Gateway and API Manager
SaaS control plane in WSO2 API Platform Cloud
For managed SaaS environments, setup is executed entirely through the cloud Console.
When you create an organization using the Console, you can start using Moesif Basic right away without any additional steps. To access it, from the organization or project view in the Console, select Insights and then API Insights in the navigation menu.
Self-Hosted Platform Gateway (WSO2 API Platform)
For self-hosted Platform API and AI gateways, follow these instructions:
Self-Managed WSO2 API Manager
Follow the instructions in Moesif Analytics Integration in API Manager docs.
How to Use Moesif Basic
Moesif Basic provides real-time traffic observability, automated email alerting, and highly optimized analytics panels accessible directly from the API Platform Cloud Console and API Manager Publisher Portal.
Real-Time Alerts
You can define static, threshold-based alerts for real-time monitoring of critical metrics.
Creating an alert rule involves specifying the following:
- The API
- The metric to observe
- The threshold value of the metric that triggers the alert
- The email notification channel to receive alerts
Alerts notify automatically to the configured email address when API exceeds a specified threshold of a metric; for example, too many 400 Bad Request errors or when 90th percentile latency exceeds 10 seconds.
You can access details about existing alert rules any time as well as the history of triggered alerts. The preserved history helps you track incident patterns over time.
Real-Time Analytics Dashboards
Moesif Basic arranges the analytics dashboards into several segments. The Overview screen shows a rundown of usage and state across your existing APIs, LLM proxies, and MCP servers in the specified time period. The individual analytics screens for each contain more information where you can also filter by specific APIs, LLM proxies, and MCP servers.
These are the different analytics dashboards that are available:
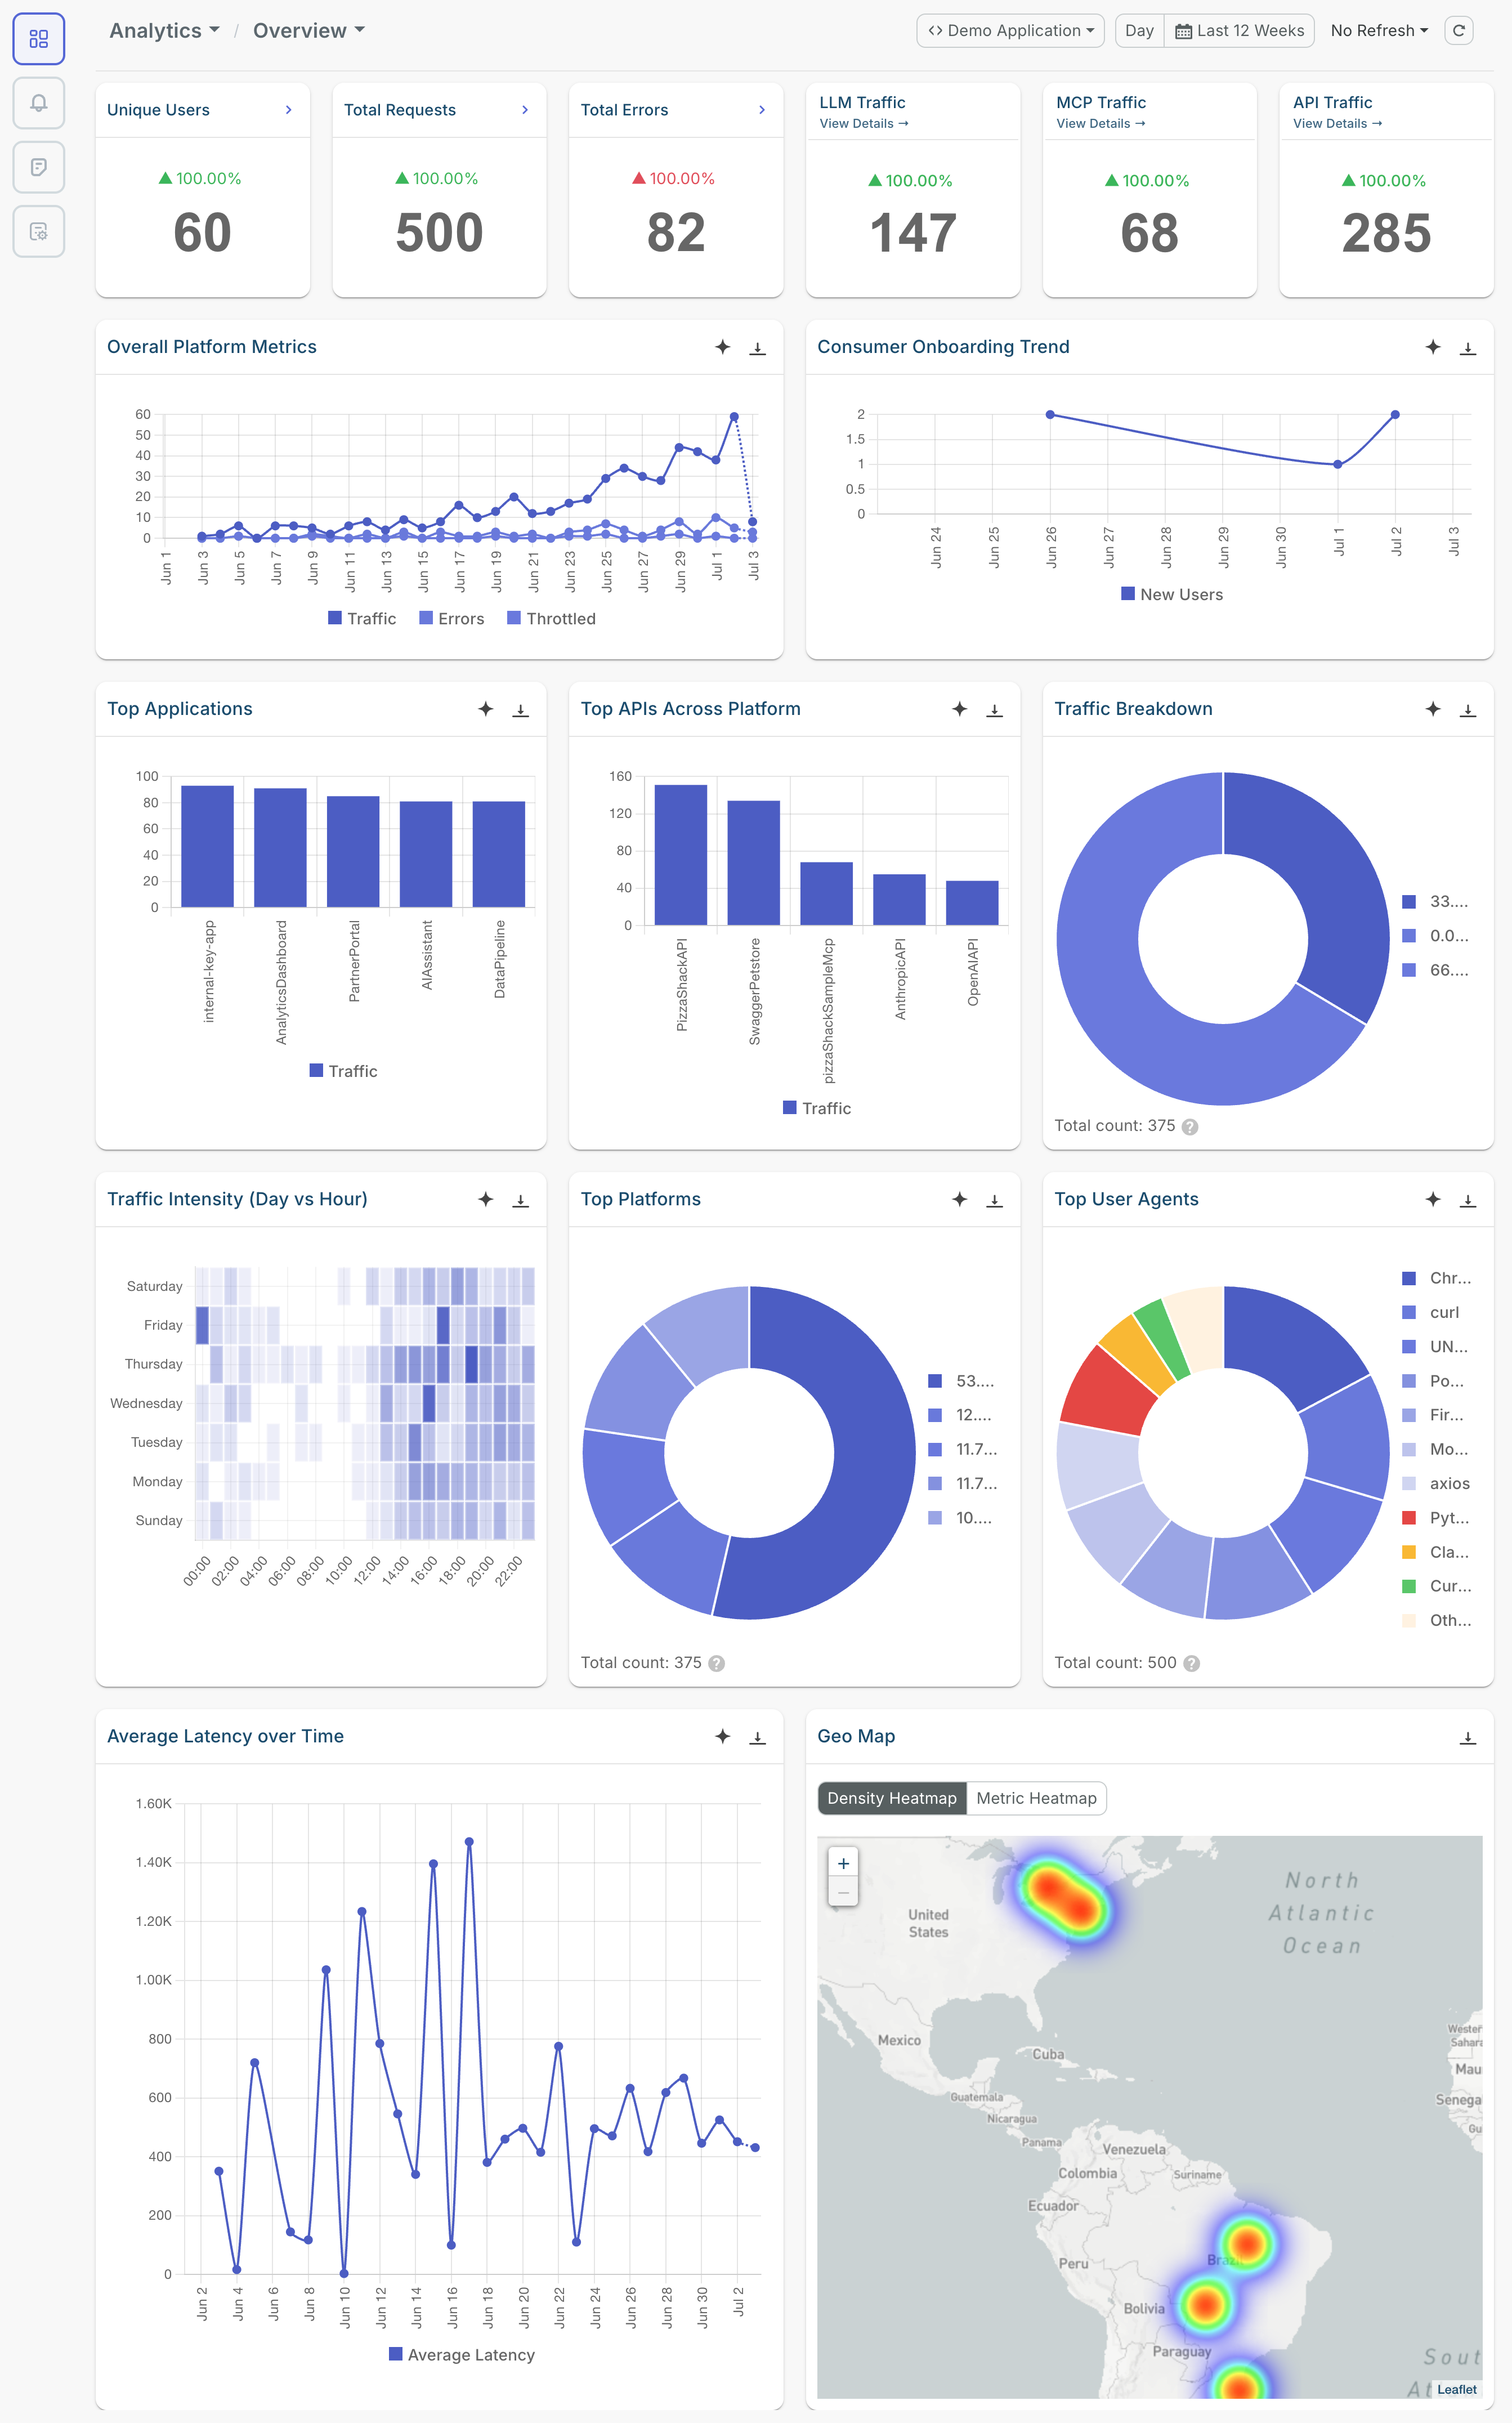
Analytics Overview
- Unique users
- Total requests
- Total errors
- LLM traffic
- MCP traffic
- Overall platform metrics
- Consumer onboarding trend
- Top applications
- Top APIs across platform
- Traffic breakdown across APIs, LLM proxies, and MCP
- Traffic intensity across hourly intervals each day
- Top platforms and user agents
- Average latency over time
- Geographic heatmaps
The following image shows some of the dashboards in the Overview screen:
API Analytics
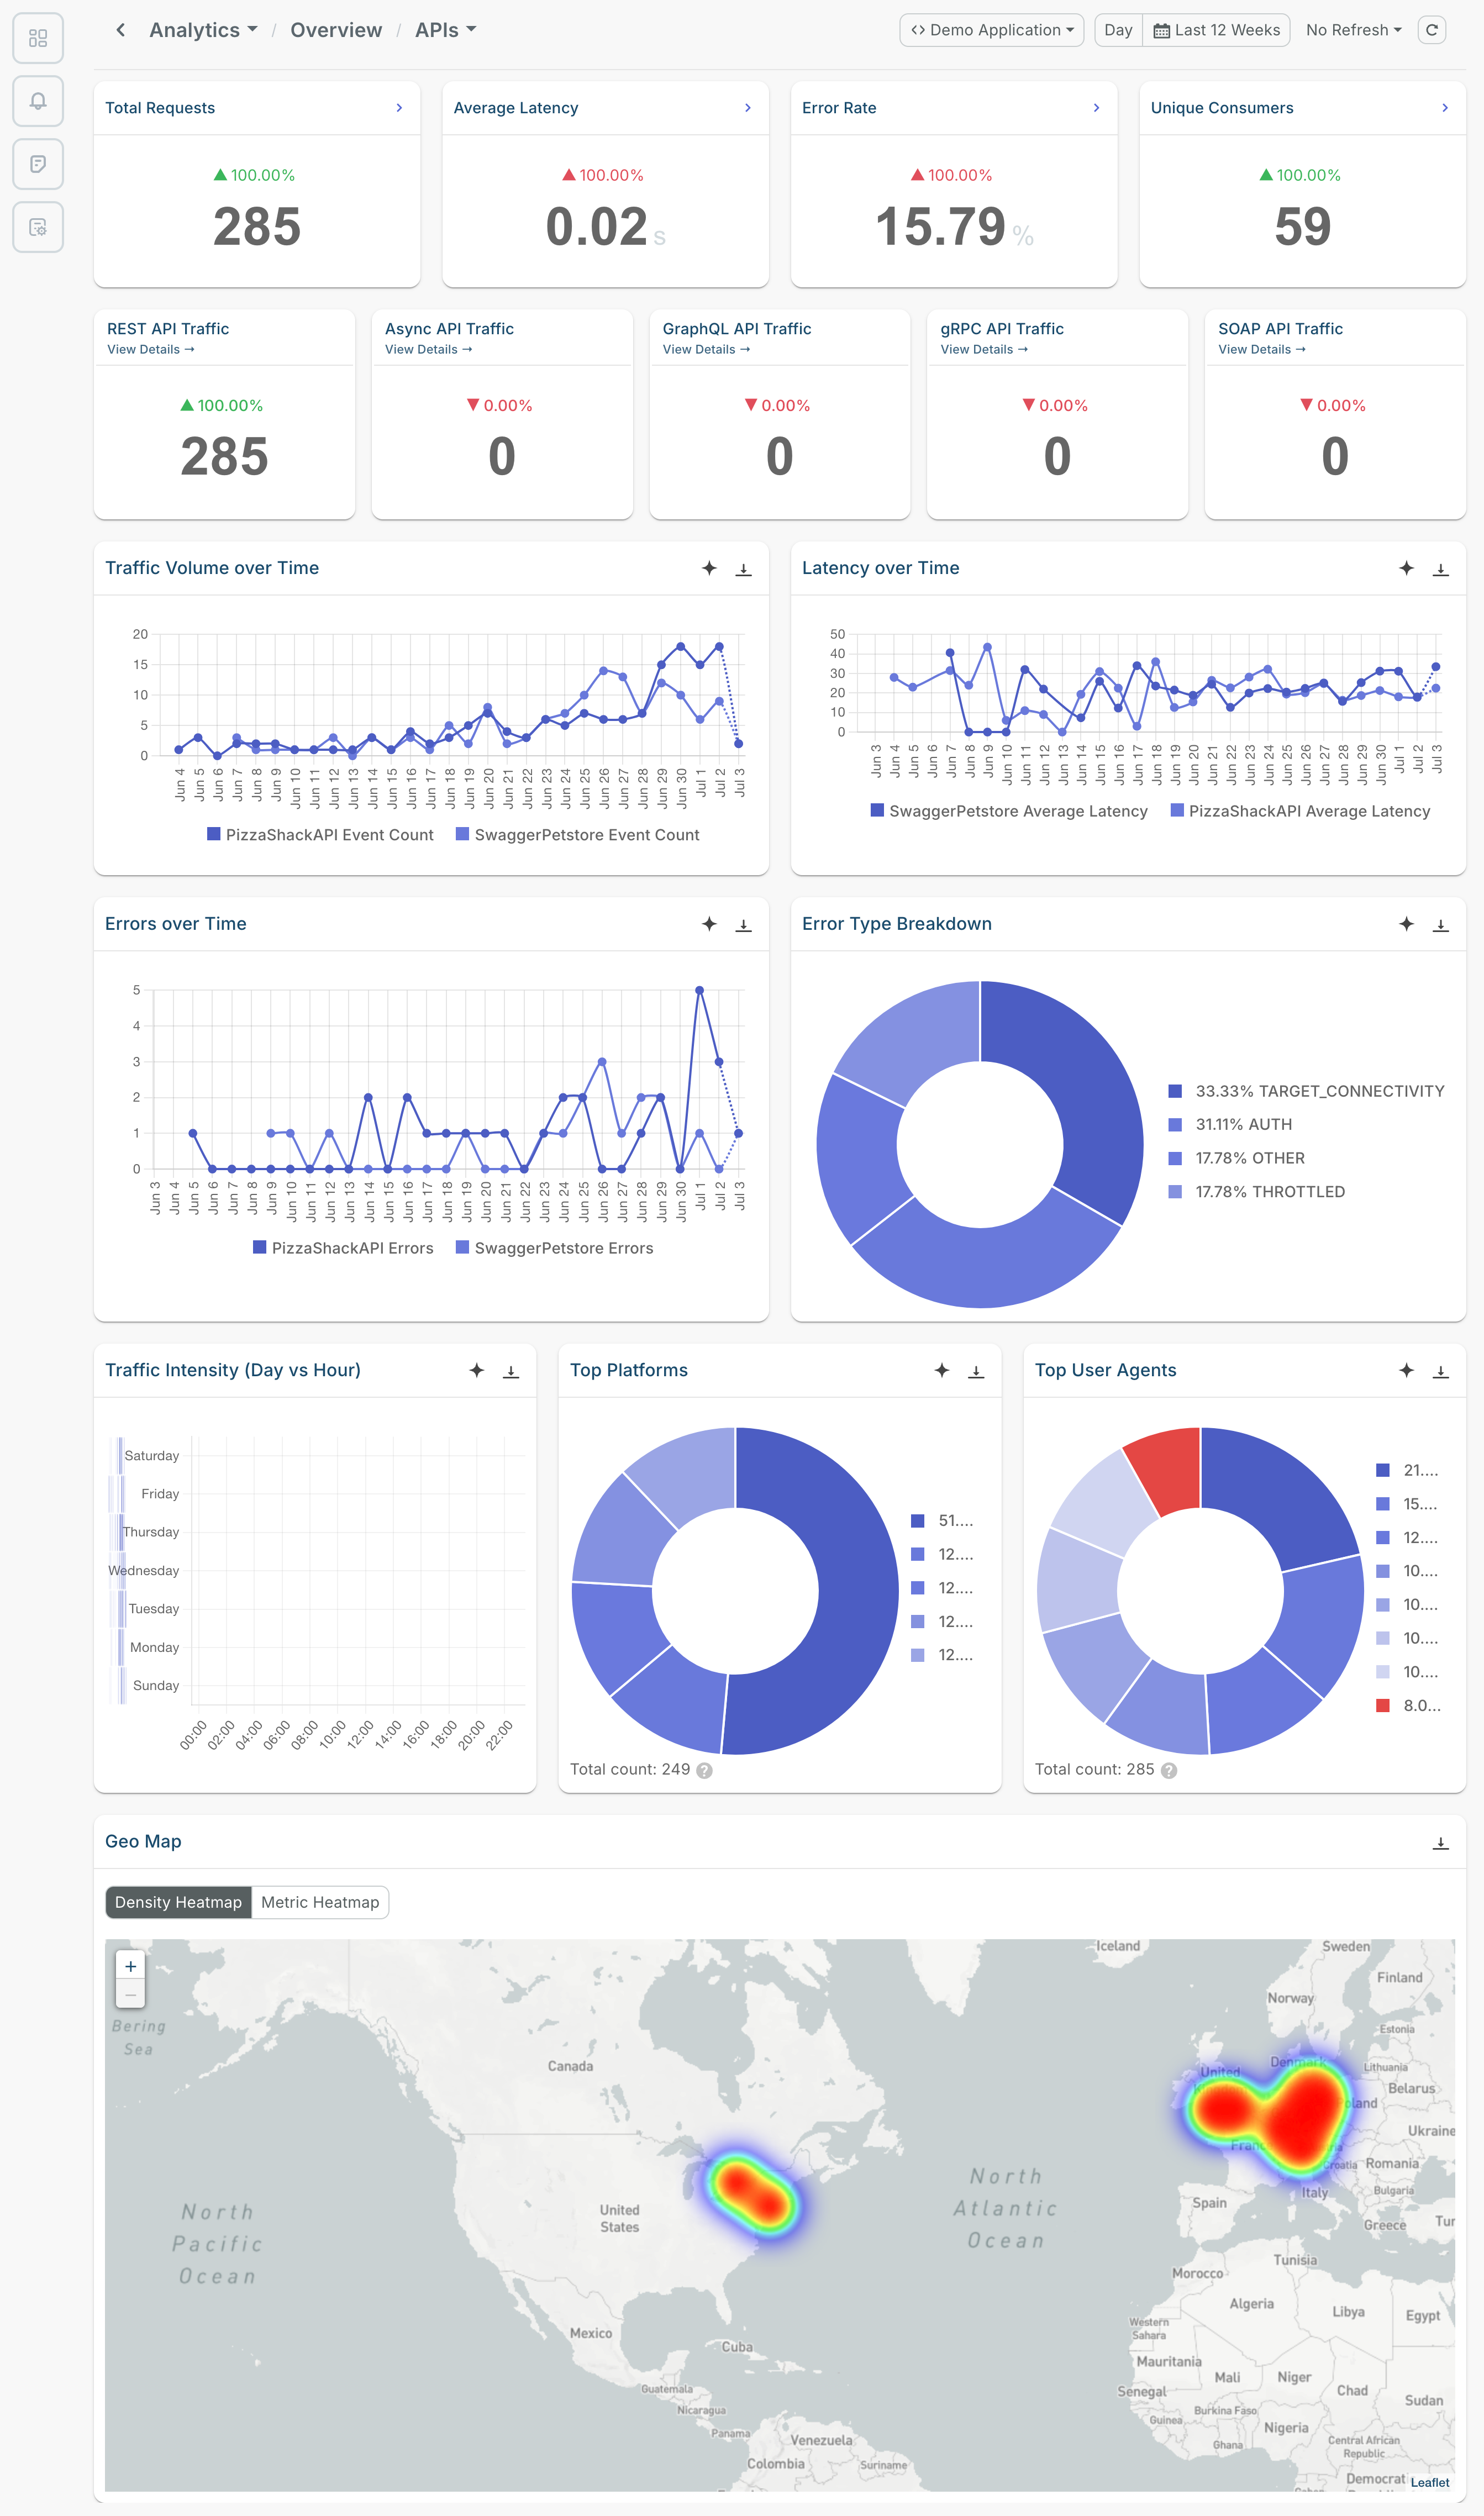
- Total requests
- Average latency
- Error rate
- Unique consumers
- Traffic details for REST, Async, GraphQL, gRPC, and SOAP APIs
- Latency and traffic volume over time
- Errors over time
- Error type breakdown
- Traffic intensity across hourly intervals each day
- Top platforms and user agents
- Geographic heatmaps
LLM Analytics
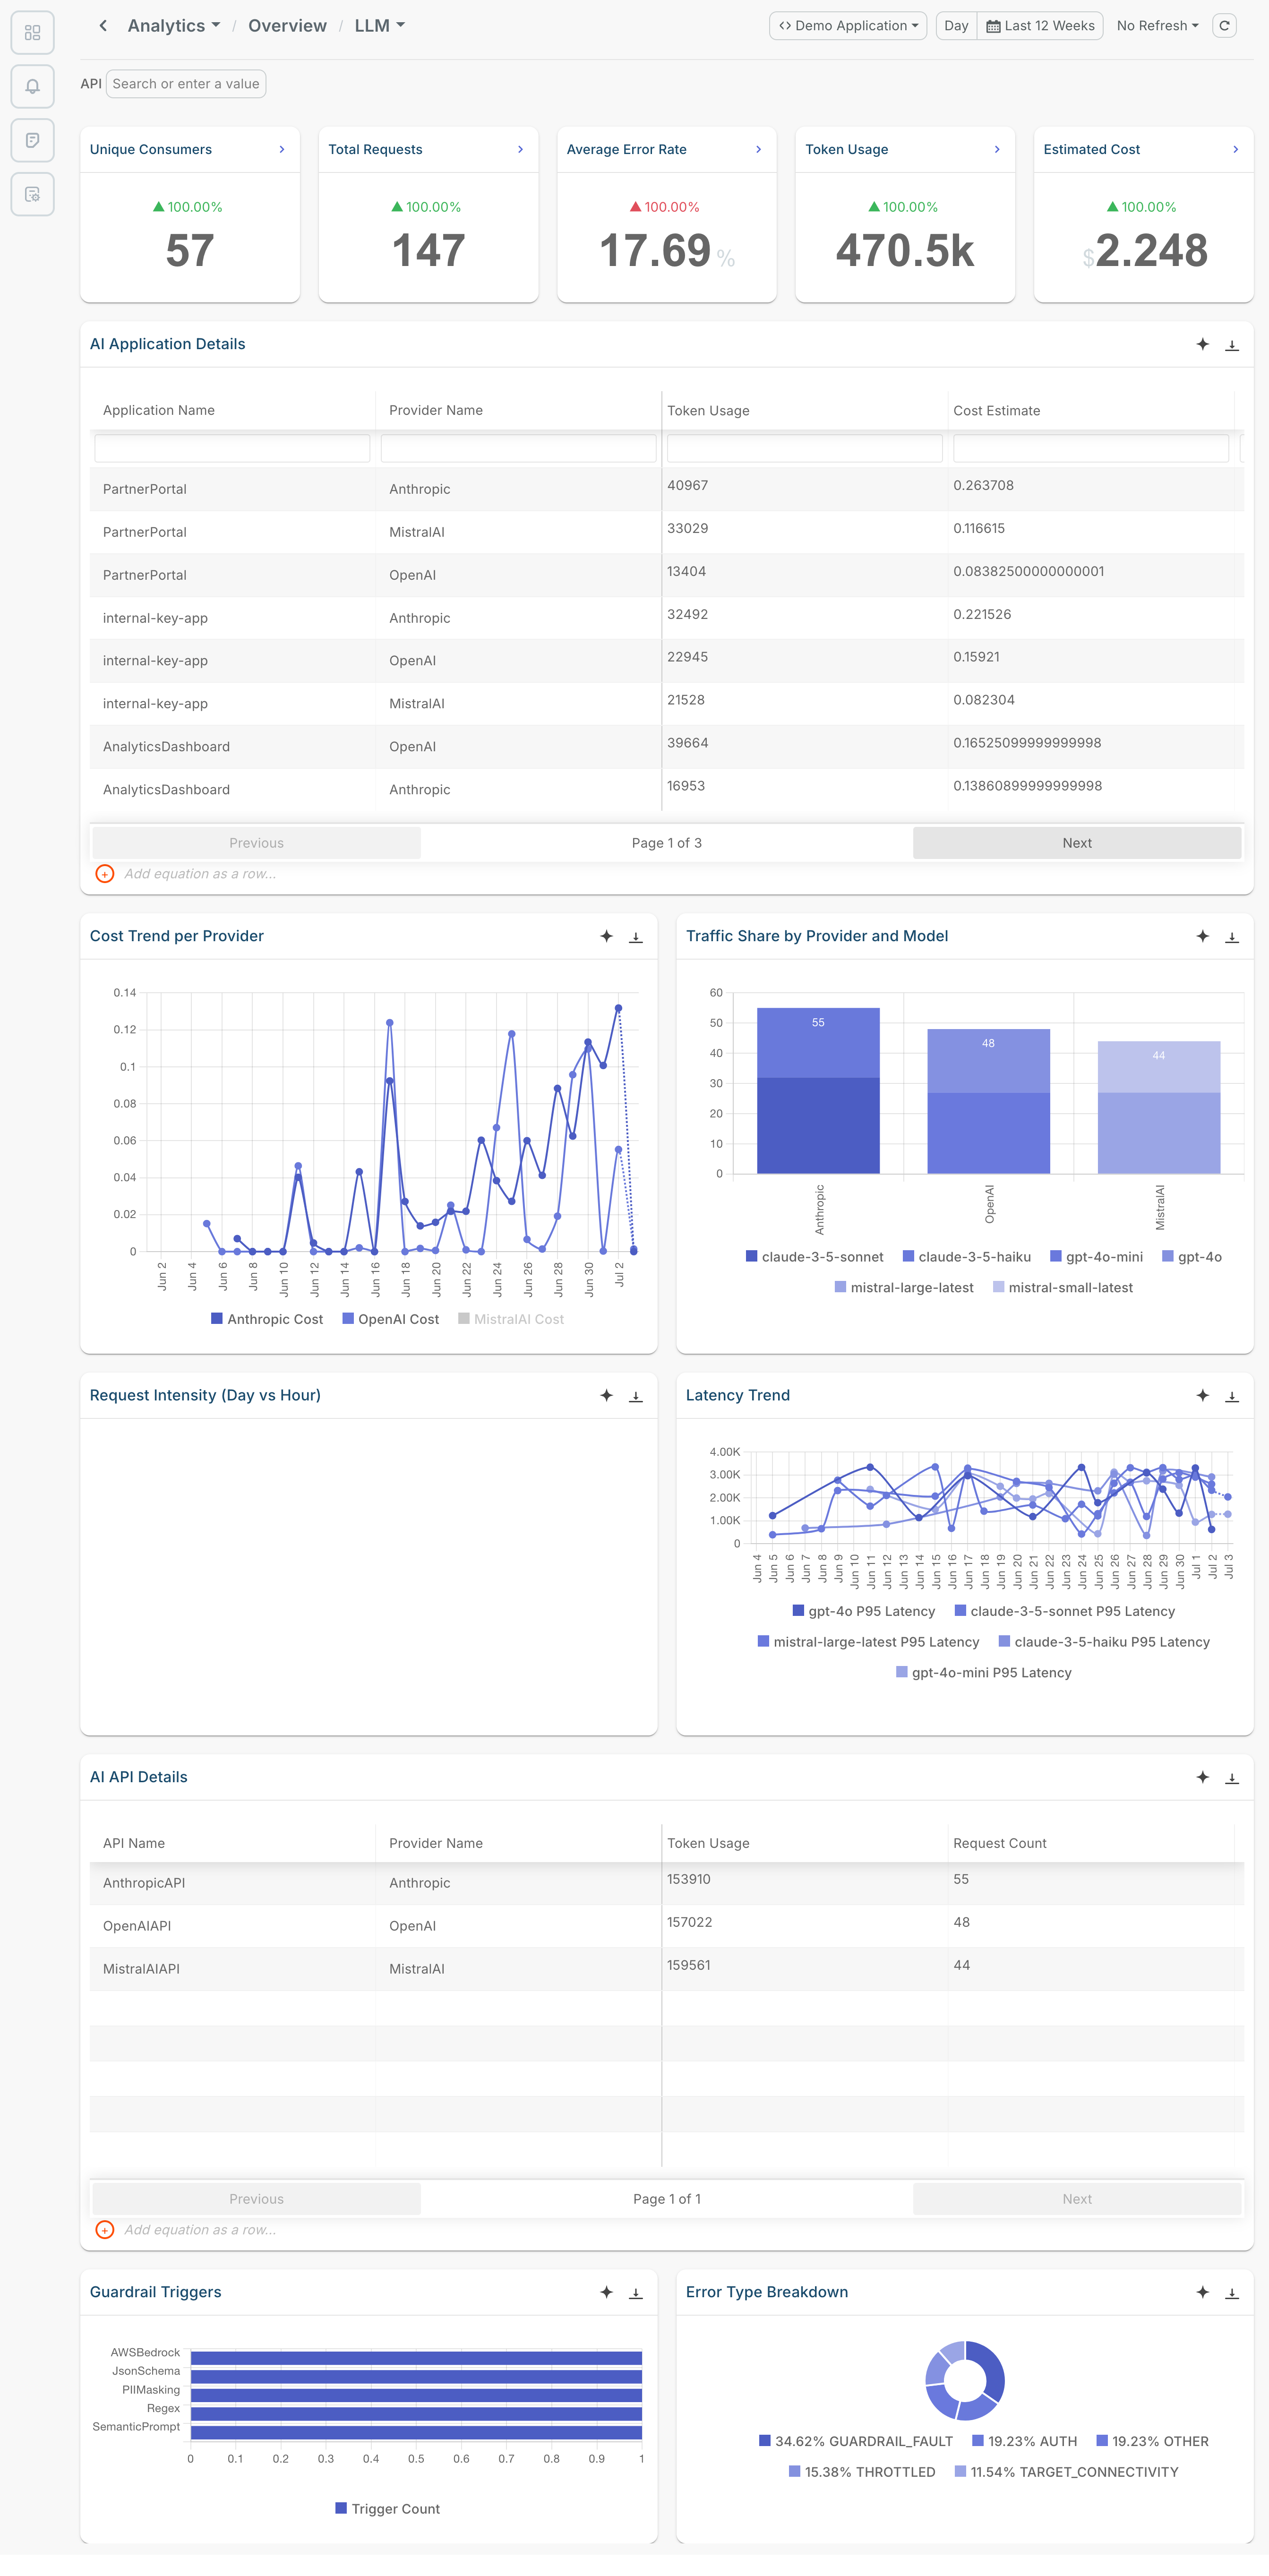
- Unique consumers
- Total requests
- Average error rate
- Token usage
- Estimated cost
- AI application details
- Cost trend per LLM provider
- Traffic share by LLM provider and model
- Request intensity across hourly intervals each day
- Latency trend
- AI API details
- Guardrail trigger statistics
- Error type breakdown
MCP Analytics
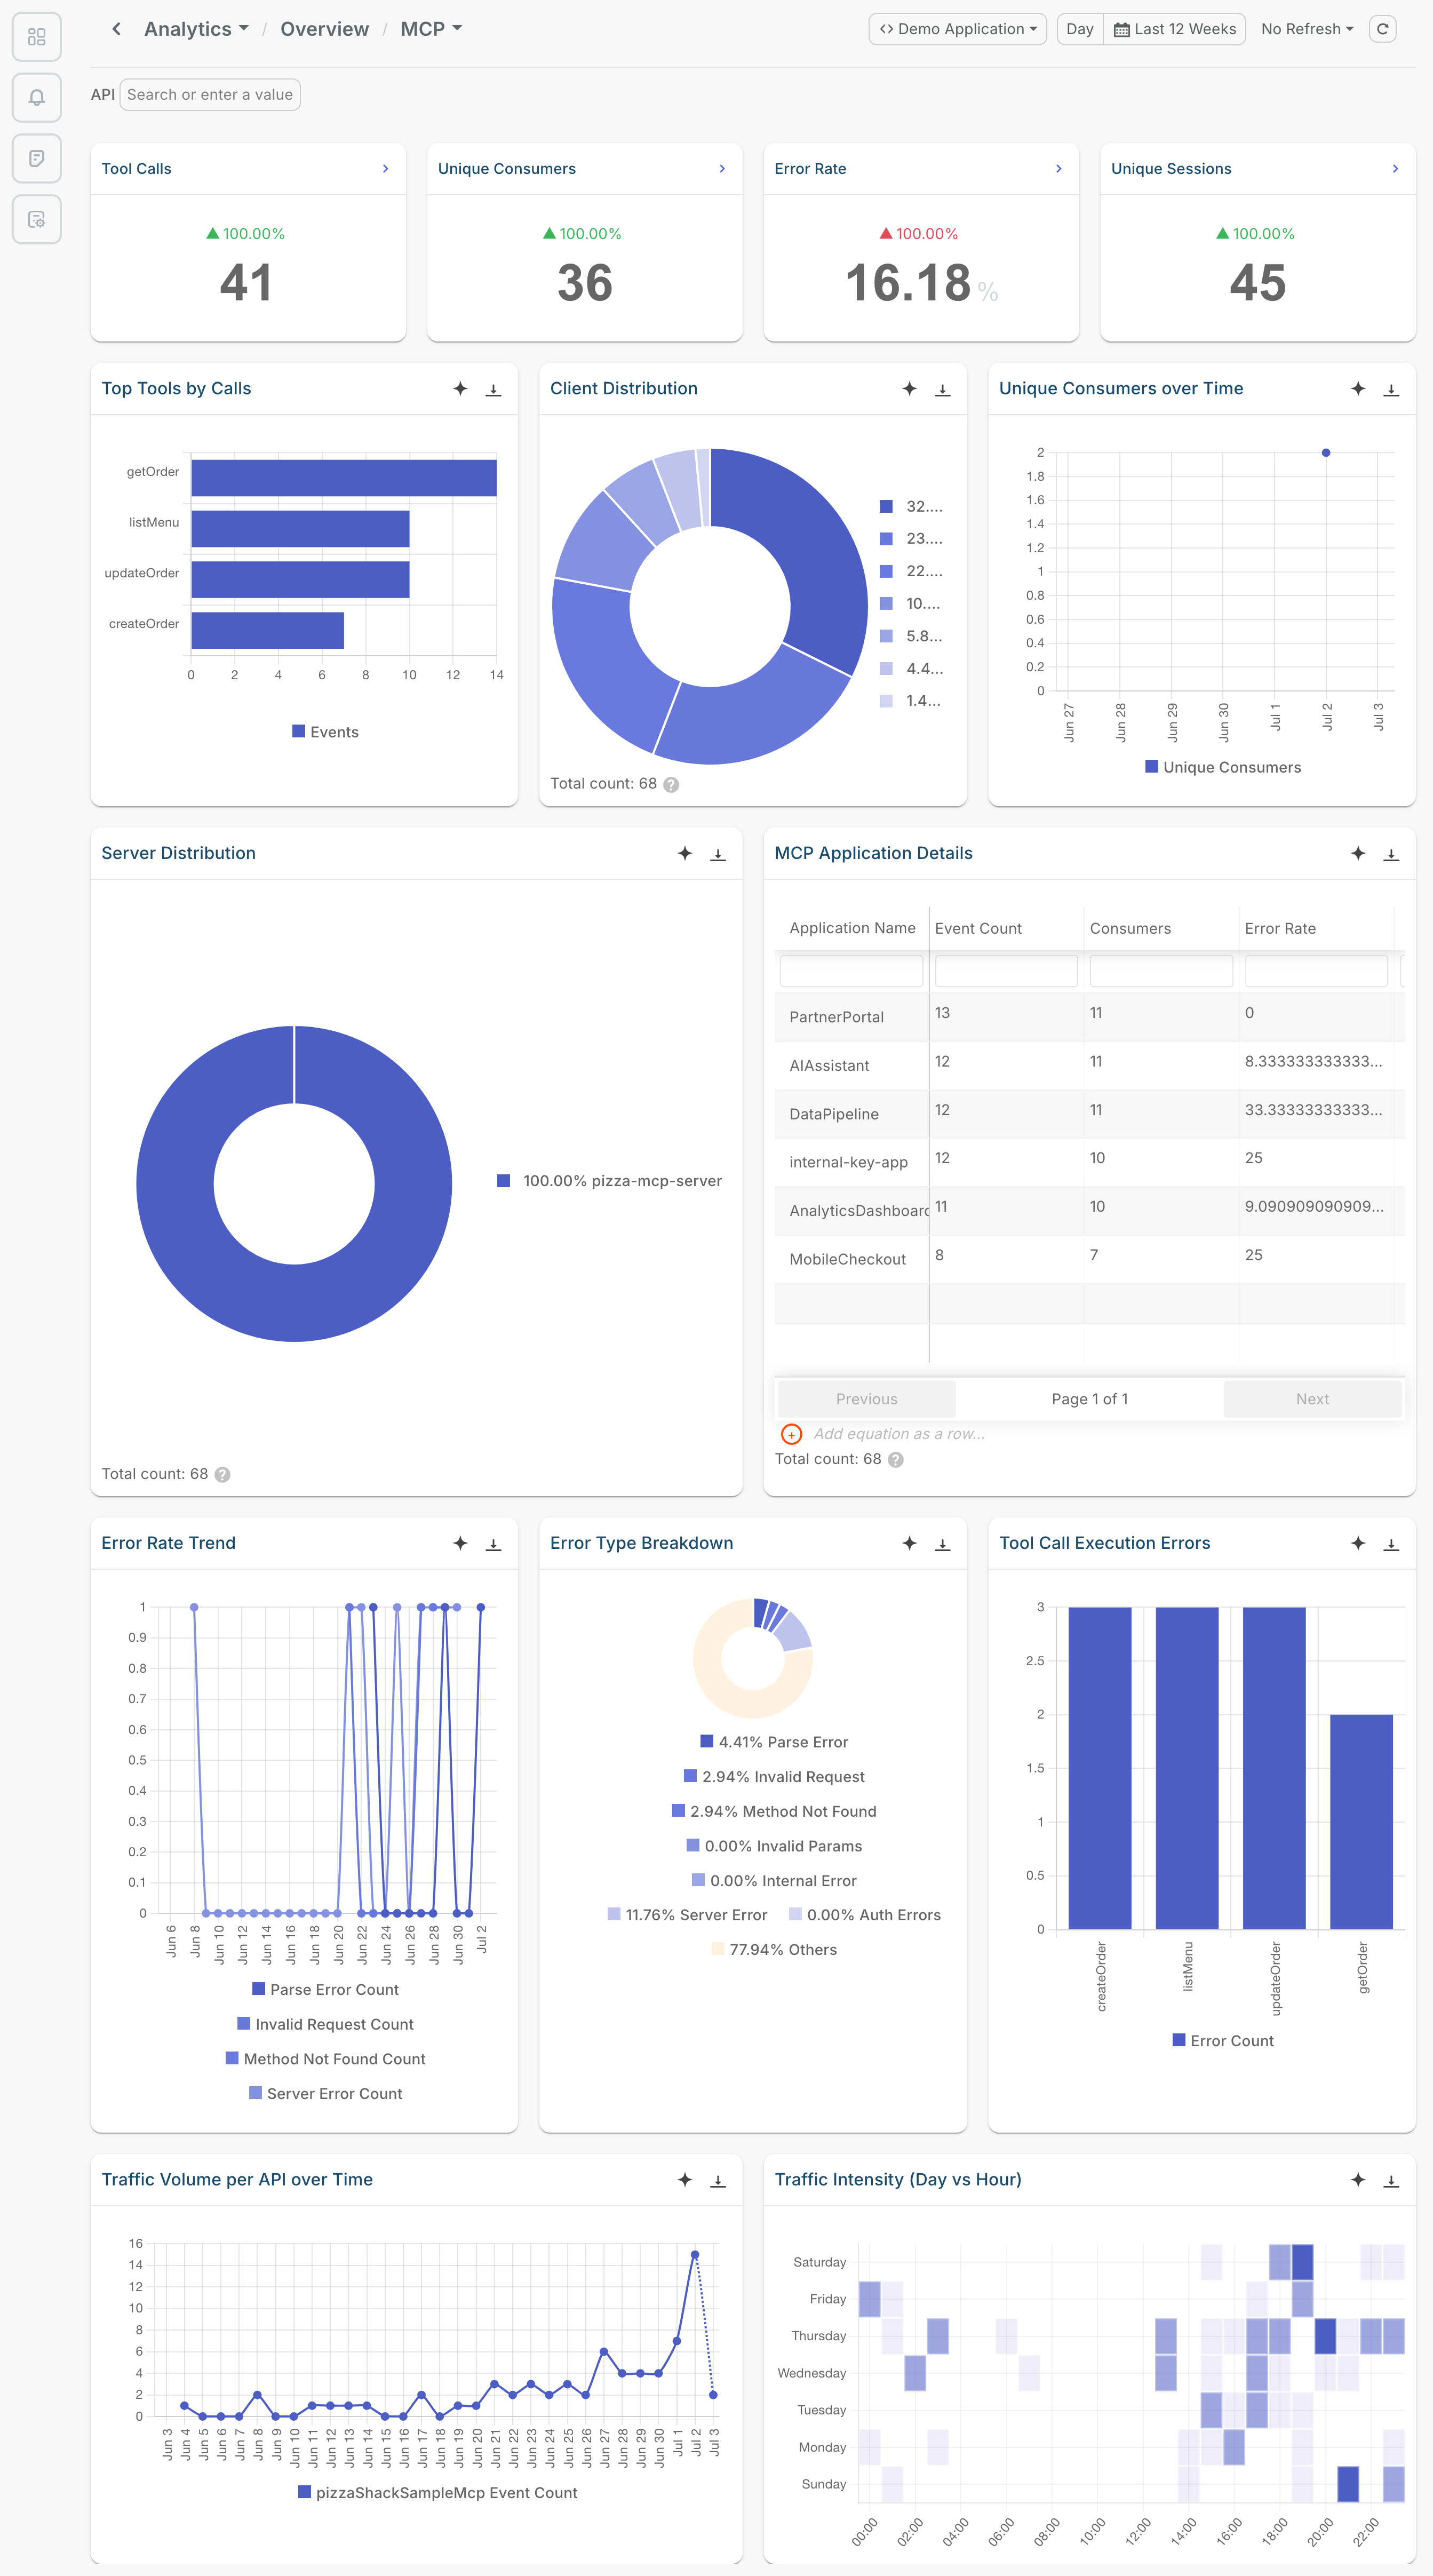
- Tool calls
- Unique consumers
- Error rate
- Unique sessions
- Top tools by calls
- Client distribution
- Unique consumers over time
- Server traffic distribution
- MCP application details
- Error rate trend
- Error type breakdown
- Tool call execution errors
- Traffic volume per API over time
- Traffic intensity across hourly intervals each day
Next Steps
- Visit Moesif documentation.
- Get familiar with Metered Billing.
- Learn to set up real-time Dashboards to build custom analytics views for your API traffic.