Cost Insights
Overview
Note
Cost Optimization is available under the Platform Engineer persona. To access it, switch to the Platform Engineer persona.
The Devant cost optimization feature provides detailed cost insights across your organization, enabling you to analyze resource utilization and cost efficiency at the Organization, Project, and Integration levels. The dashboards provide comprehensive visualizations and actionable recommendations to optimize cloud infrastructure costs while maintaining performance.
All metrics, visualizations, and analytics displayed across the Organization, Project, and Integration levels reflect data for the current month, from the first day up to the current date. This provides you with up-to-date insights into your resource utilization and cost efficiency. Monthly figures show the accumulated data for the current month so far, while comparisons to the previous month are also available in some metrics. This approach gives you both immediate visibility into current spending patterns and an understanding of the trend compared to last month for optimization decisions.
You can use this information to track ongoing cost optimization efforts and make timely adjustments to your resource allocations during the current billing cycle.
Organization Level
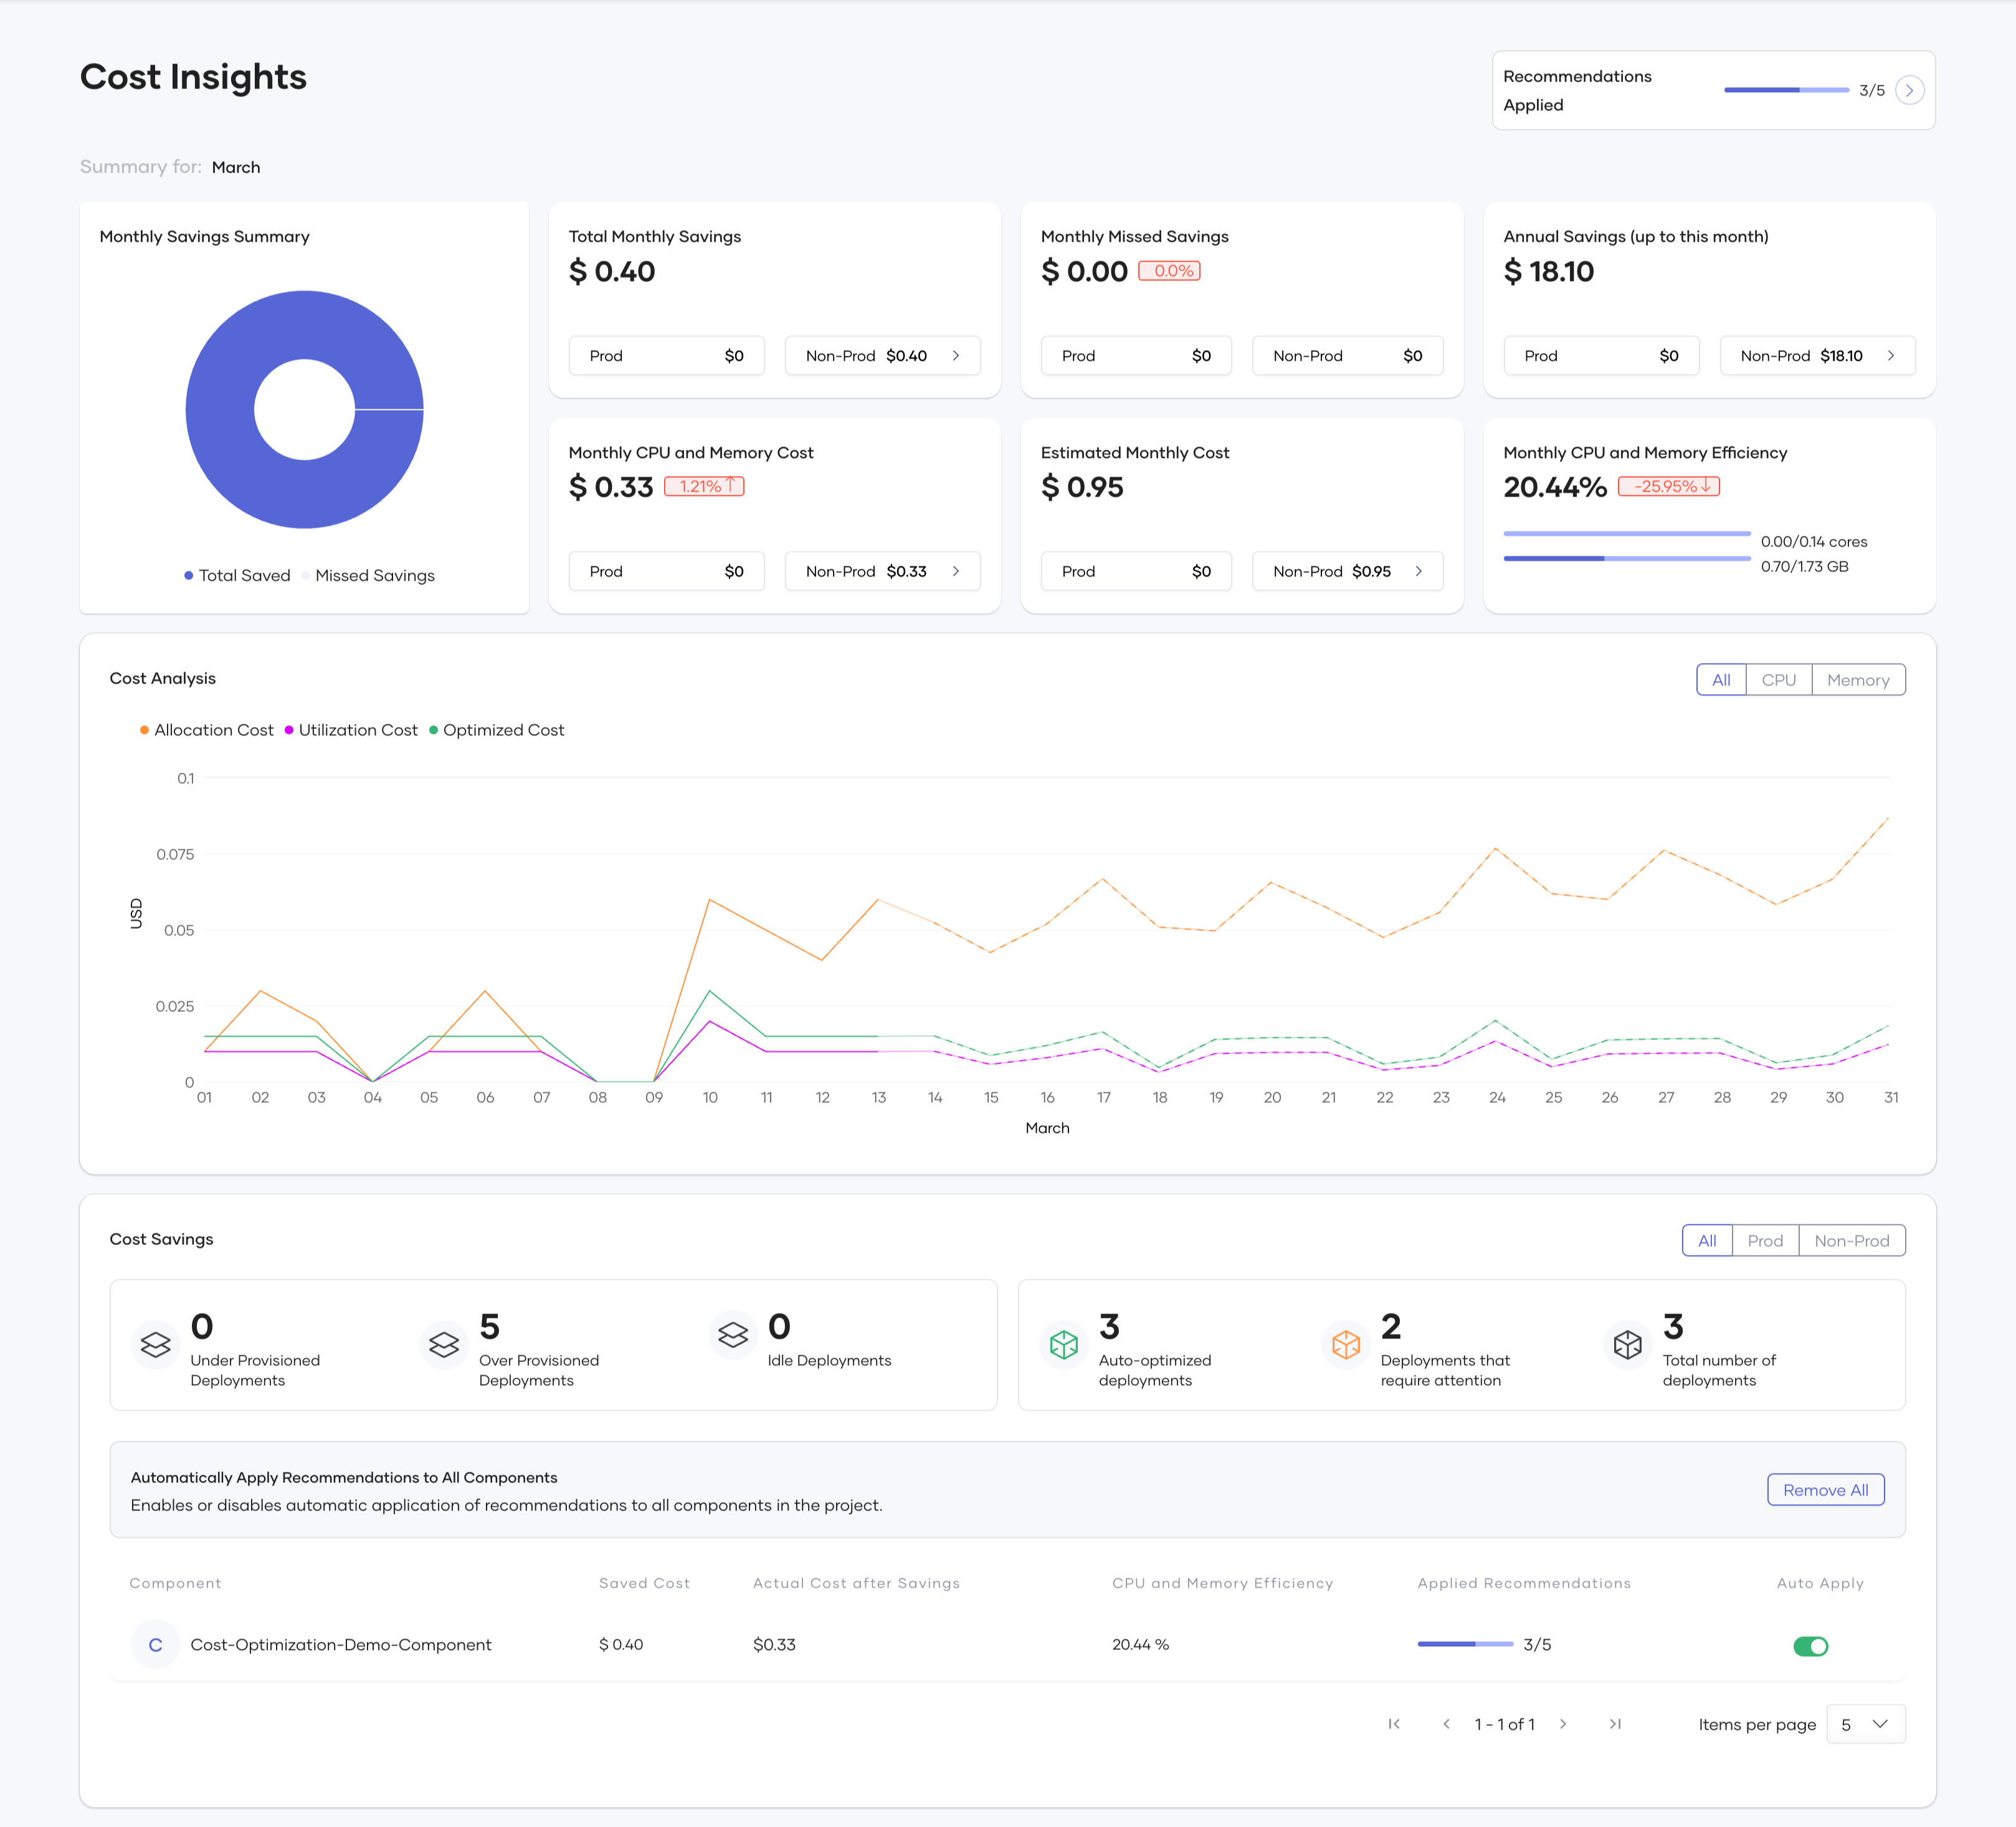
At the Organization level, Devant provides key insights into overall cost savings and resource efficiency across all your projects. You can view the following metrics and visualizations:
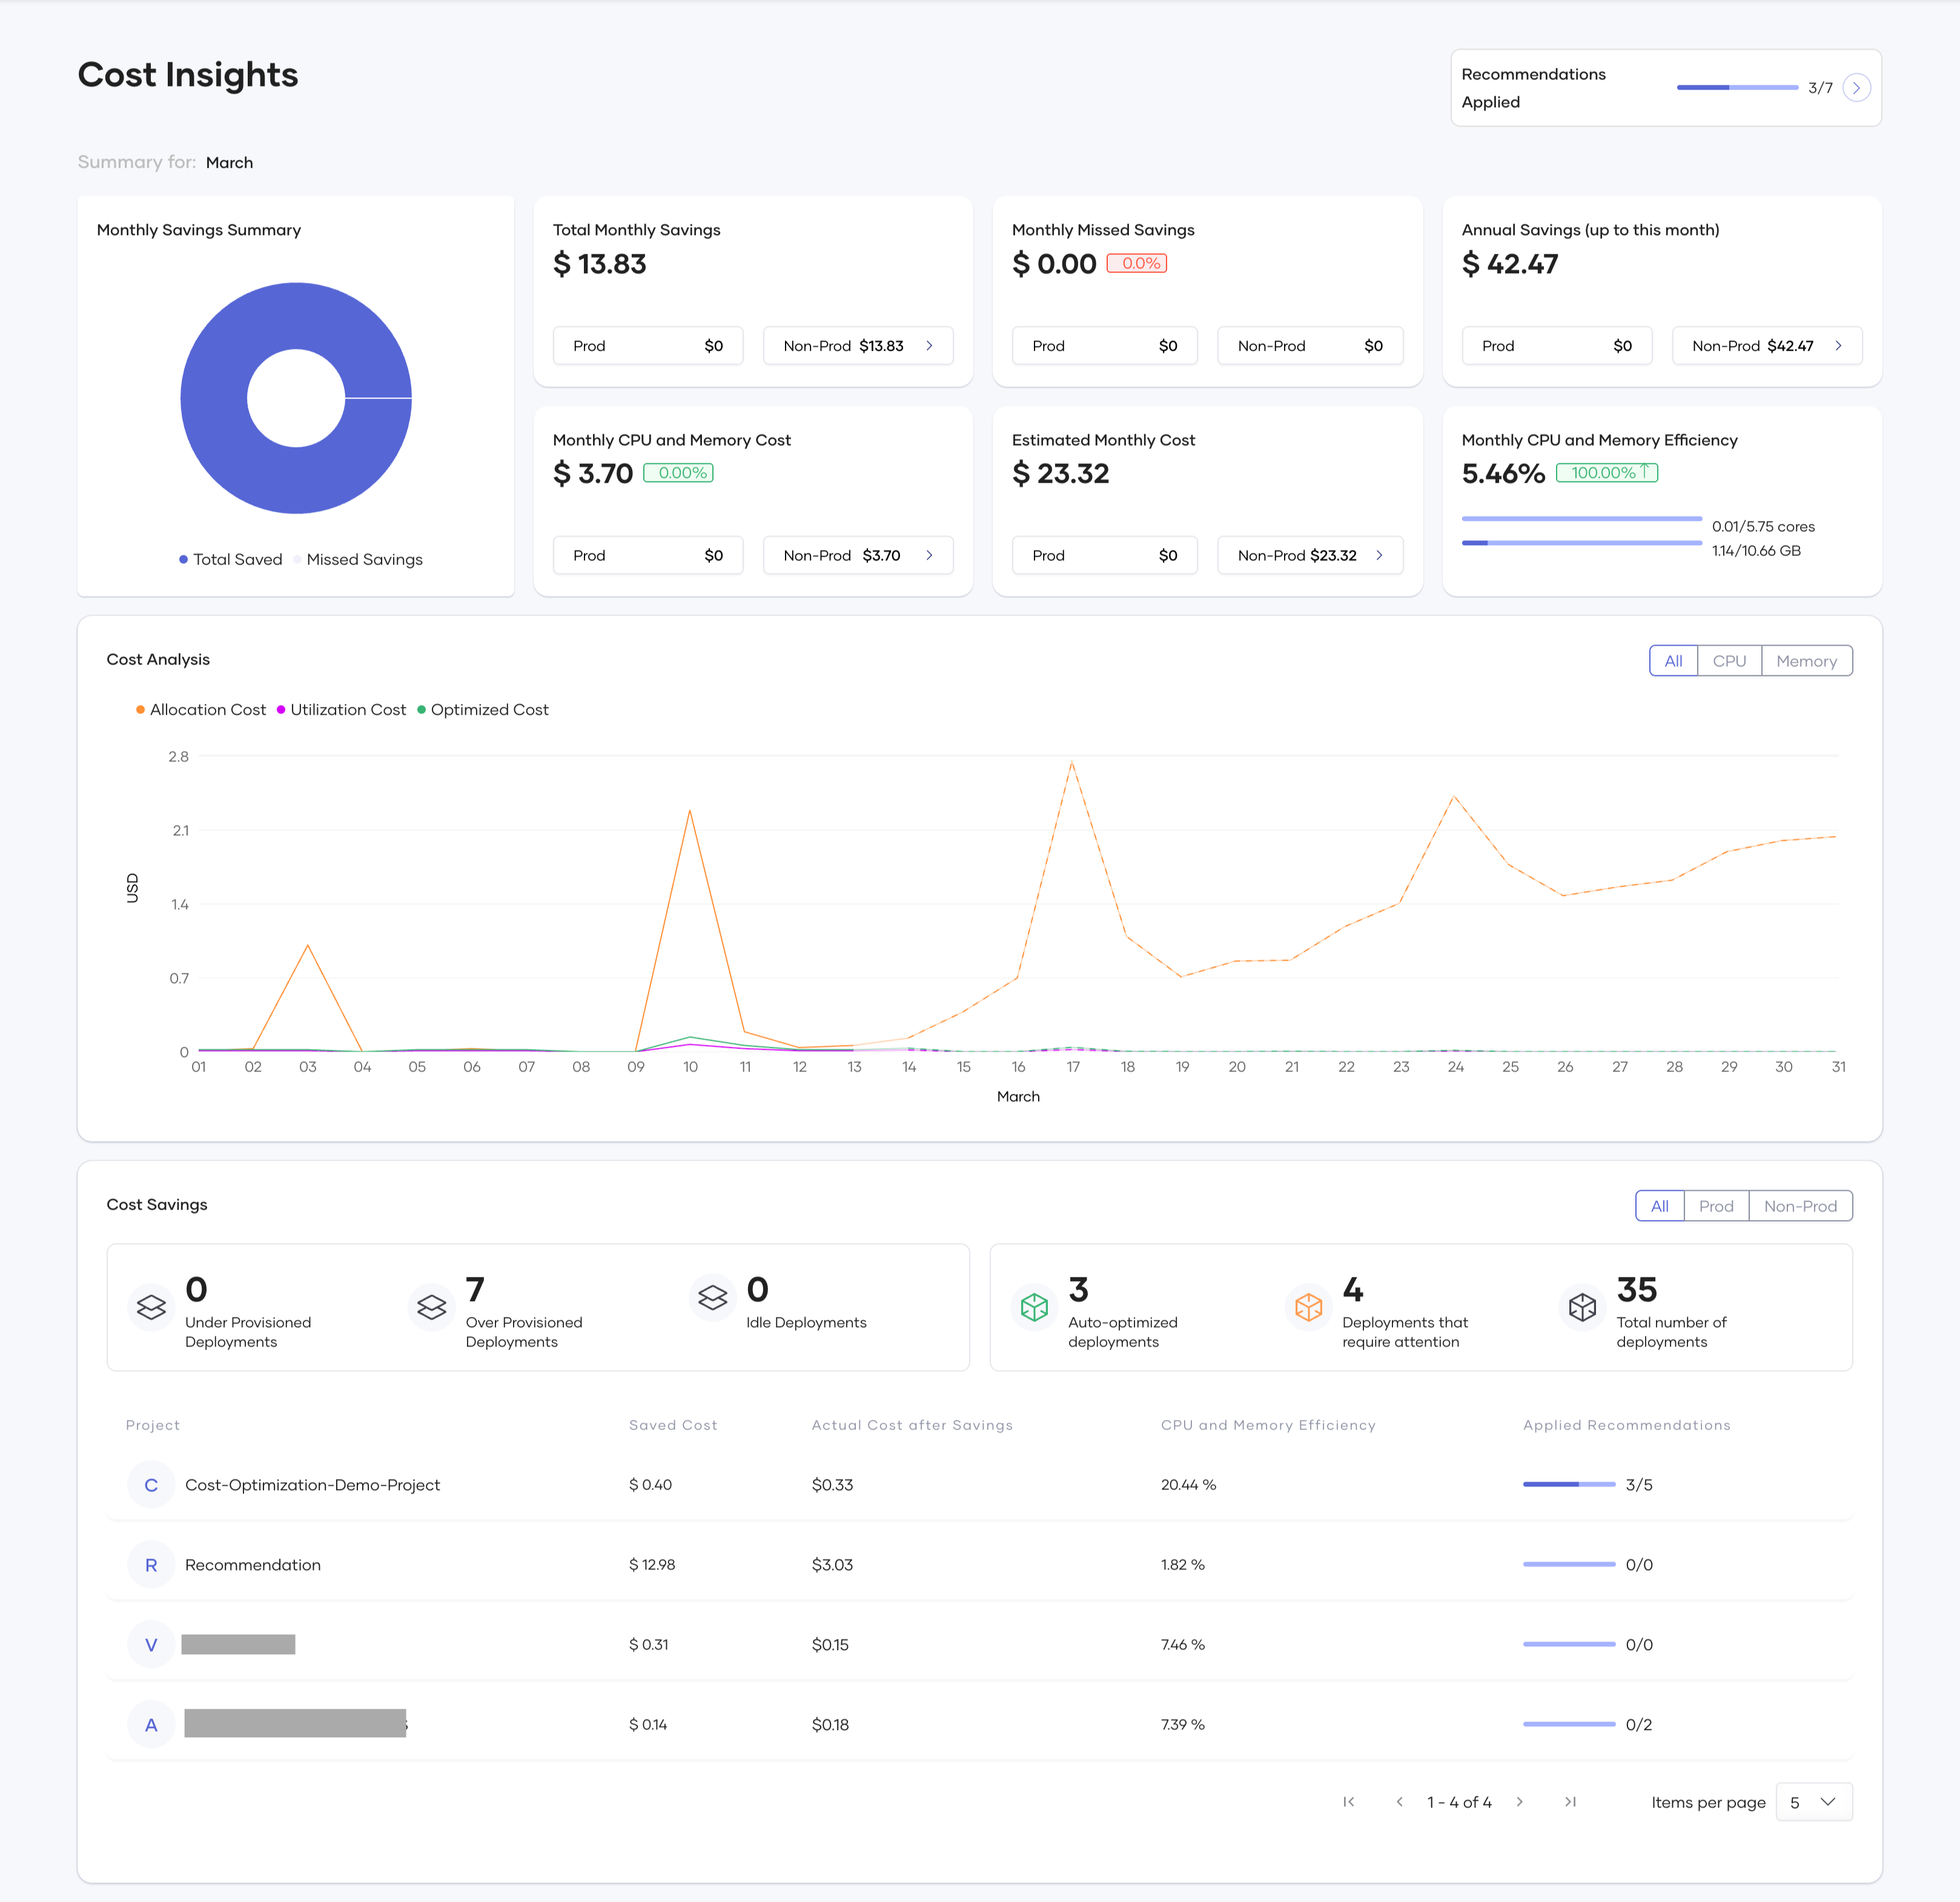
- Monthly Savings Summary
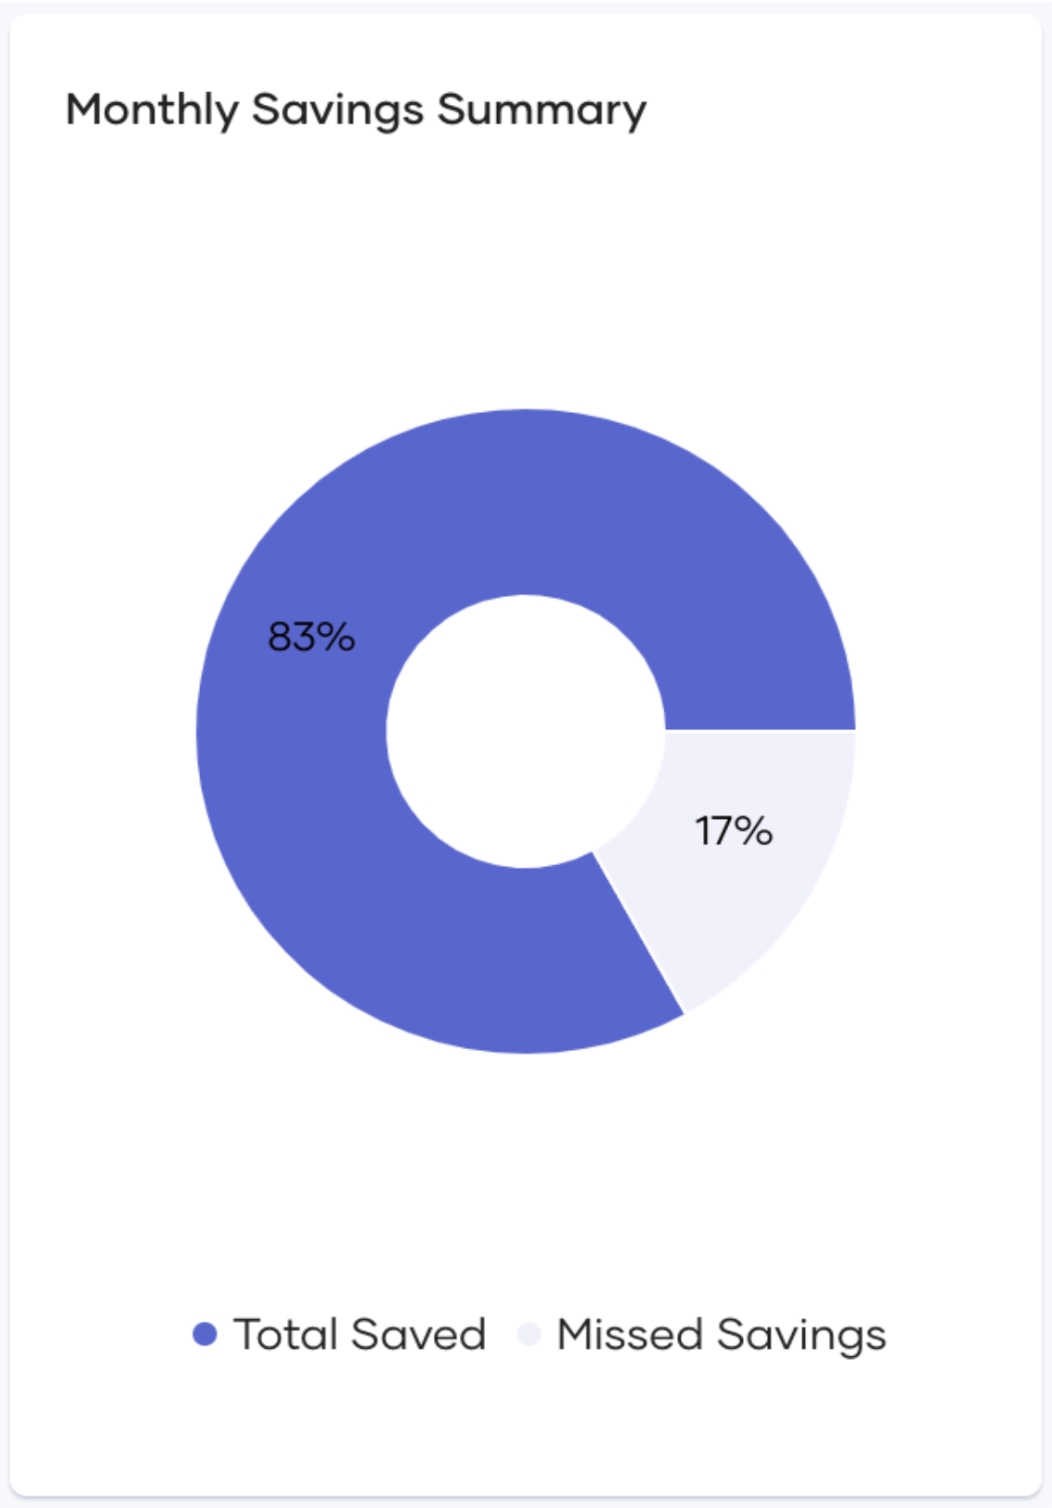
This chart visualizes the percentage of cost savings achieved (by manual or automated application of recommendations) compared to missed savings (potential savings missed due to recommendations not being applied) up to the current date. You should aim to maximize the saved cost and minimize missed savings.
- Total Monthly Savings
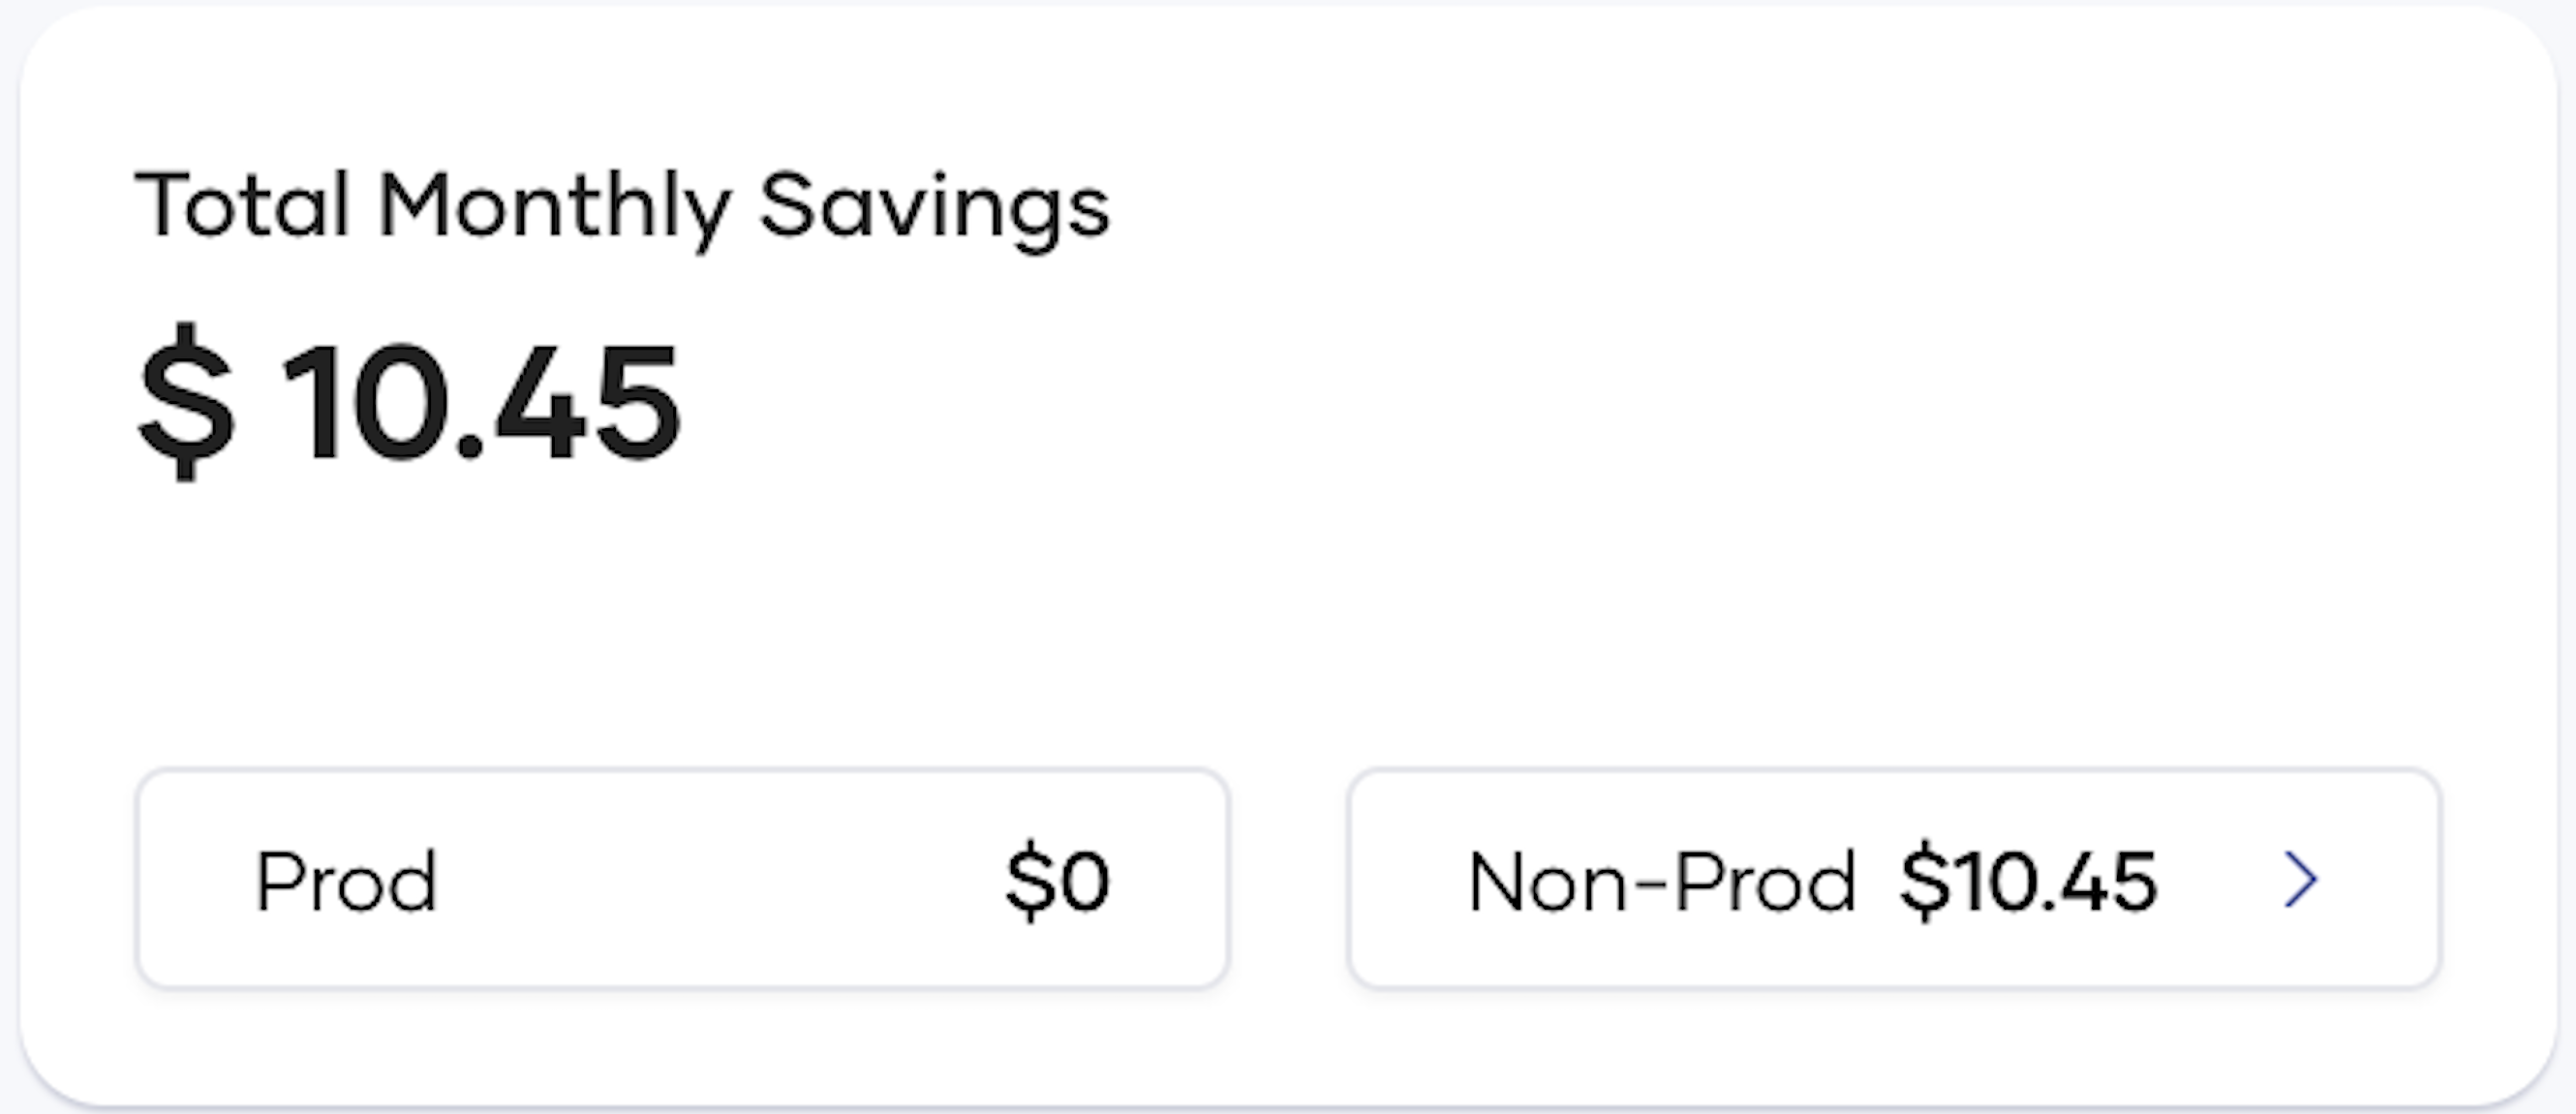
This card shows the cost savings in the current month from the manual or automatic application of recommendations. It includes a breakdown for Production and Non-Production environments, with a dropdown that shows savings for each environment.
- Monthly Missed Savings
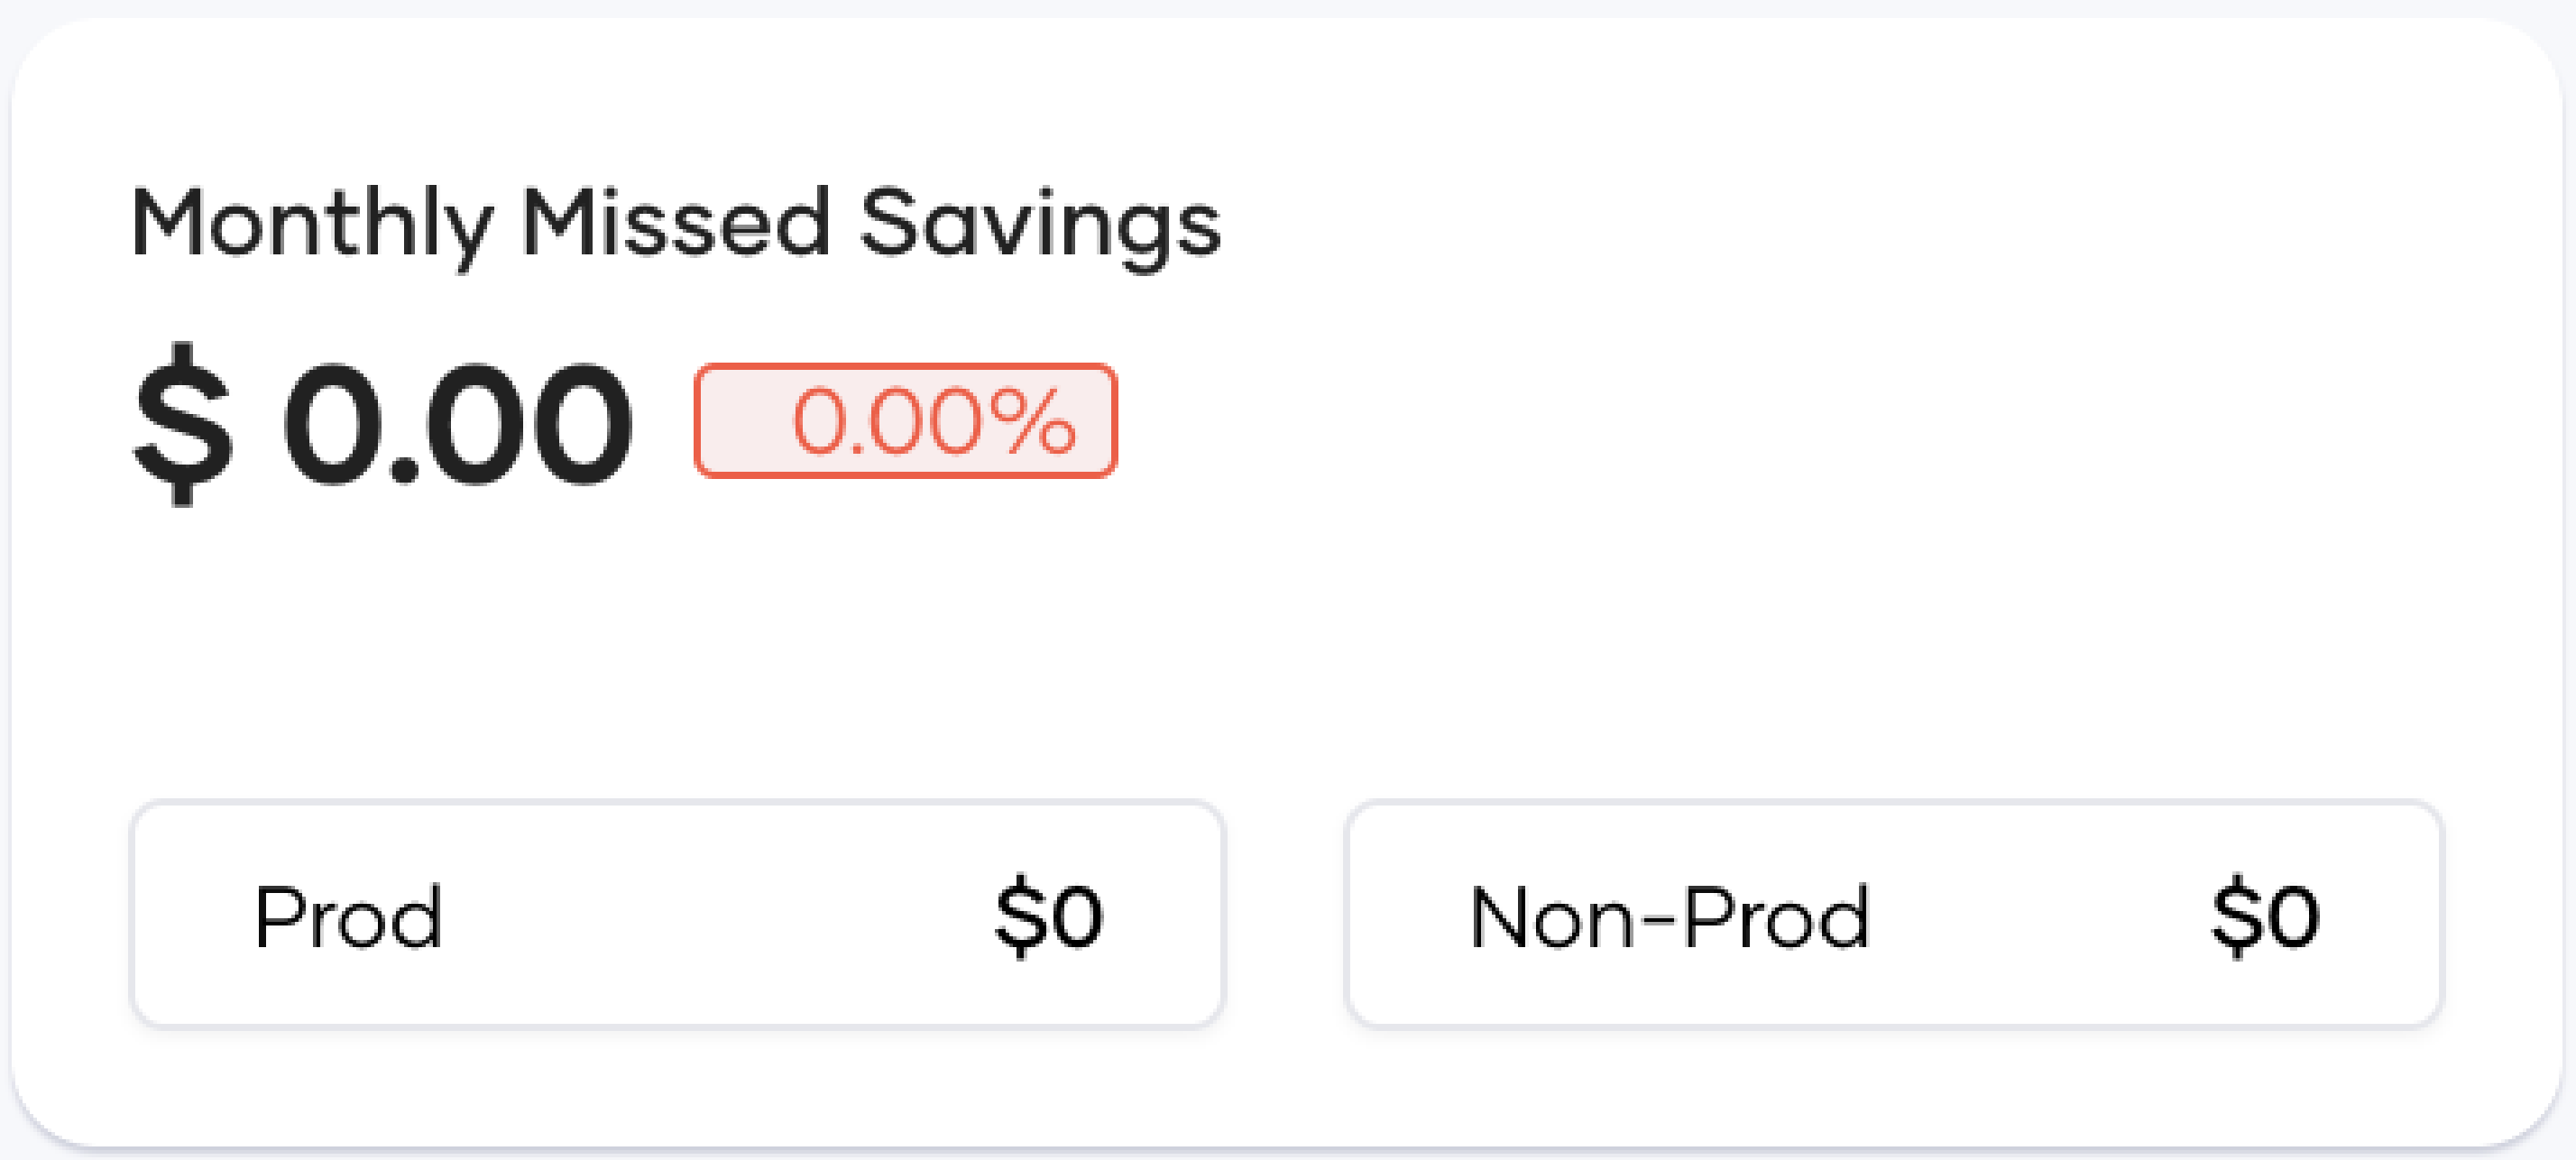
This card displays the potential cost savings that were missed due to the failure to apply recommendations, whether manually or automatically. It provides a breakdown of these missed savings for both production and non-production environments, listing values for each individual environment. It is recommended to keep these missed savings as minimal as possible.
-
Annual Savings
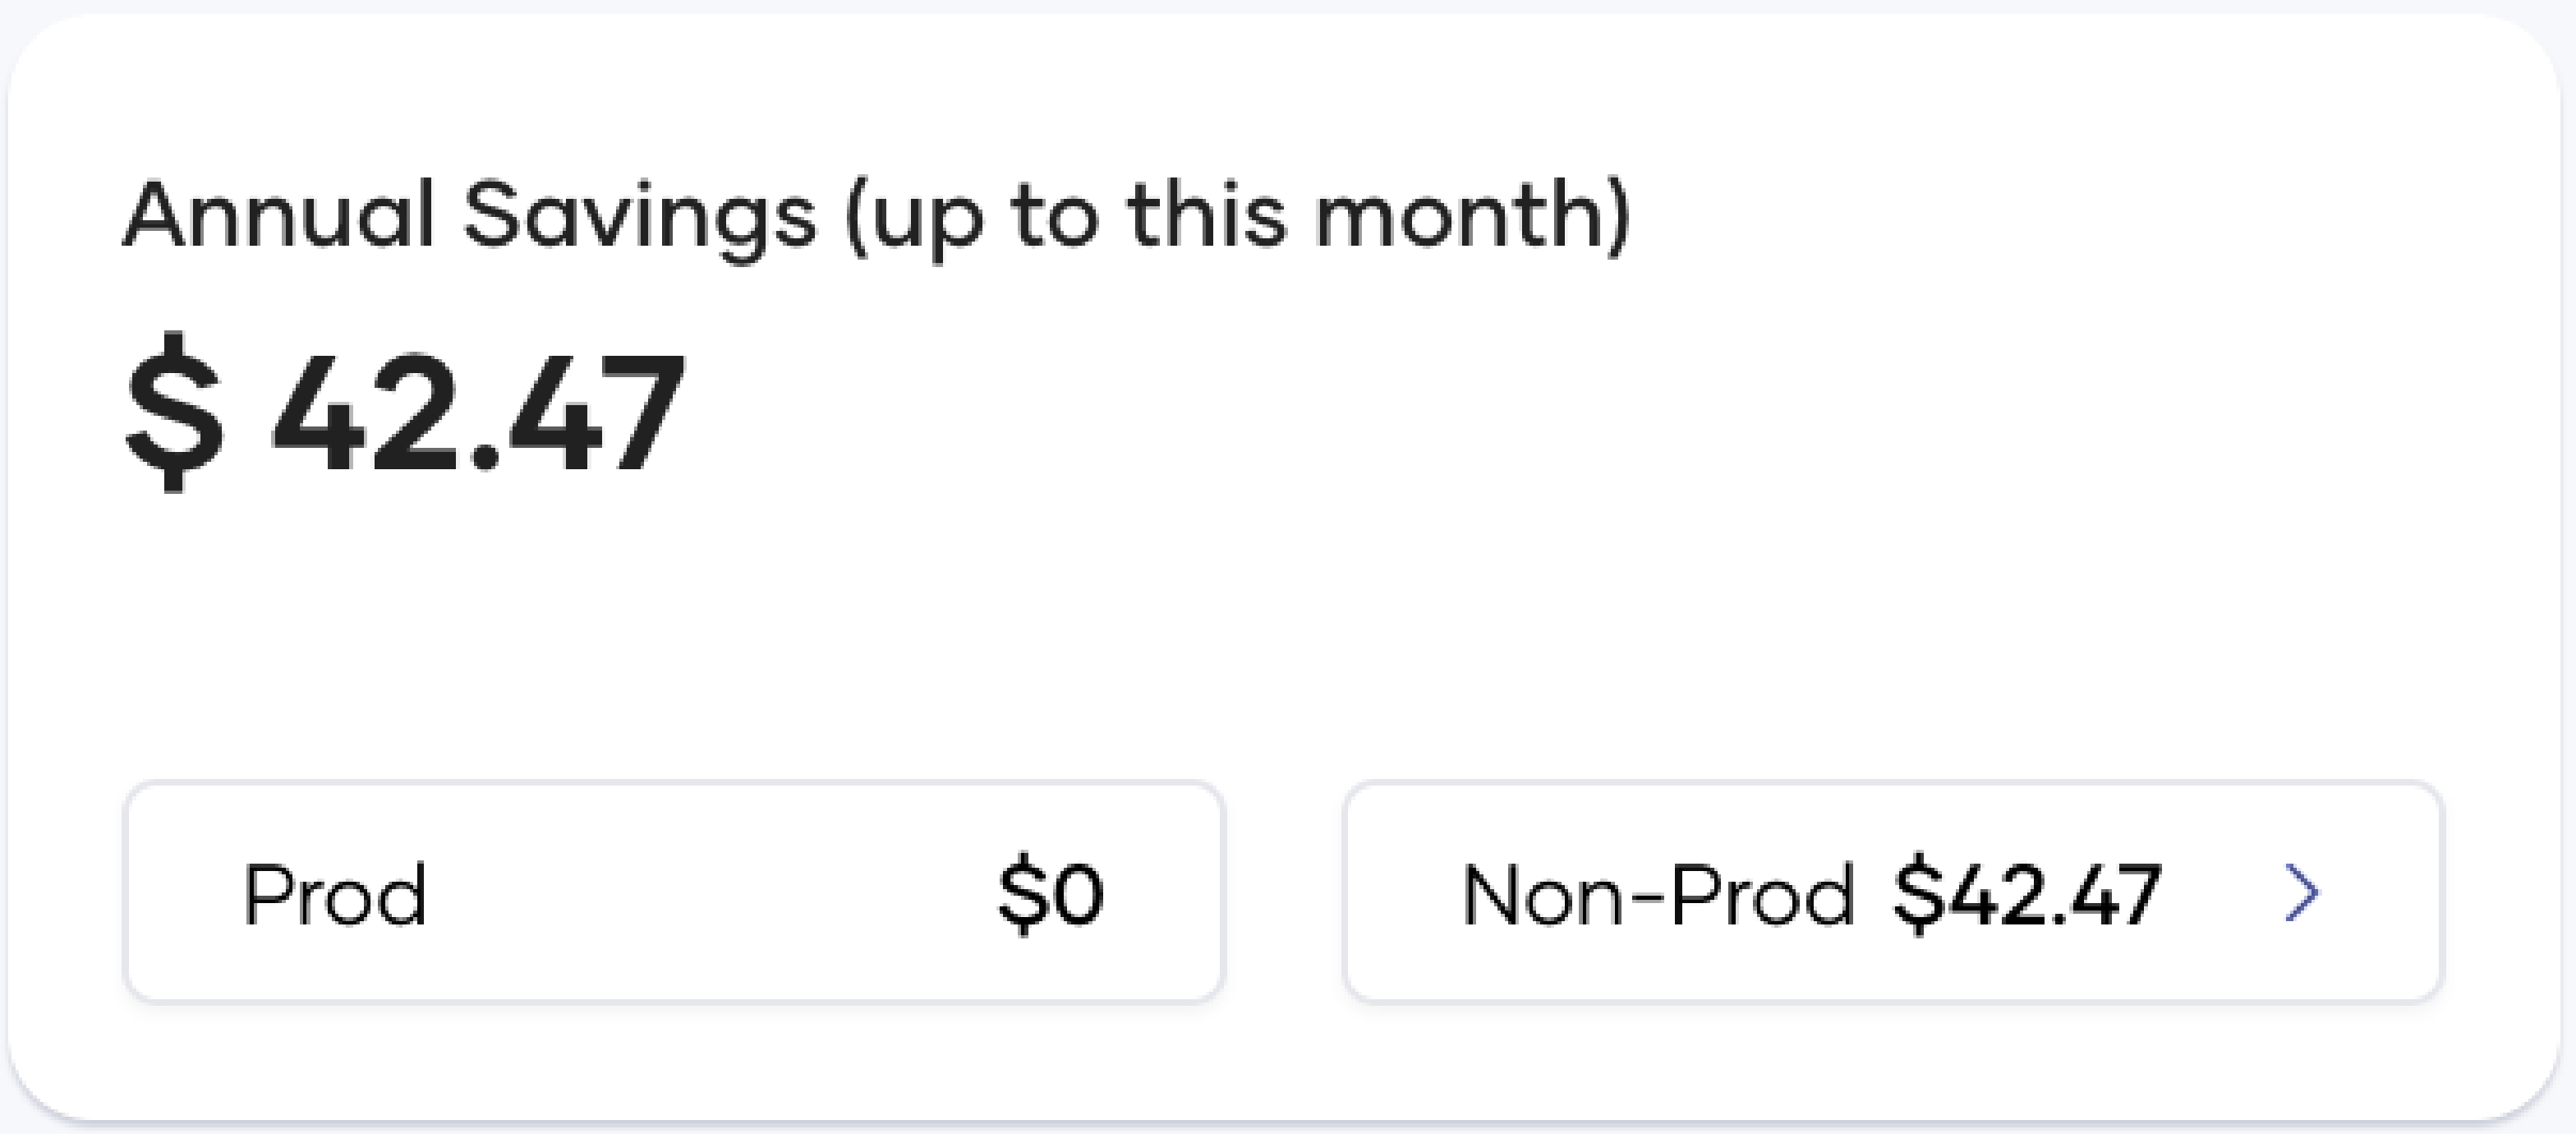
This card shows accumulated savings throughout the year. It combines savings completed through the end of the previous month with those achieved up to the current day of the current month. This demonstrates that a fully cost-optimized organization with no savings for the current month has achieved this state by saving costs in previous months.
- Monthly CPU and Memory Cost
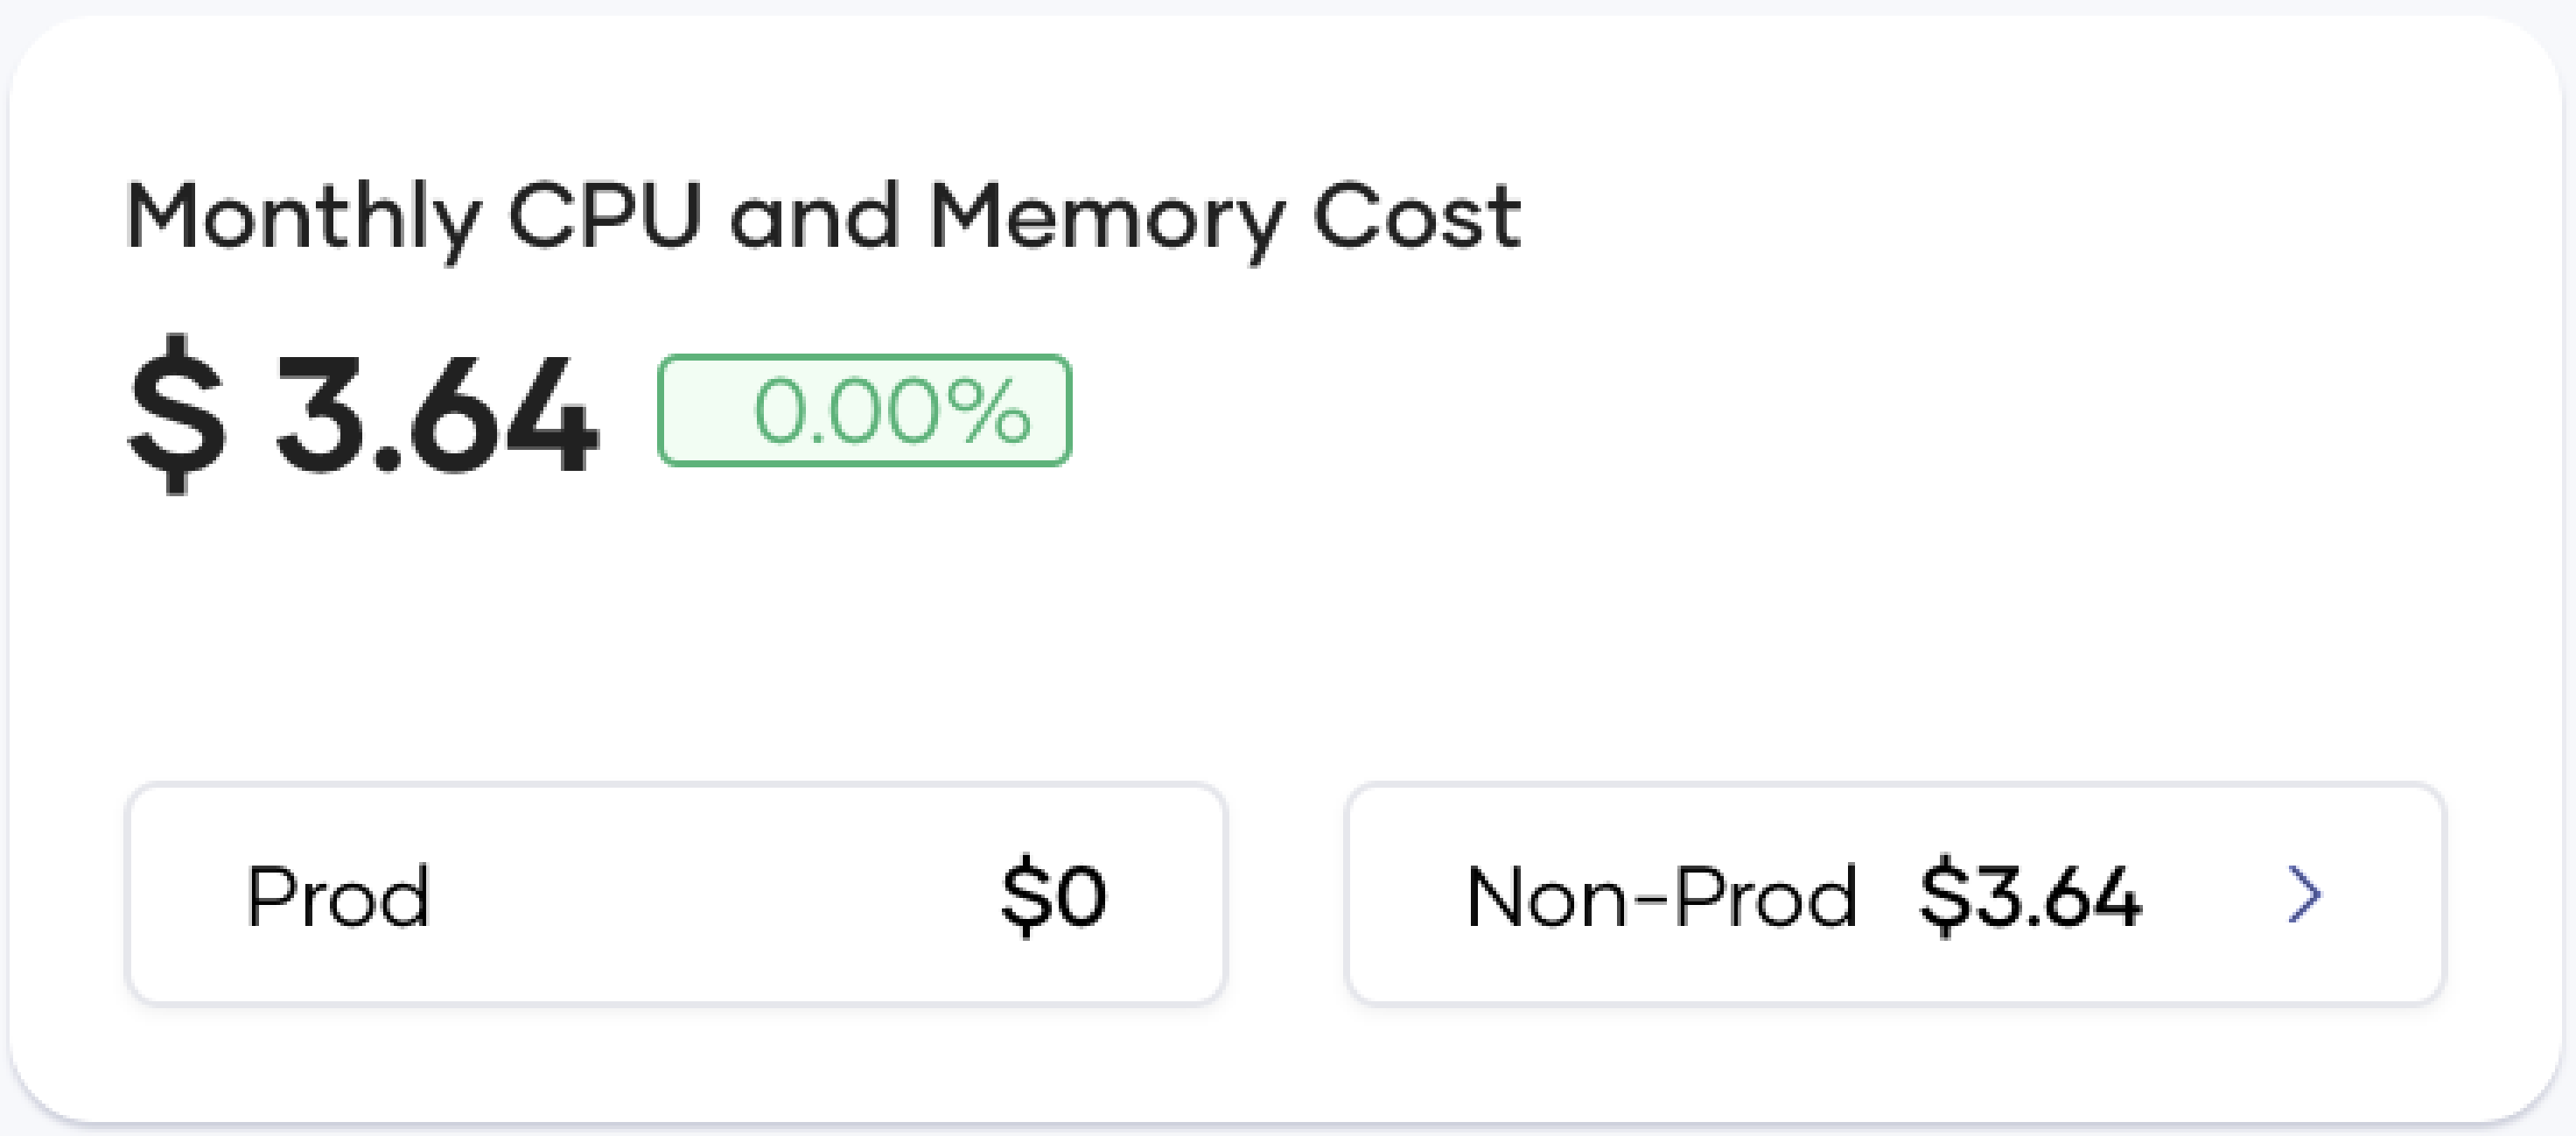
This card shows the cost incurred for CPU and Memory allocation across all integrations in your organization. It includes a percentage change compared to the previous month to indicate cost trends.
- Estimated Monthly Cost

This card shows the forecasted cost at the end of the month, with an environmental breakdown, regardless of which day of the month you view it.
- Monthly CPU and Memory Efficiency
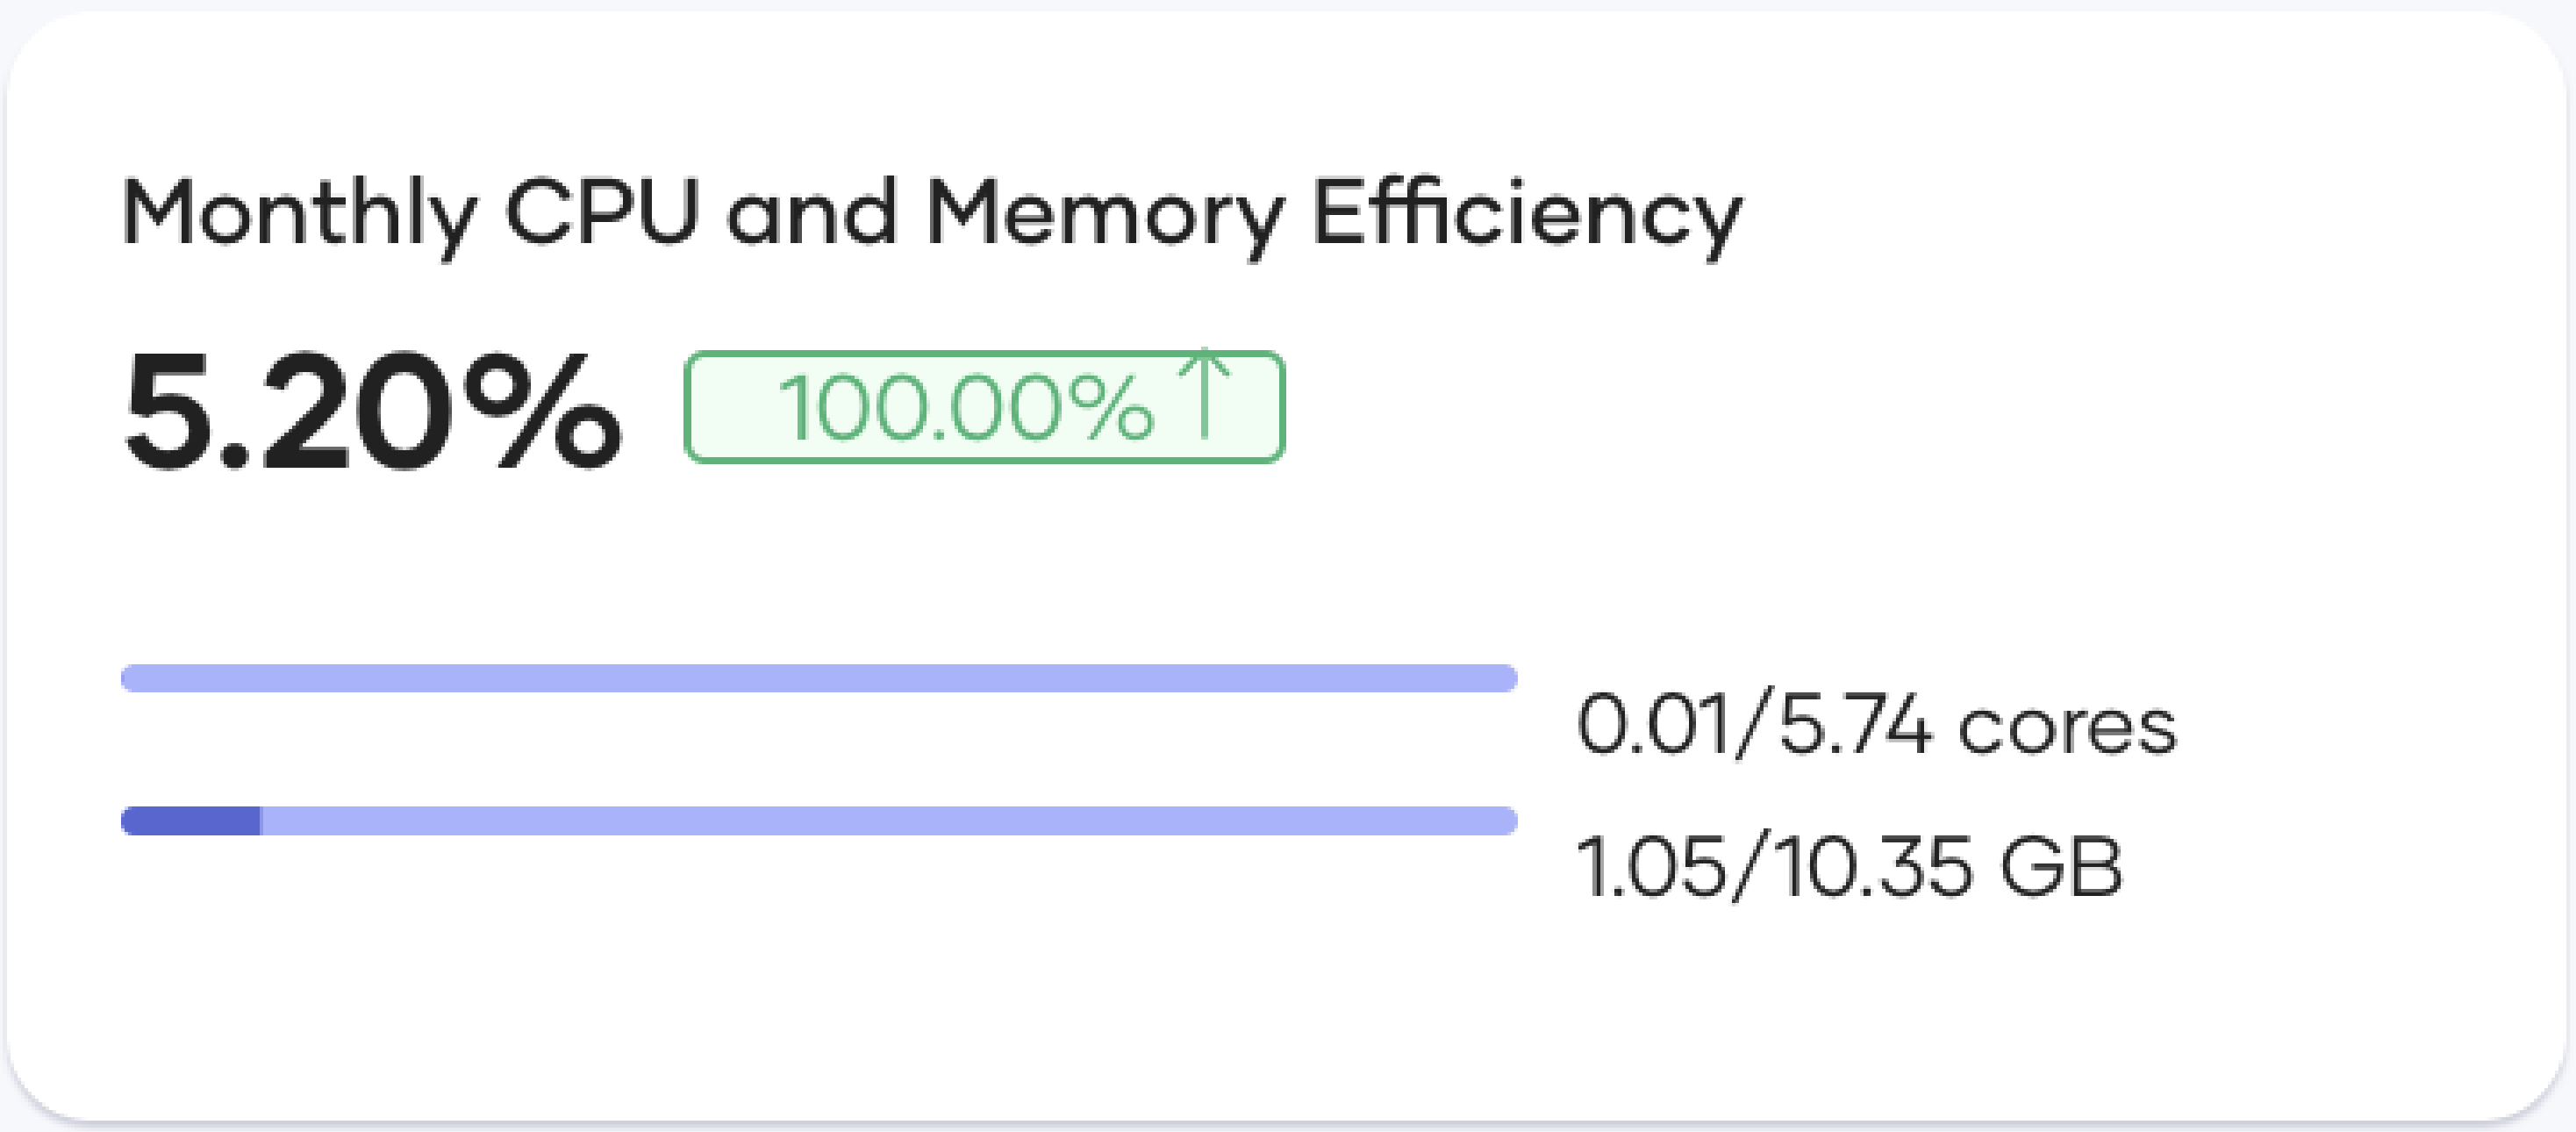
This card shows the percentage utilization of CPU and Memory relative to their allocations. This metric indicates your resource optimization level, which directly reflects cost optimization. The breakdown of CPU and Memory efficiencies provides individual understanding of each resource's optimization. The percentage change shown compares current efficiency with last month's, with an arrow indicating an increase or decrease.
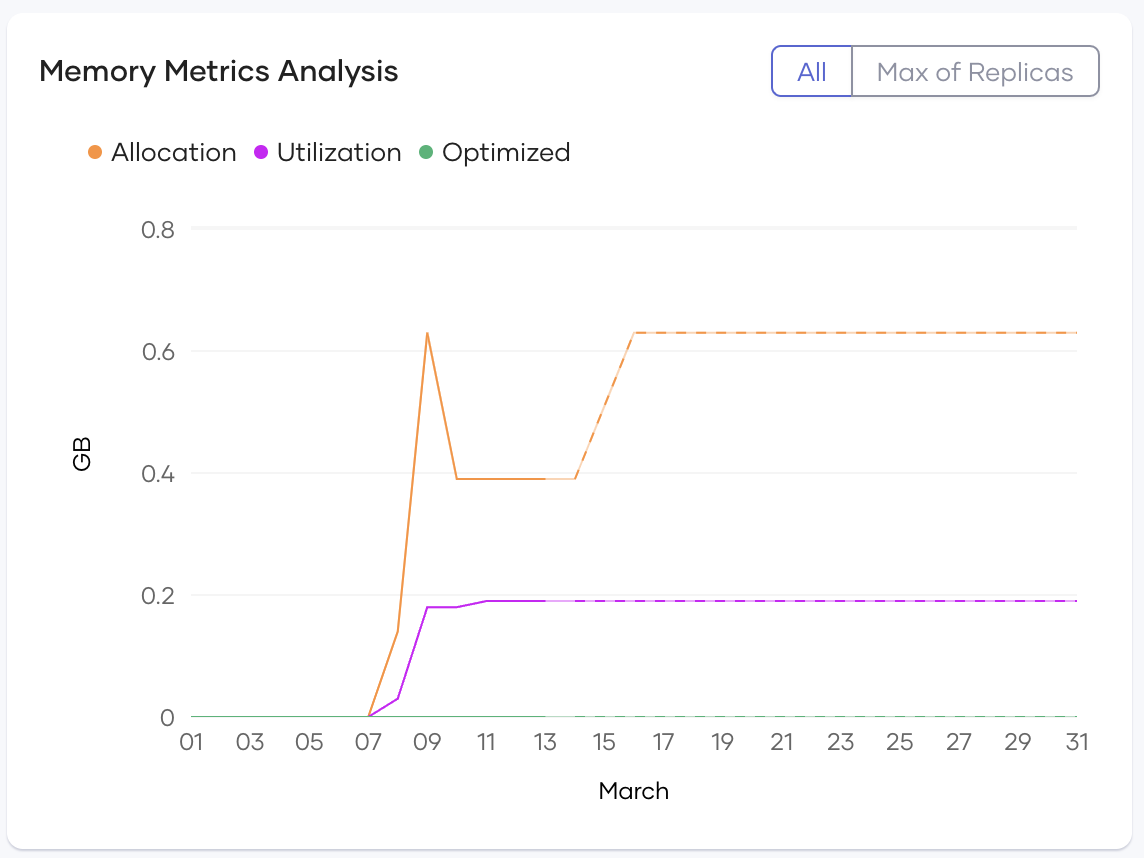
- Cost Analysis Plot
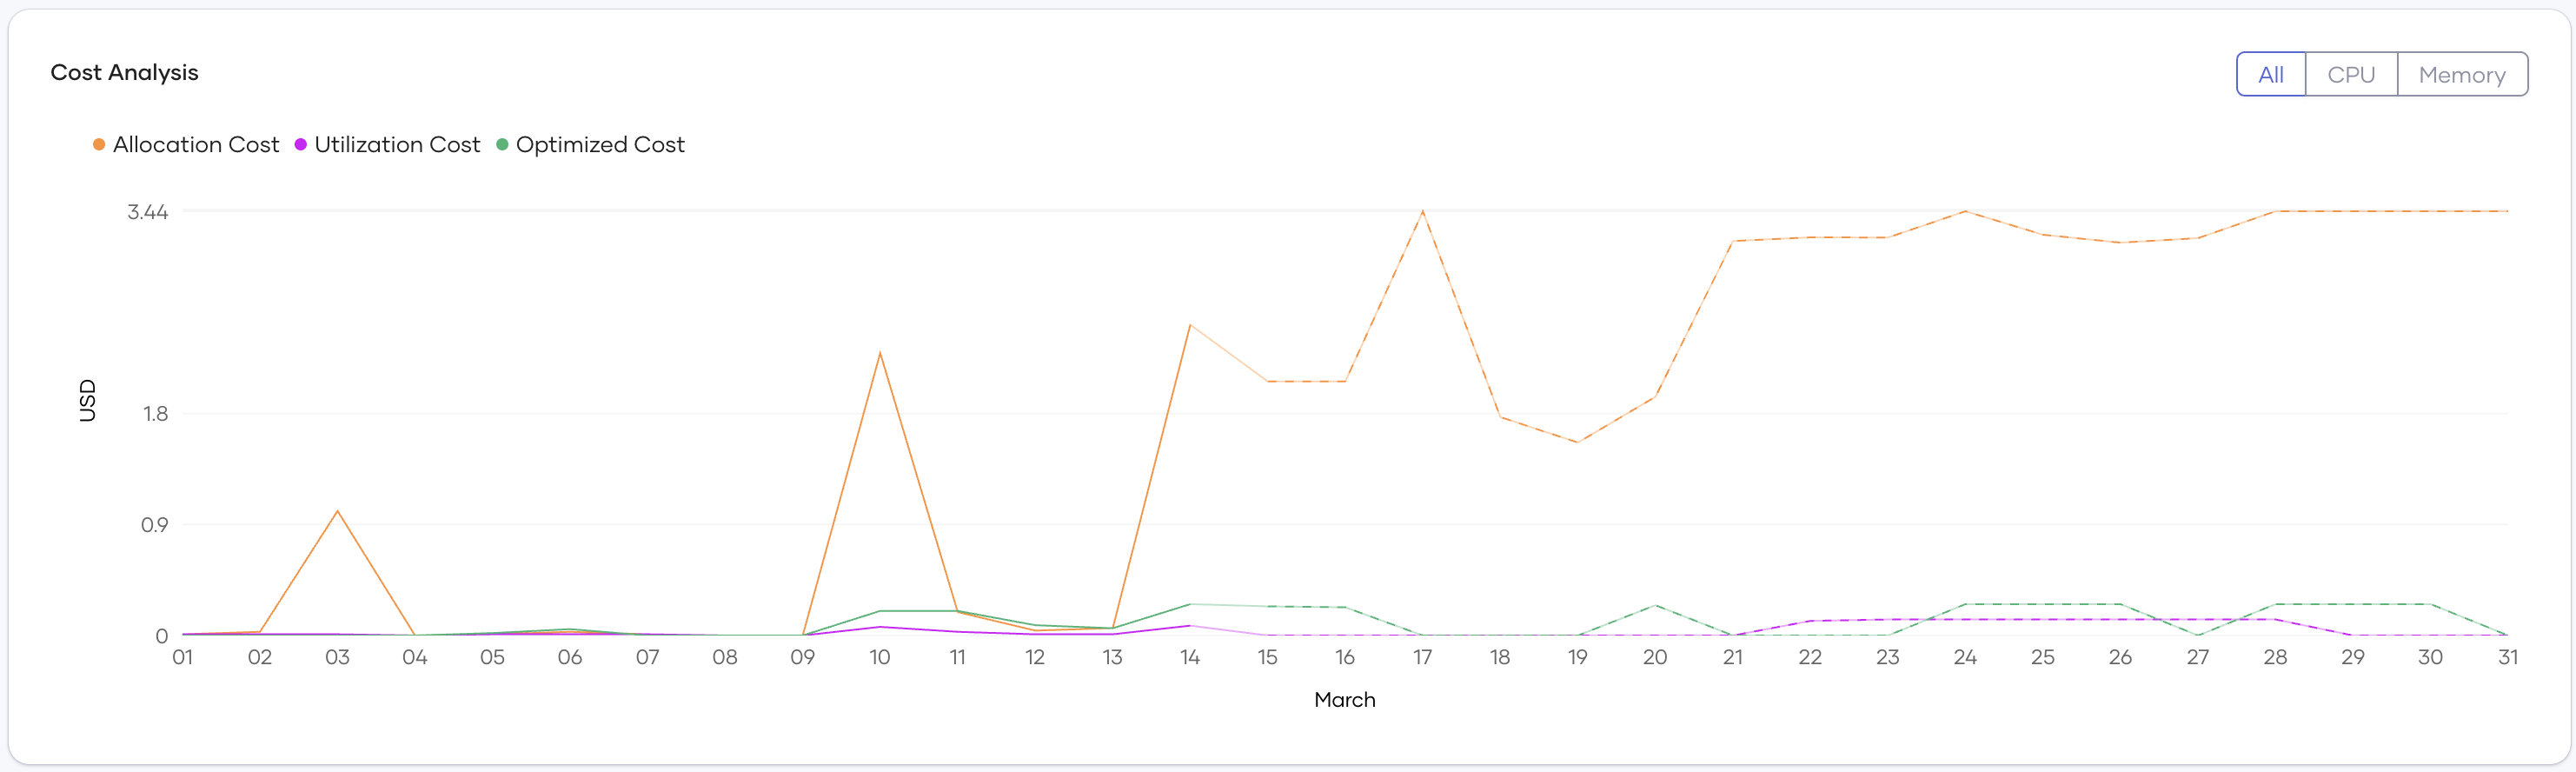
The plot consists of three lines:
- Allocation Cost - The maximum of Request Cost and Utilization Cost at a given point in time. This is what you're billed for CPU and memory resource costs.
- Utilization Cost - The ideal cost that should be billed if no extra resources were allocated. This is typically not achievable in practice as some buffer is needed for uninterrupted service.
- Optimized Cost - The cost suggested by the optimization algorithm that provides sufficient buffer for efficient performance while optimizing costs.
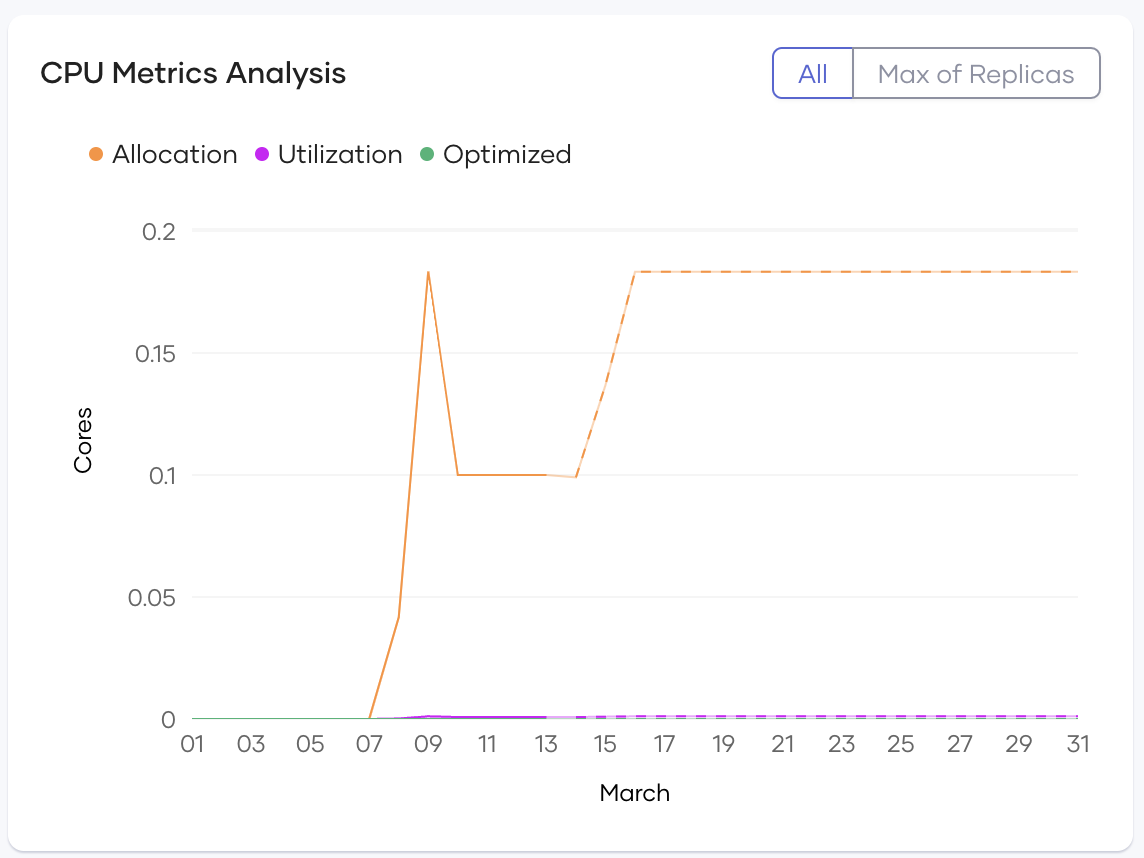
You can filter the view to show All resources, CPU only, or Memory only for time-based cost analysis.
- Cost Savings (Deployments Summary)
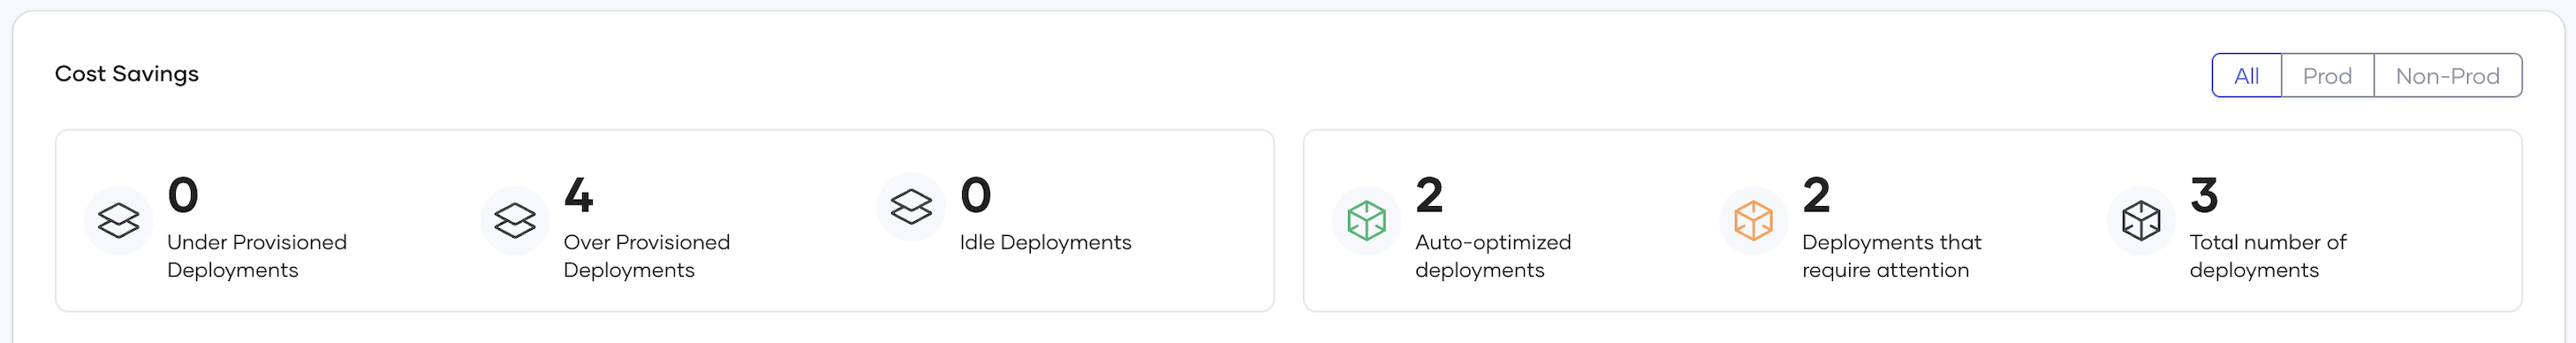
Under the Cost Savings section, these cards provide a summary of all deployments in your organization:
- Under Provisioned Deployments - Number of deployments with insufficient resource allocation
- Over Provisioned Deployments - Number of deployments with over-allocated resources
- Idle Deployments - Deployments with no traffic for the last 3 days
- Auto-optimized deployments - Number of deployments with auto-optimization enabled
- Deployments that require attention - Number of deployments with auto-optimization disabled that have recommendations for manual application
-
Total number of deployments - Number of active deployments
-
Cost Savings (Project Summary)
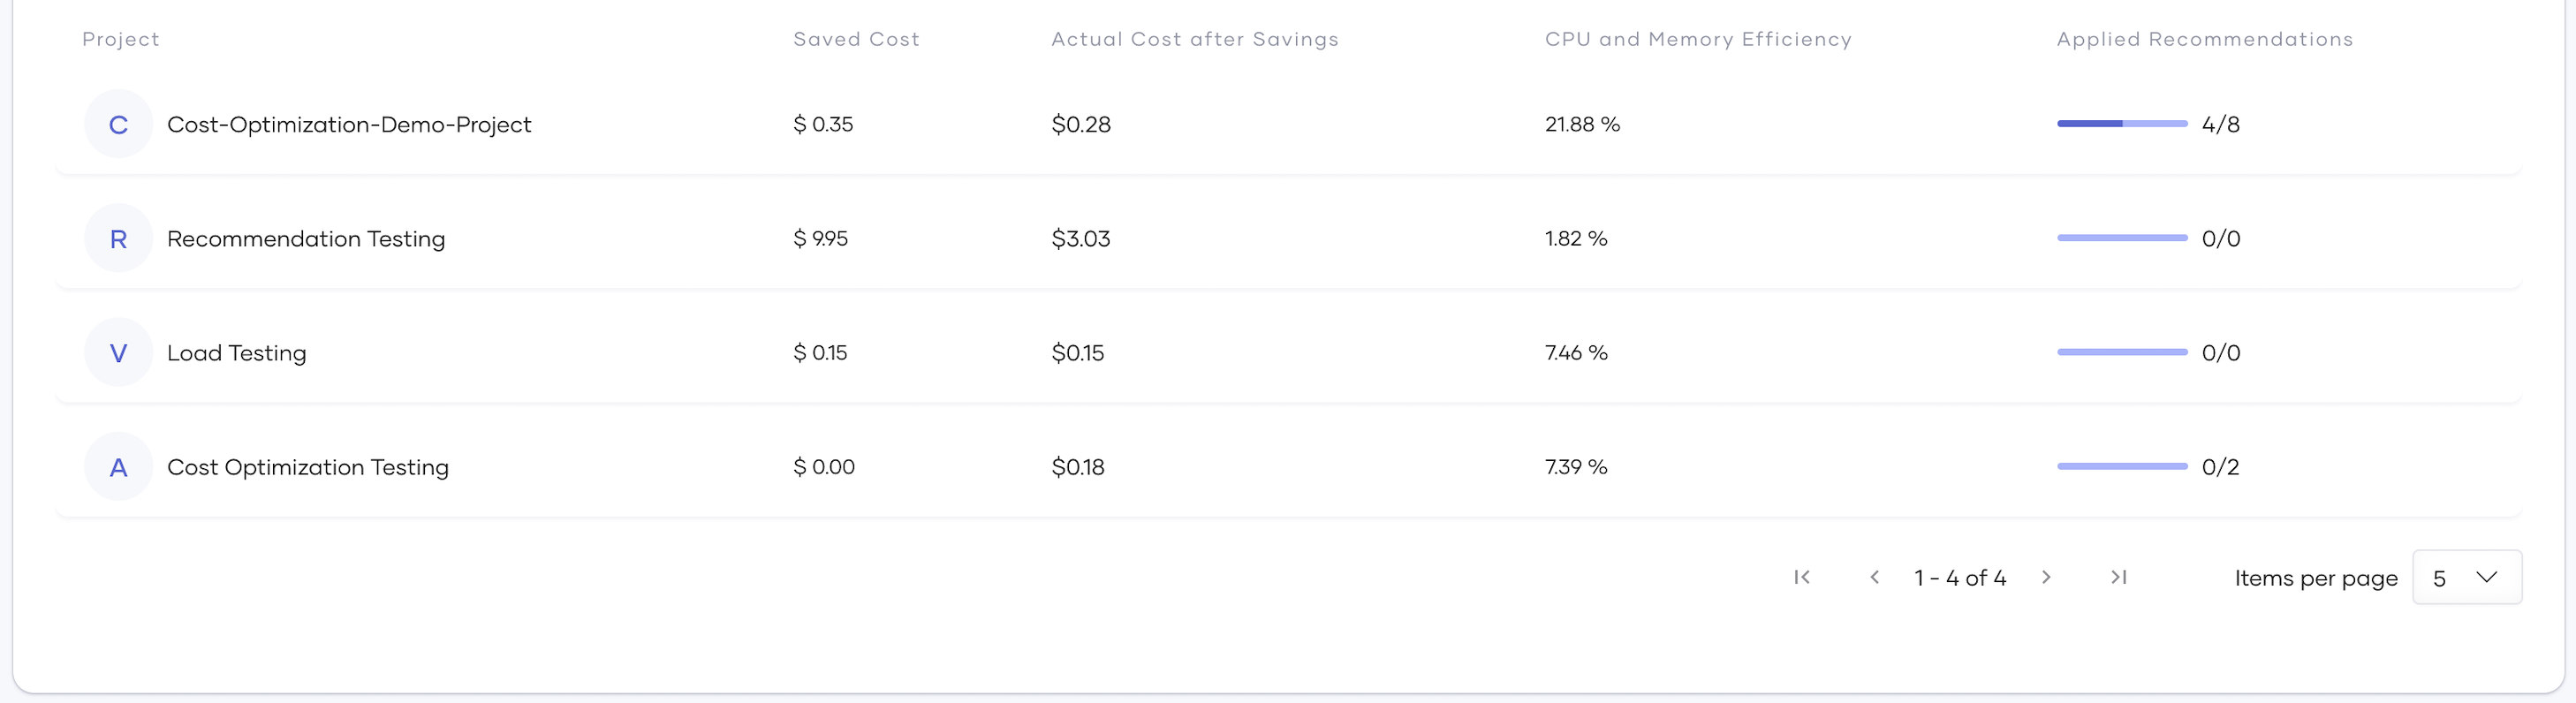
This table under the Cost Savings section includes a summary of all projects in your organization. Each row represents a project with columns showing: * Saved Cost after applying recommendations automatically/manually * Actual Cost after Savings * CPU and Memory Efficiency * Ratio of Applied Suggestions to total available recommendations
You can click on any project in this table or use the top navigation to view the Project Level cost insights.
Project Level
The Project Level view is similar to the Organization Level, with all monthly metrics focused on the selected project. The charts, cards, plots, and tables follow the same format as the Organization Level.
An additional feature at this level is the ability to toggle auto-apply for each integration in the Cost Savings (Integration Summary) table, or for all integrations. This simplifies the process of enabling auto-application of recommendations across all integrations in a project.
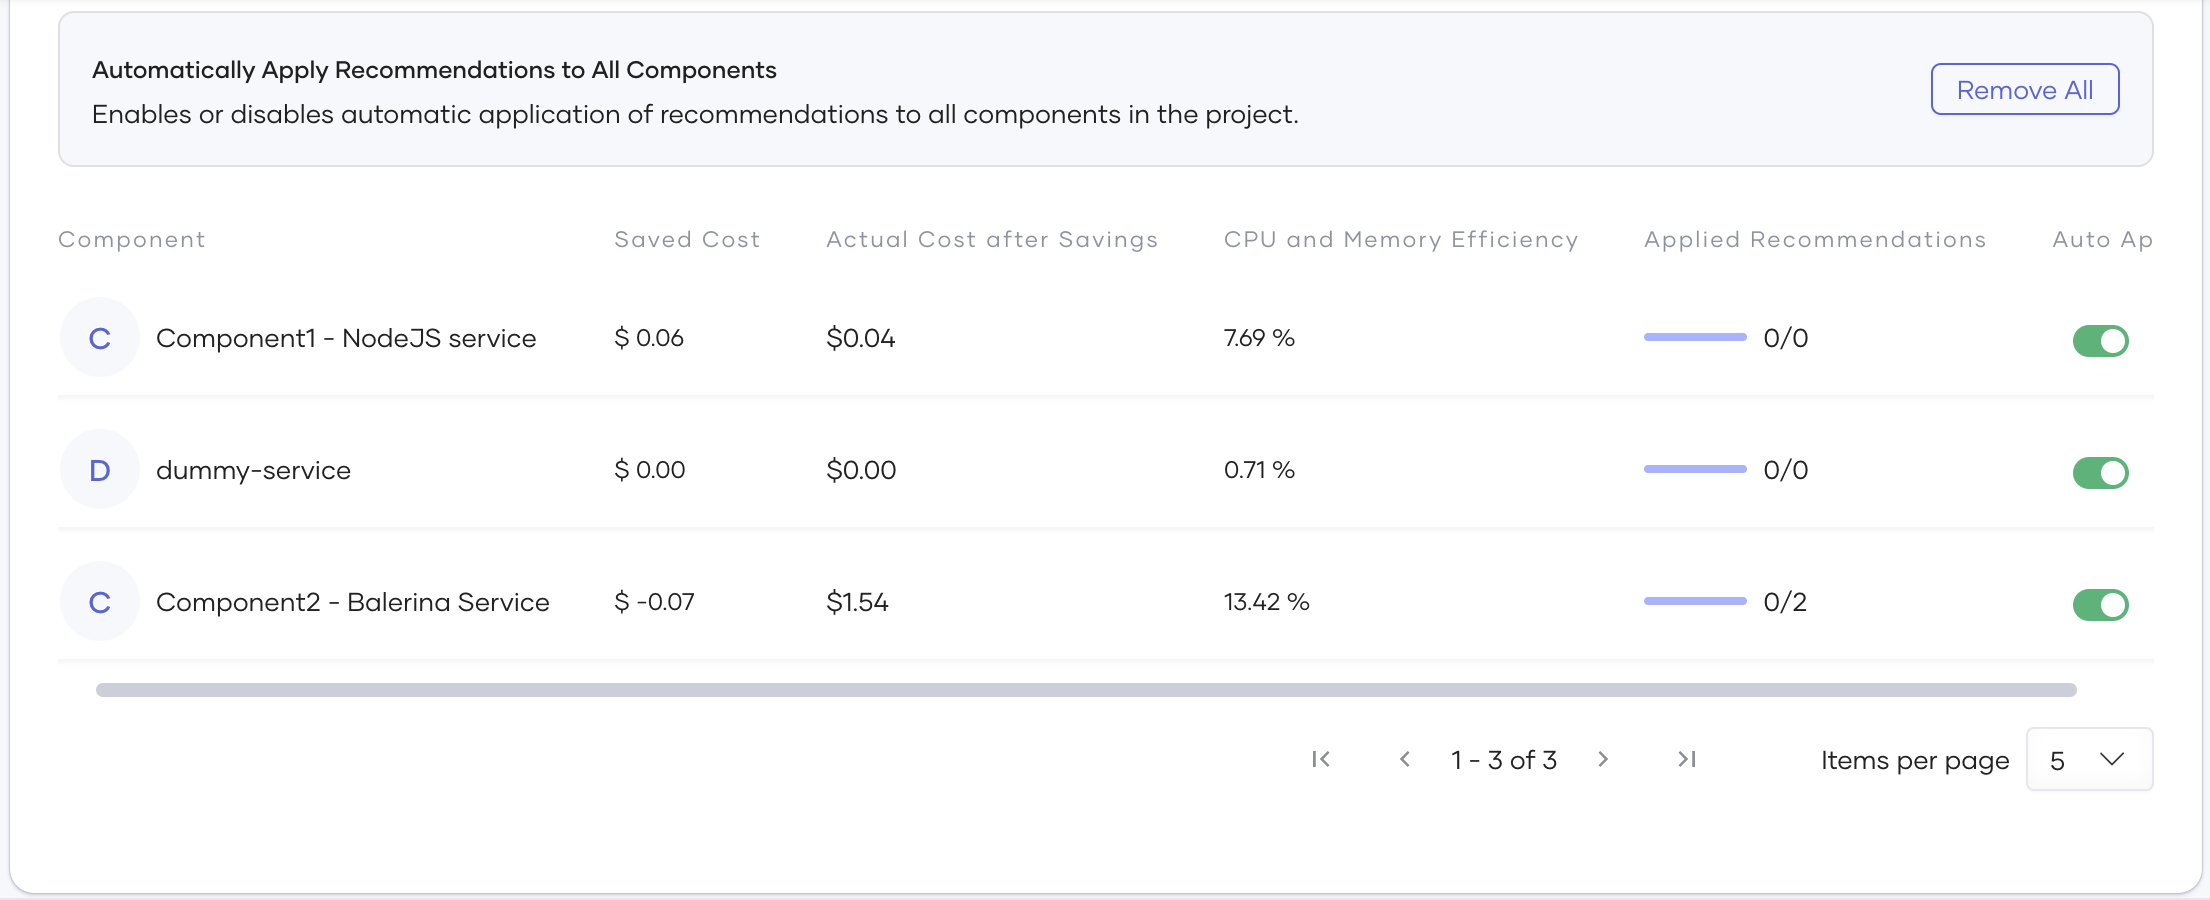
These toggles enable automatic application of recommendations for all deployments in the selected integrations.
Integration Level
The Integration Level differs from both the Organization and Project levels. At the Integration Level, you can access the release level through both the deployment track (version) and the environment configuration as shown:

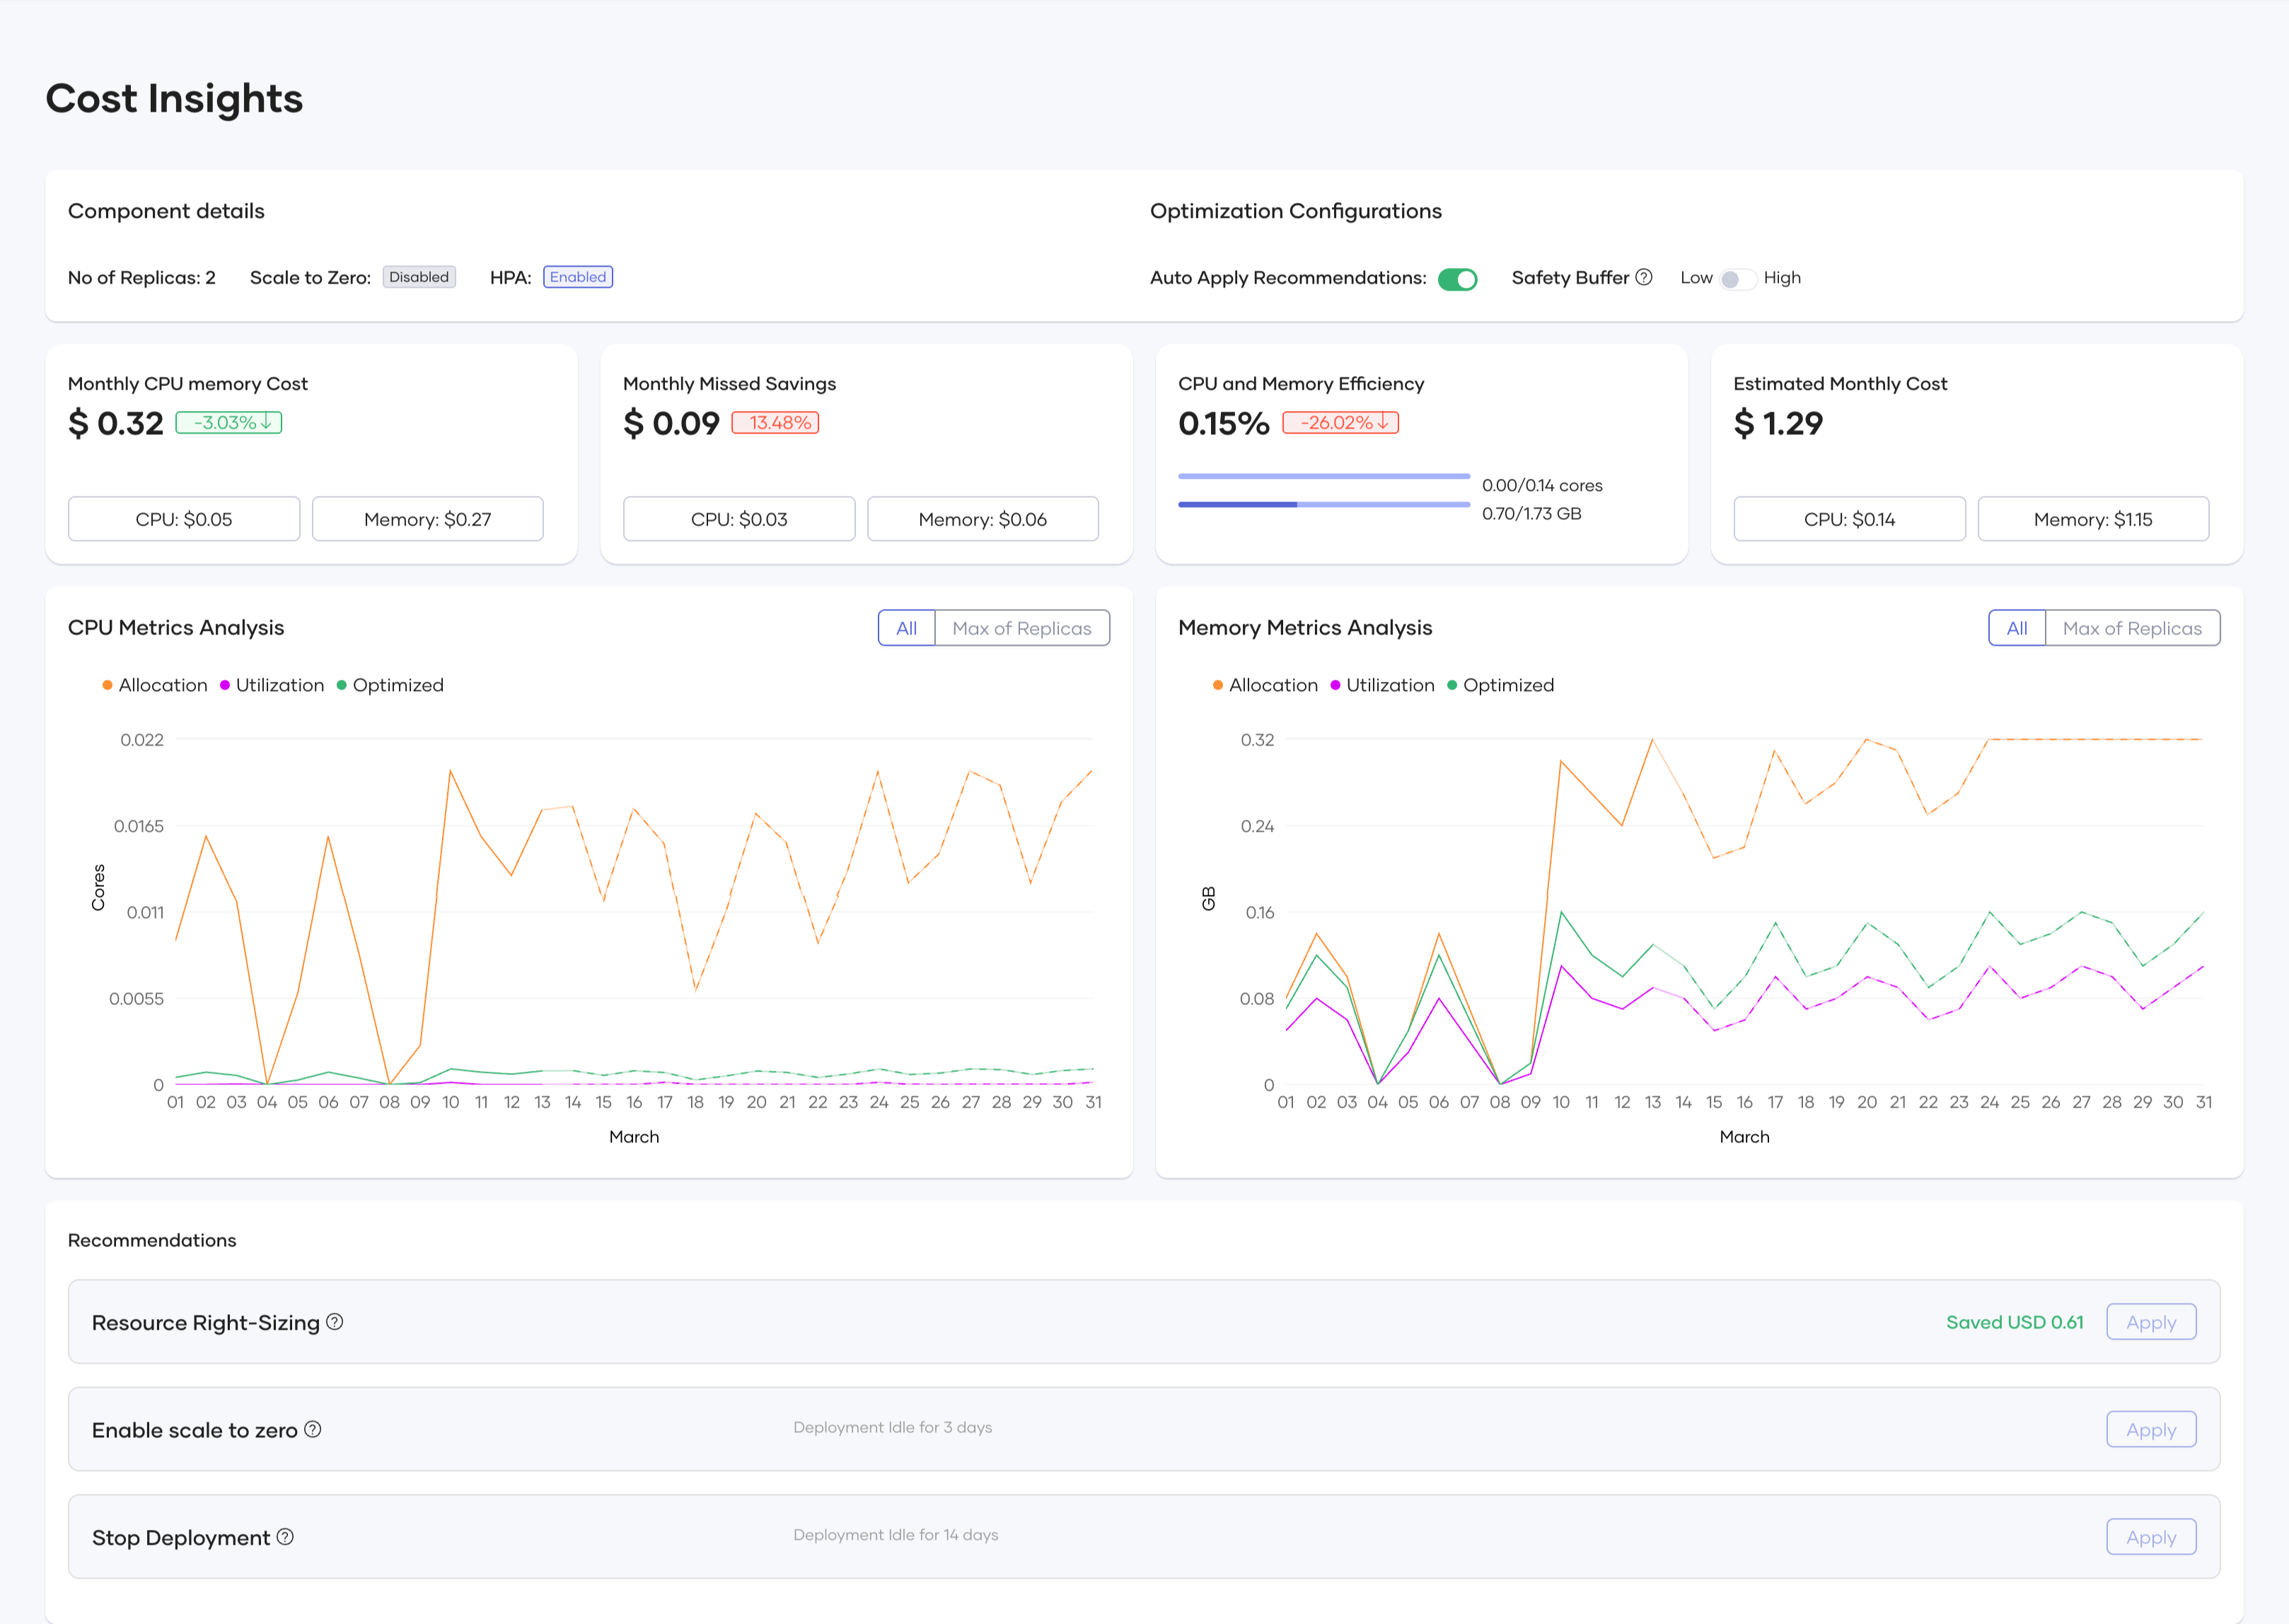
At the Release Level within the Integration Level, you can view:
- Integration details and Optimization Configurations
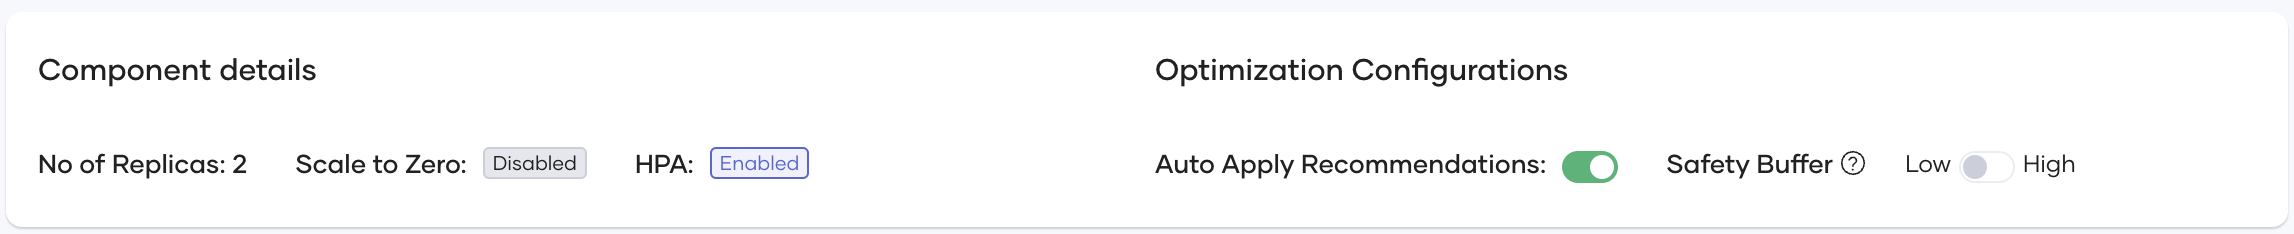
This card shows configuration data for the deployment, including the number of replicas, scale-to-zero settings, and horizontal pod autoscaling that can be configured in DevOps.
Optimization Configurations
Under the Optimization Configurations section, you can configure how Devant applies cost optimization recommendations:
Auto Apply Recommendations
When enabled, this toggle automatically implements resource right-sizing recommendations daily. Every 24 hours, the system automatically checks if the release has any recommendations that would save more than $0.01, and if found, applies them without requiring manual intervention. This feature helps maintain continuous cost efficiency without constant monitoring.
Safety Buffer
This setting determines how conservatively the optimization algorithm calculates resource recommendations:
- Low - Adds a 10% buffer above the calculated resource requirements, maximizing cost savings but providing less headroom for unexpected traffic spikes.
- High - Adds a 20% buffer above the calculated resource requirements, providing additional capacity to handle unexpected load increases. Recommended for production environments.
The Safety Buffer setting helps you balance between maximum cost efficiency and maintaining reliable performance. For mission-critical applications or services with variable workloads, the High setting provides additional capacity to handle sudden traffic increases, while the Low setting is suitable for predictable workloads where you want to optimize costs more aggressively. These configurations allow you to tailor the optimization behavior to your specific needs, balancing cost-saving opportunities with operational requirements at the integration level.
- Monthly Cost, Missed Savings, Efficiency, and Estimated Cost
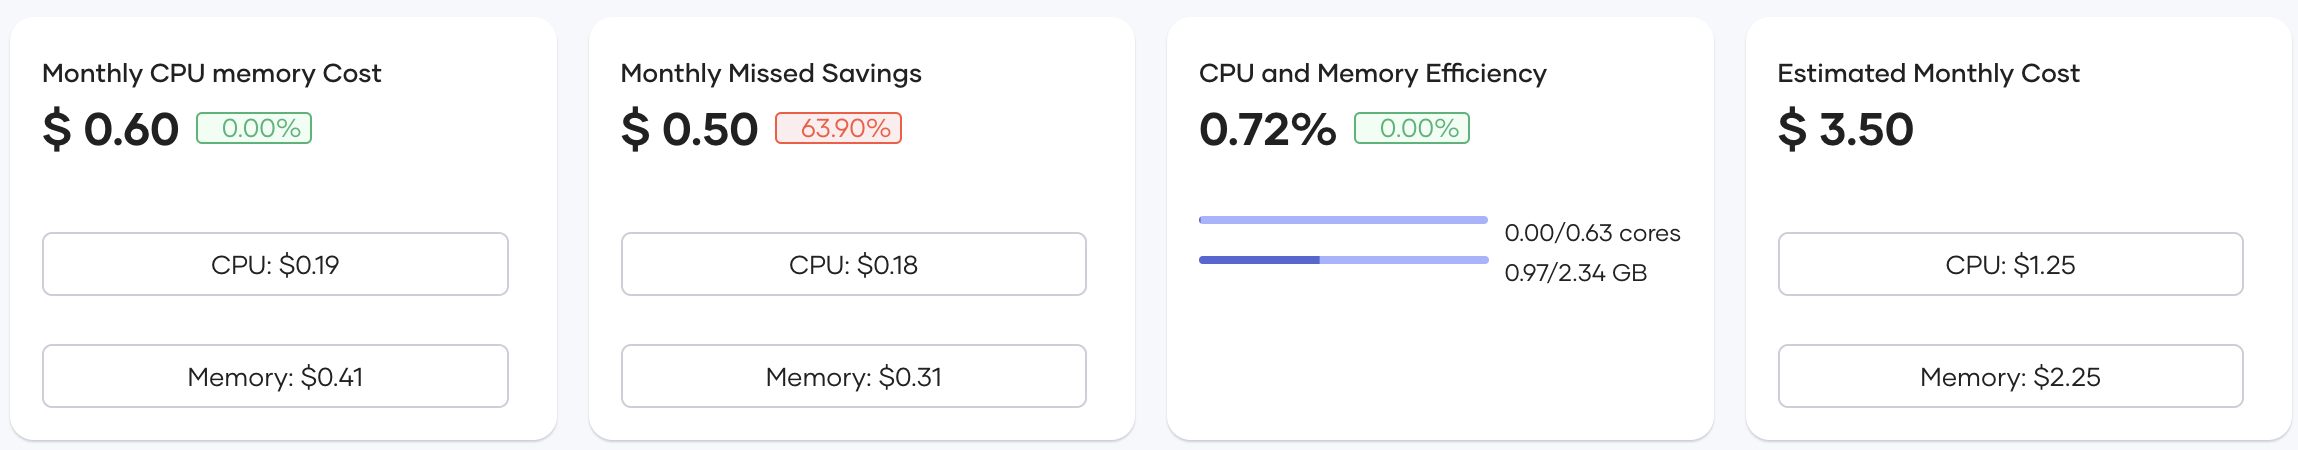
These cards summarize the cost and resource metrics similar to those at the Organization and Project levels.
- CPU Metrics Analysis
- Memory Metrics Analysis
- Recommendations
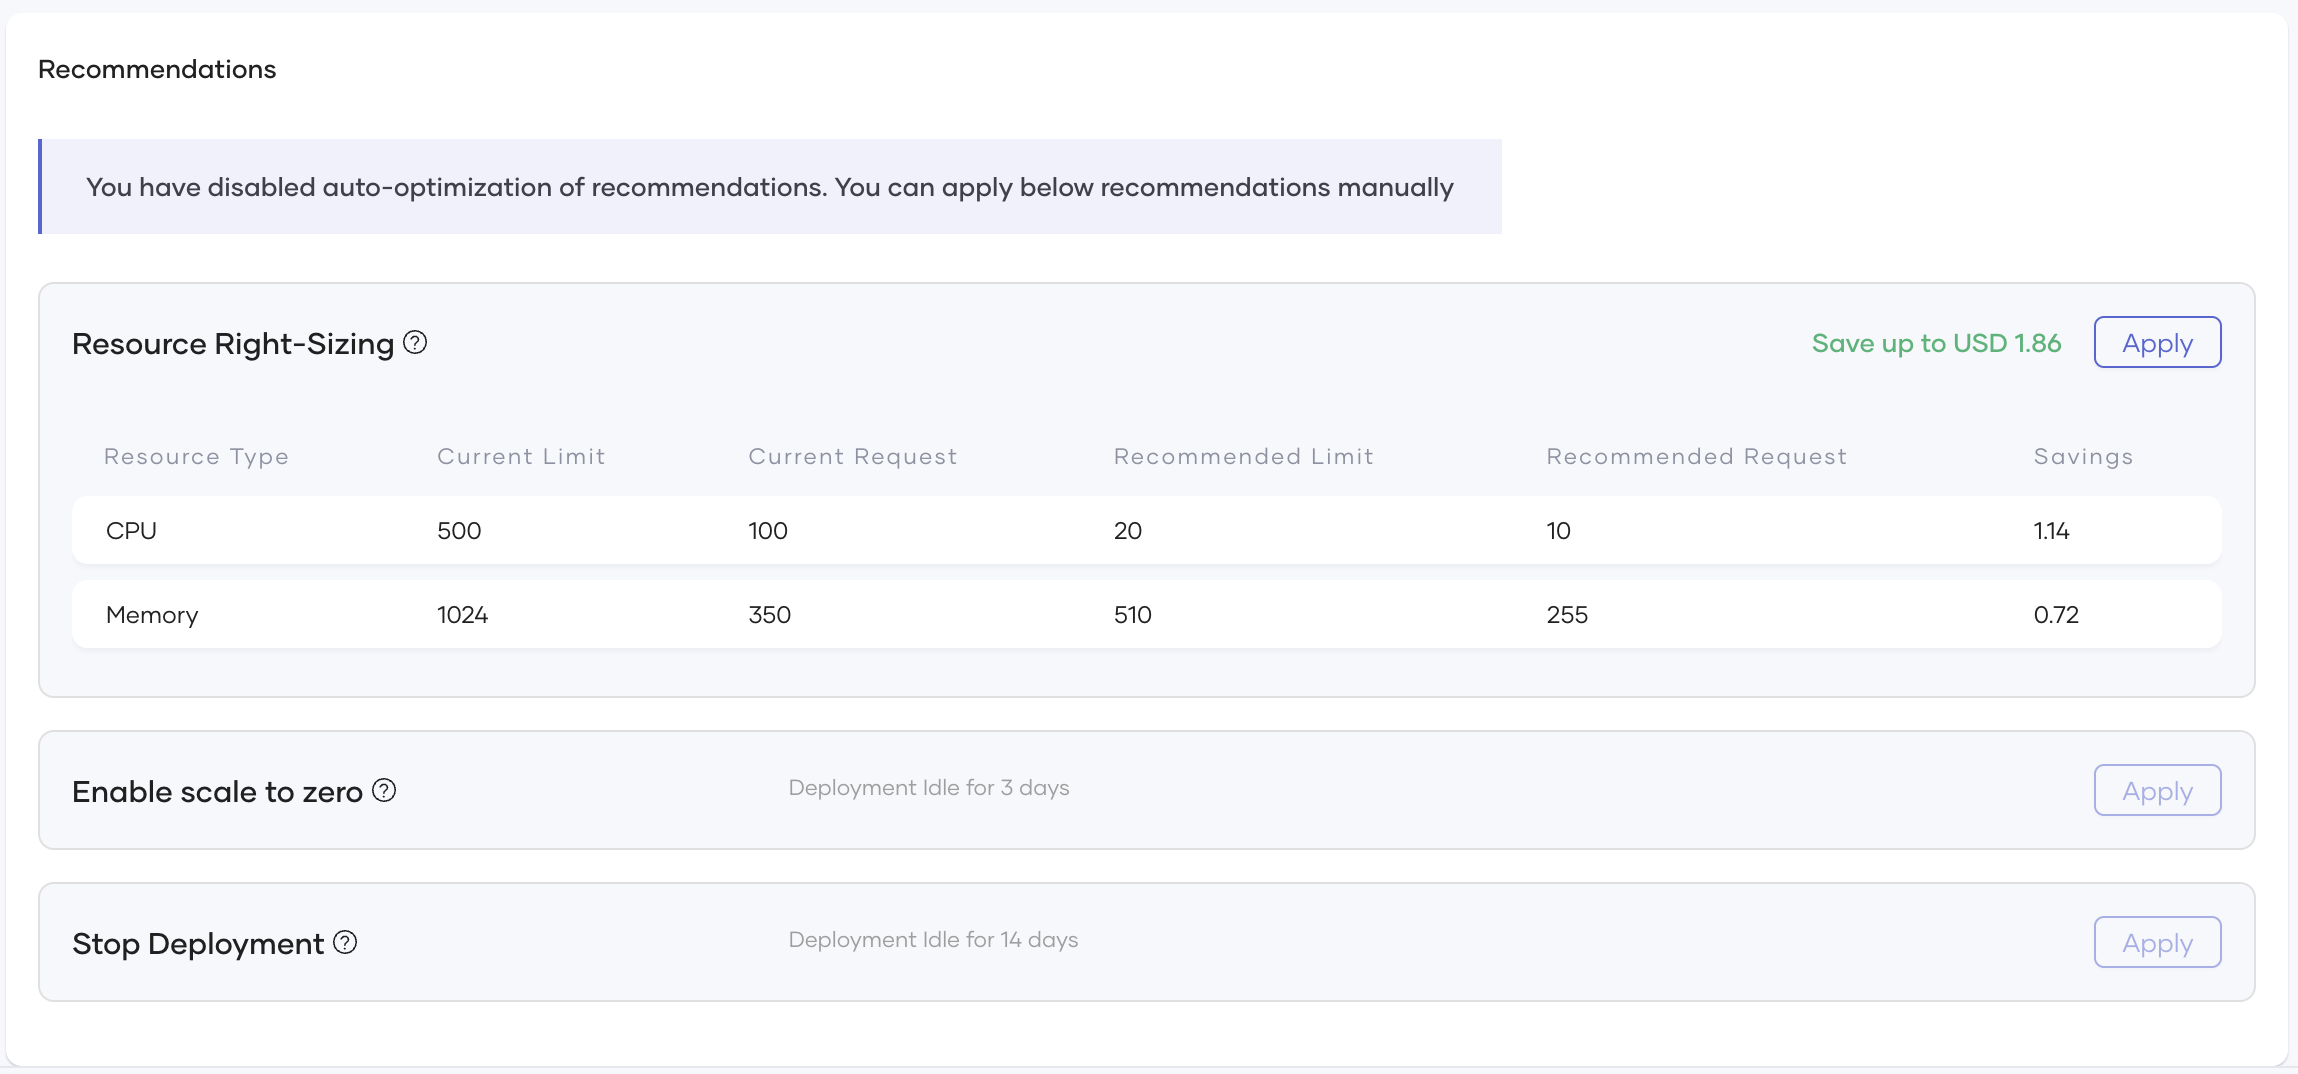
The system provides automated and manual recommendations for cost reduction.
Optimization Types
- Resource Right-Sizing
- Suggests optimized CPU and memory limits
-
Provides potential cost savings per adjustment
-
Enable Scale to Zero
- Stops an integration when no requests are being served
-
Reduces idle infrastructure costs
-
Stop Deployment
- Stops an integration when no requests are being served
- Prevents unnecessary spending on unused resources
Applying Recommendations
- Manually Apply: You can review and apply suggestions individually
- Auto-Apply Toggle: Enables automatic cost optimizations for projects/integrations
Conclusion
The Devant Cost Optimization feature helps you improve cloud resource efficiency by providing insights and recommendations at various levels. With interactive visualizations, automated recommendations, and optimization tracking, you can reduce infrastructure costs while maintaining performance.