Observability
When you run an agent, you want to see exactly what it did. Which tools it picked, what it sent to the LLM, what came back, and how long each step took. WSO2 Integrator ships with a dev-time trace server, a built-in tracing backend that runs alongside the IDE and streams spans into a Traces panel as your integration executes. With tracing on, the LLM's tool choices and interpretations of each result are visible in the spans, so you can debug agent behavior without adding print statements.
Enable tracing
Tracing is off by default. The way you turn it on depends on how the agent is exposed.
Chat agents
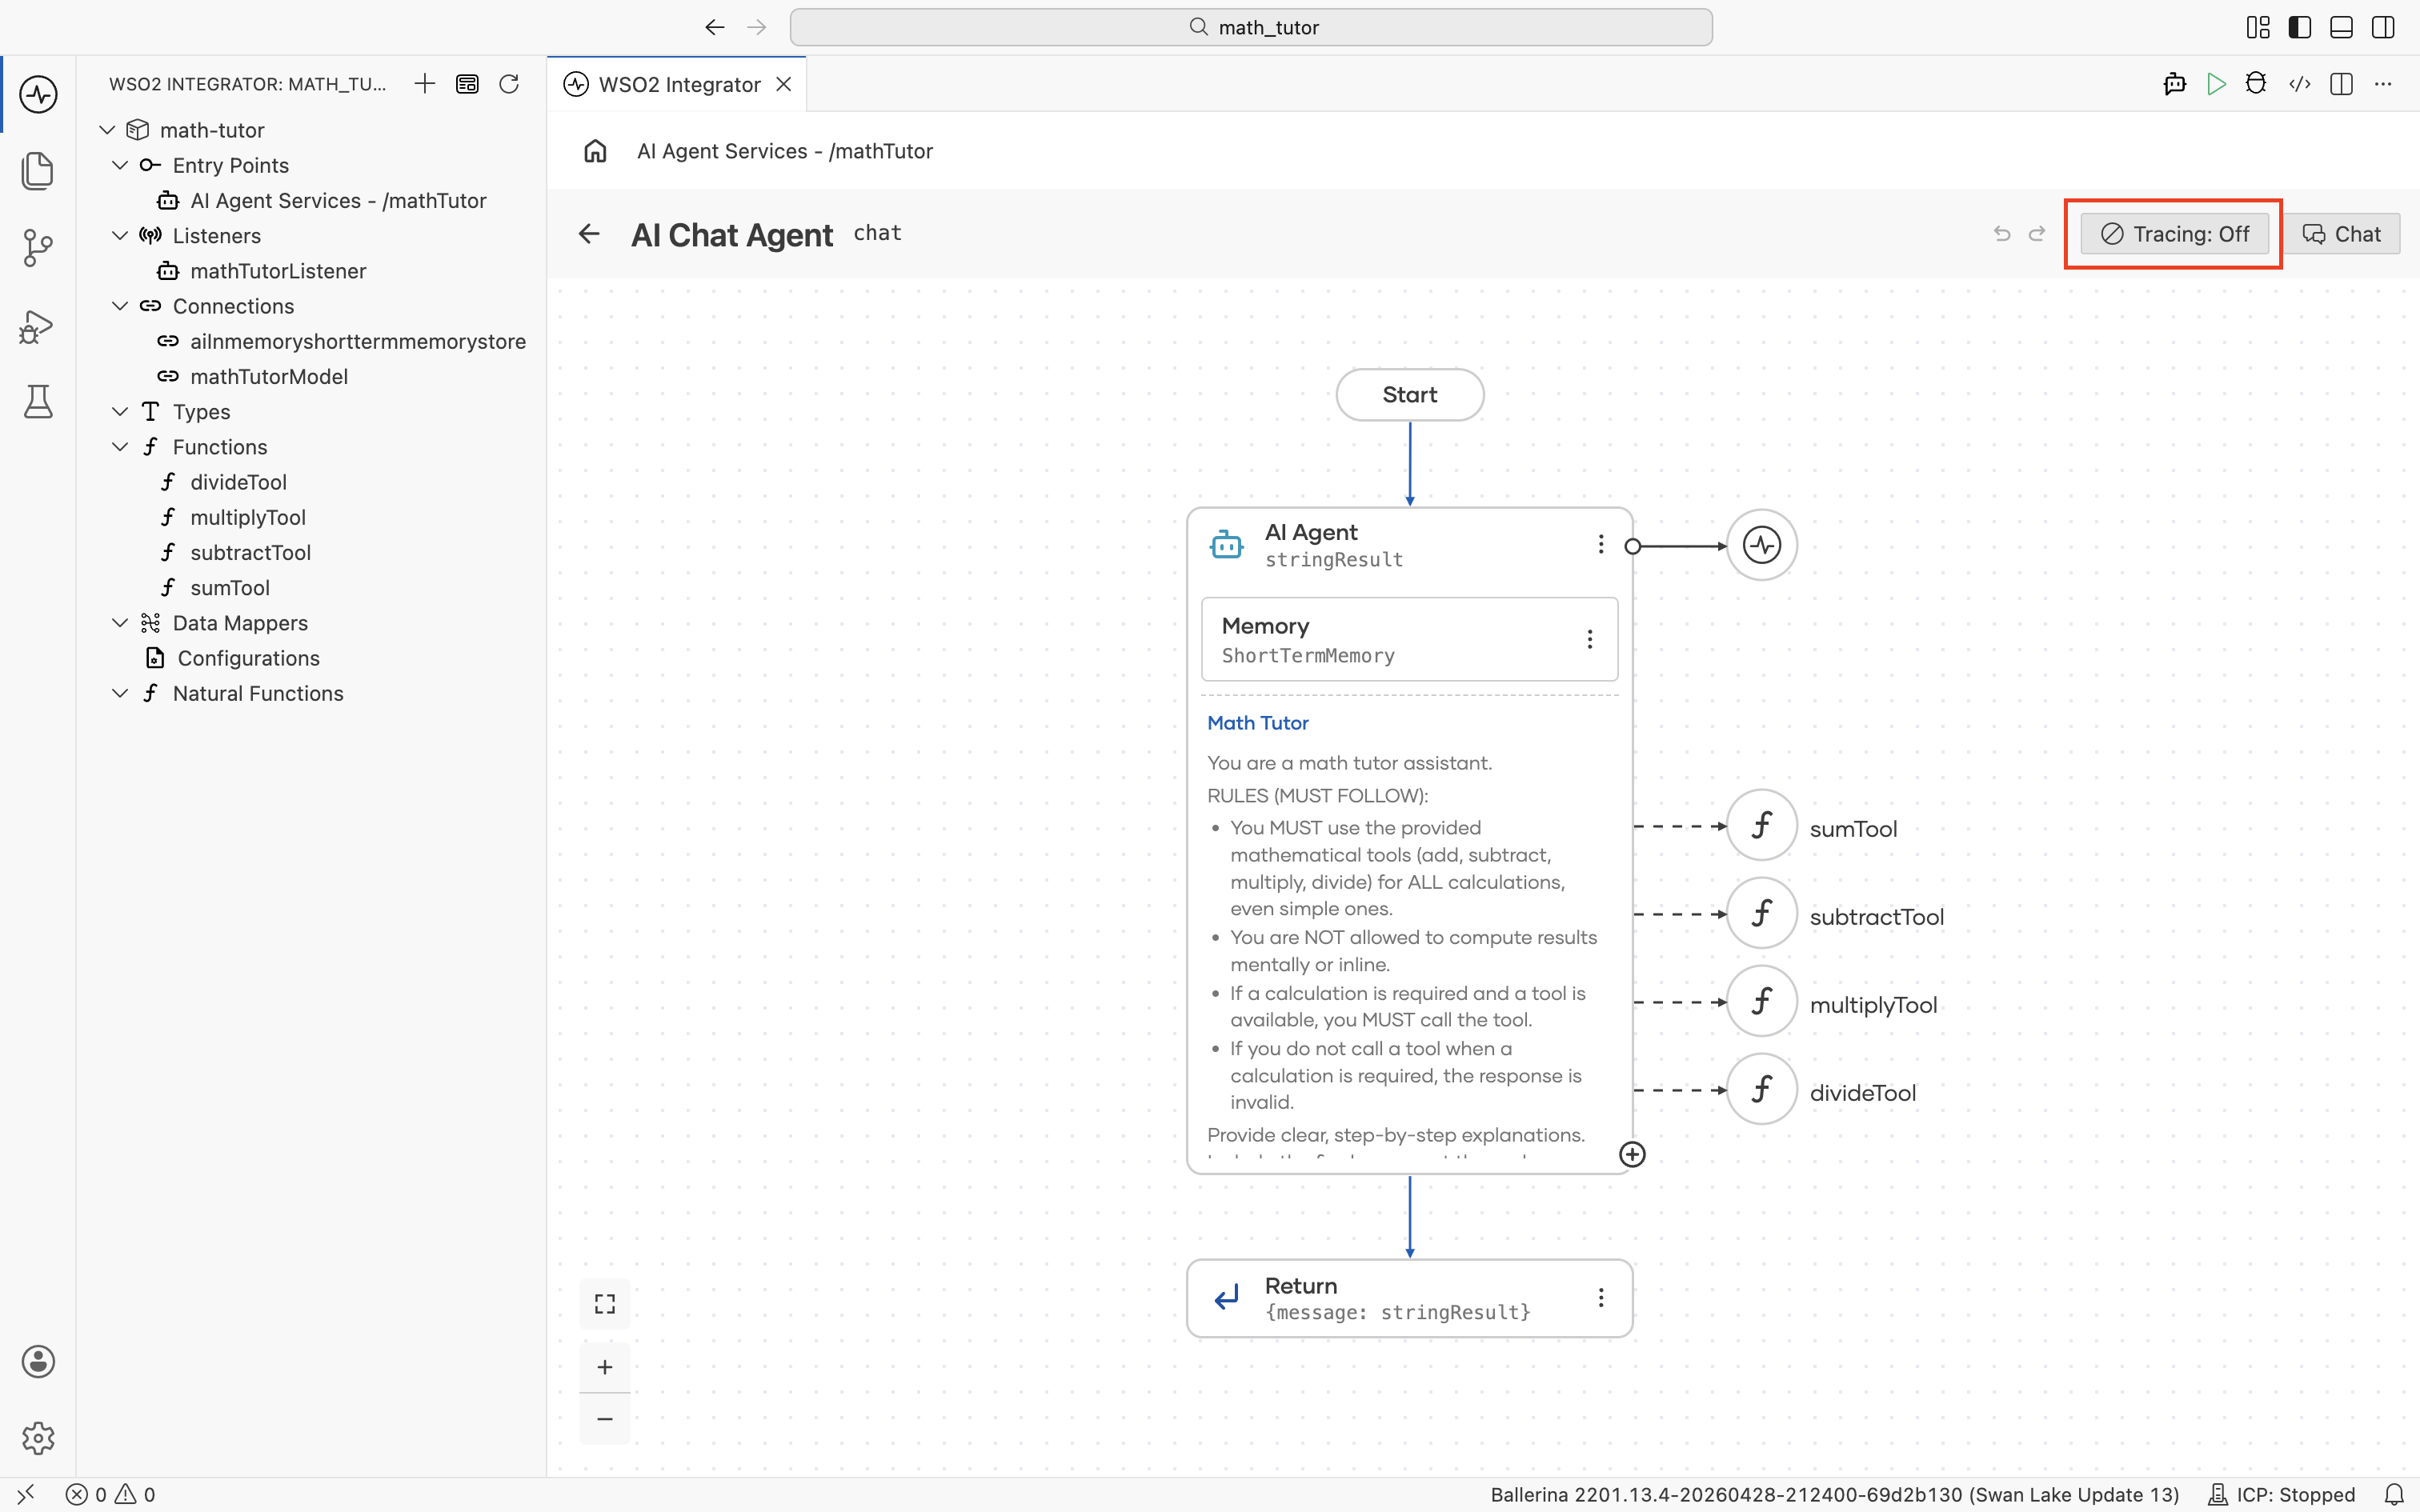
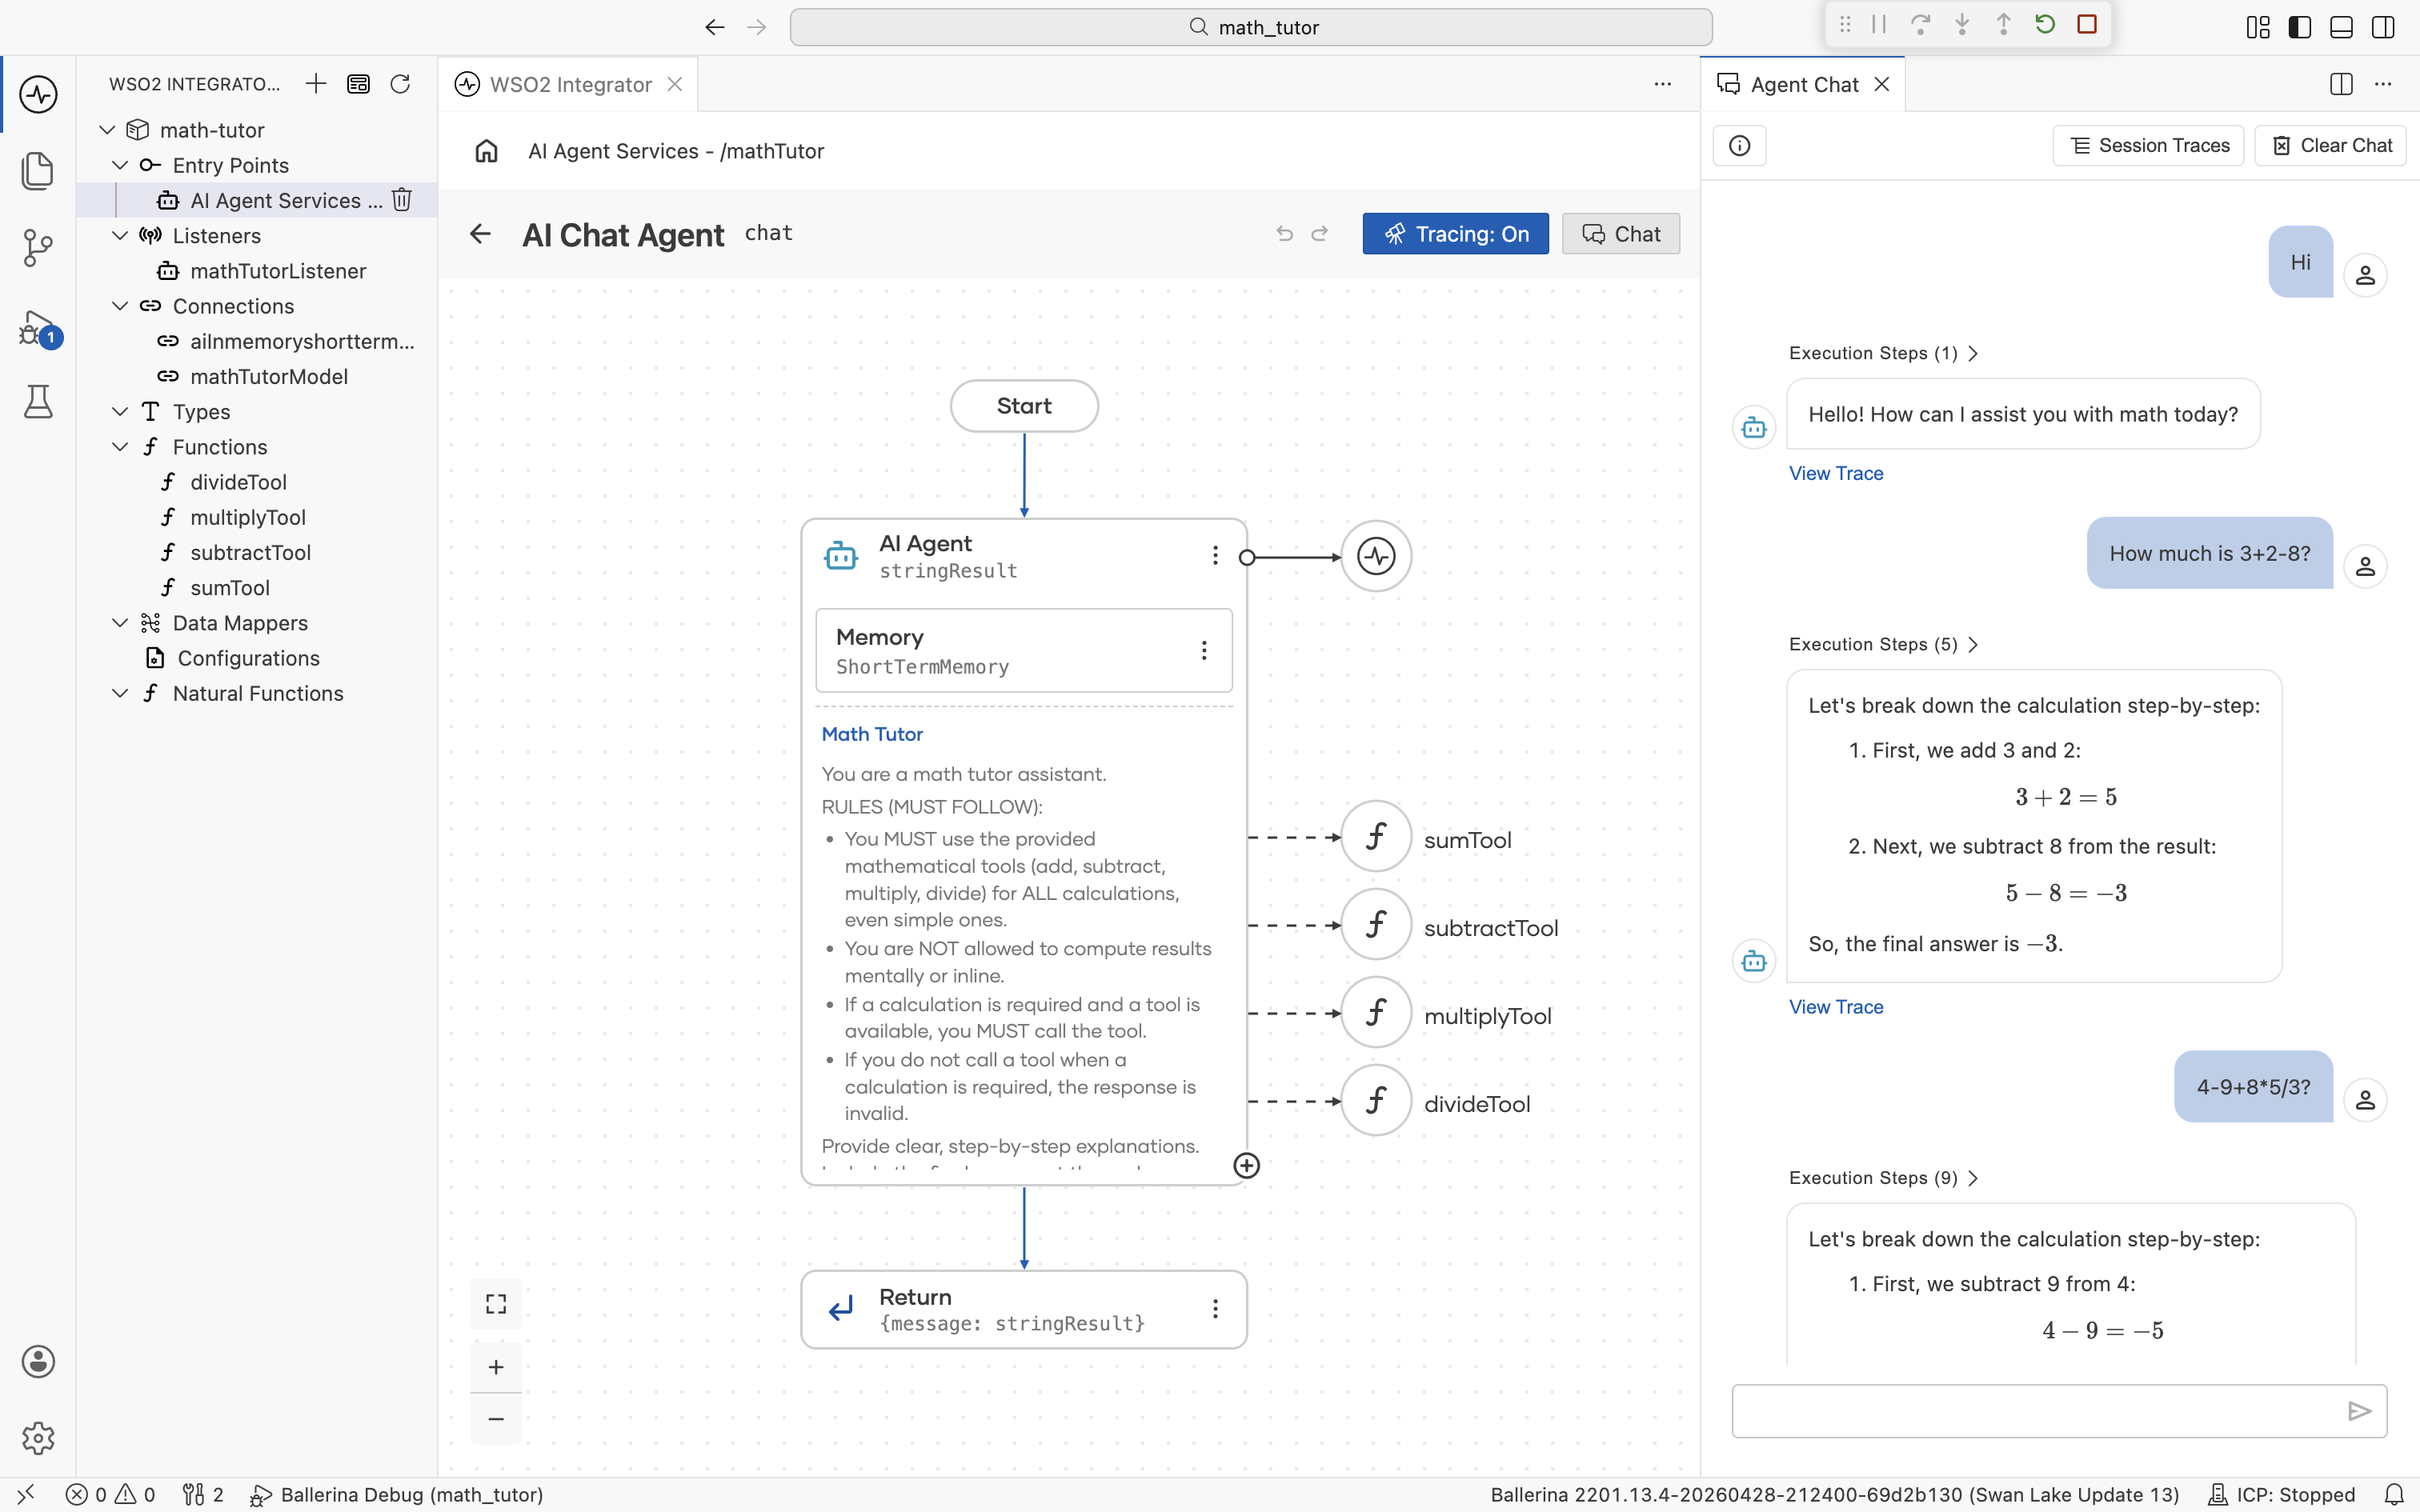
If your agent is built with the AI Chat Agent wizard, the agent canvas has a Tracing toggle in the top-right corner. When it's off, the toggle reads Tracing: Off.
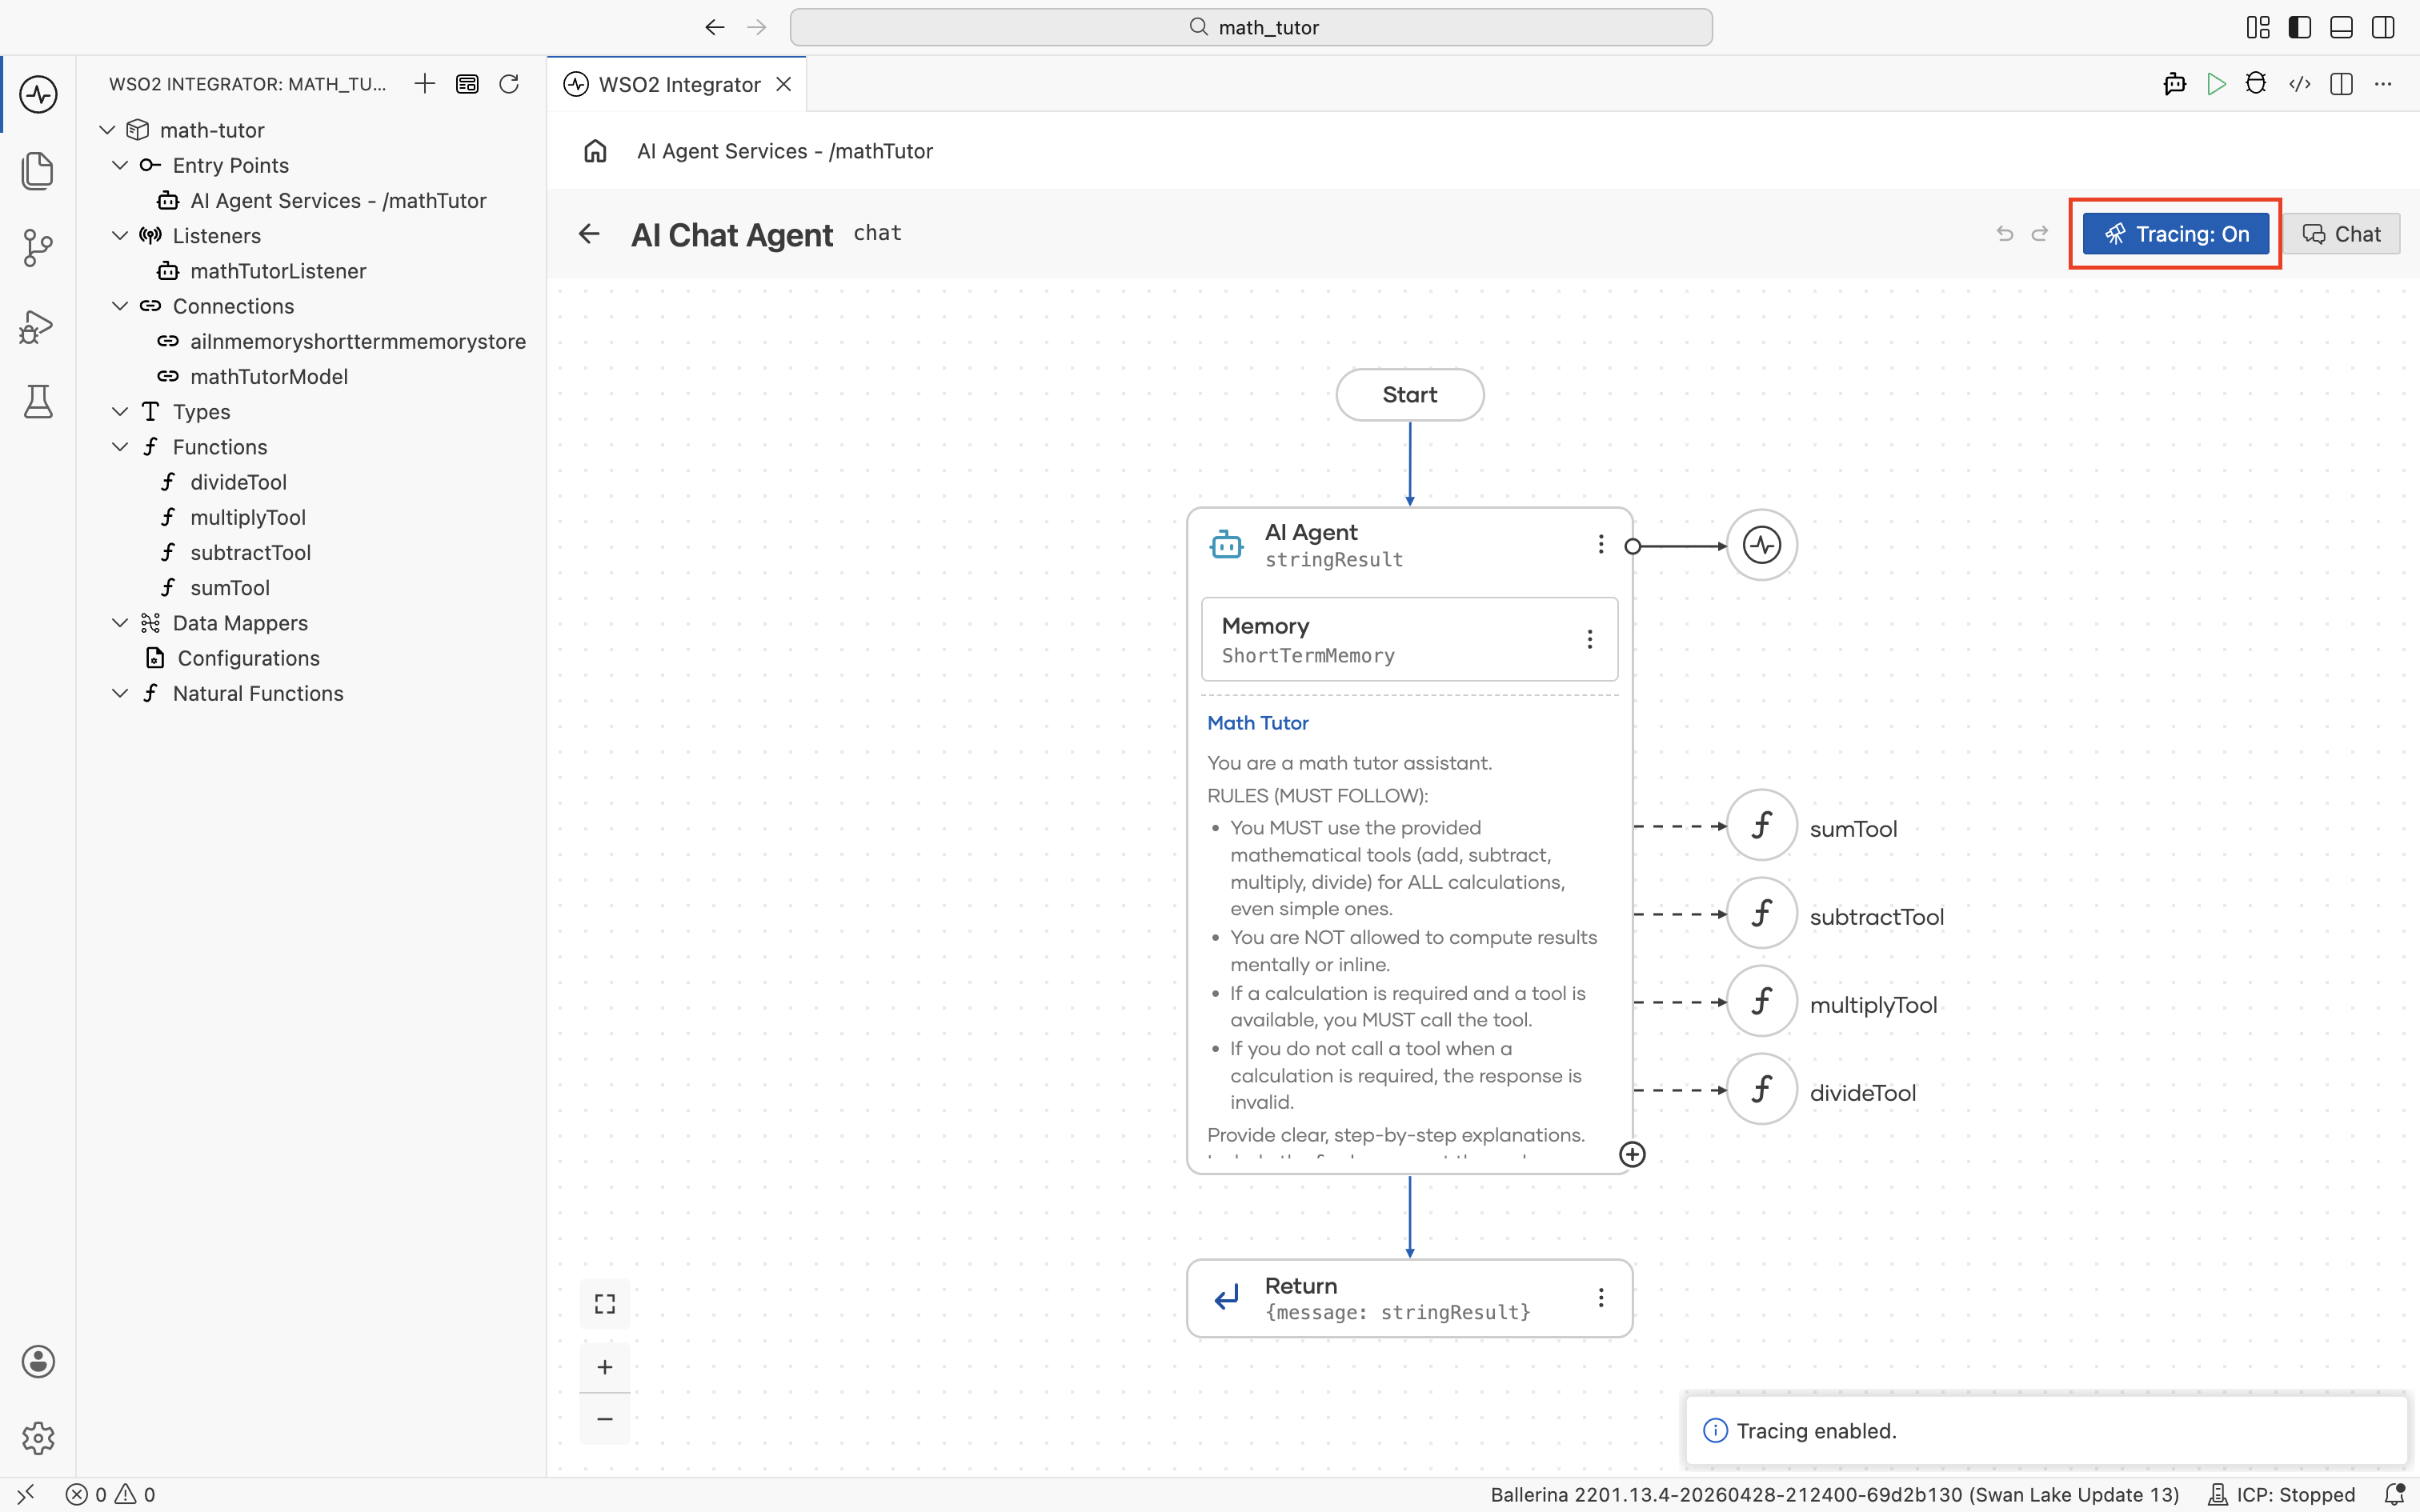
Click the toggle to turn it on. The label changes to Tracing: On and a confirmation notification appears in the bottom-right.
Click the toggle again at any time to turn tracing back off.
Inline agents
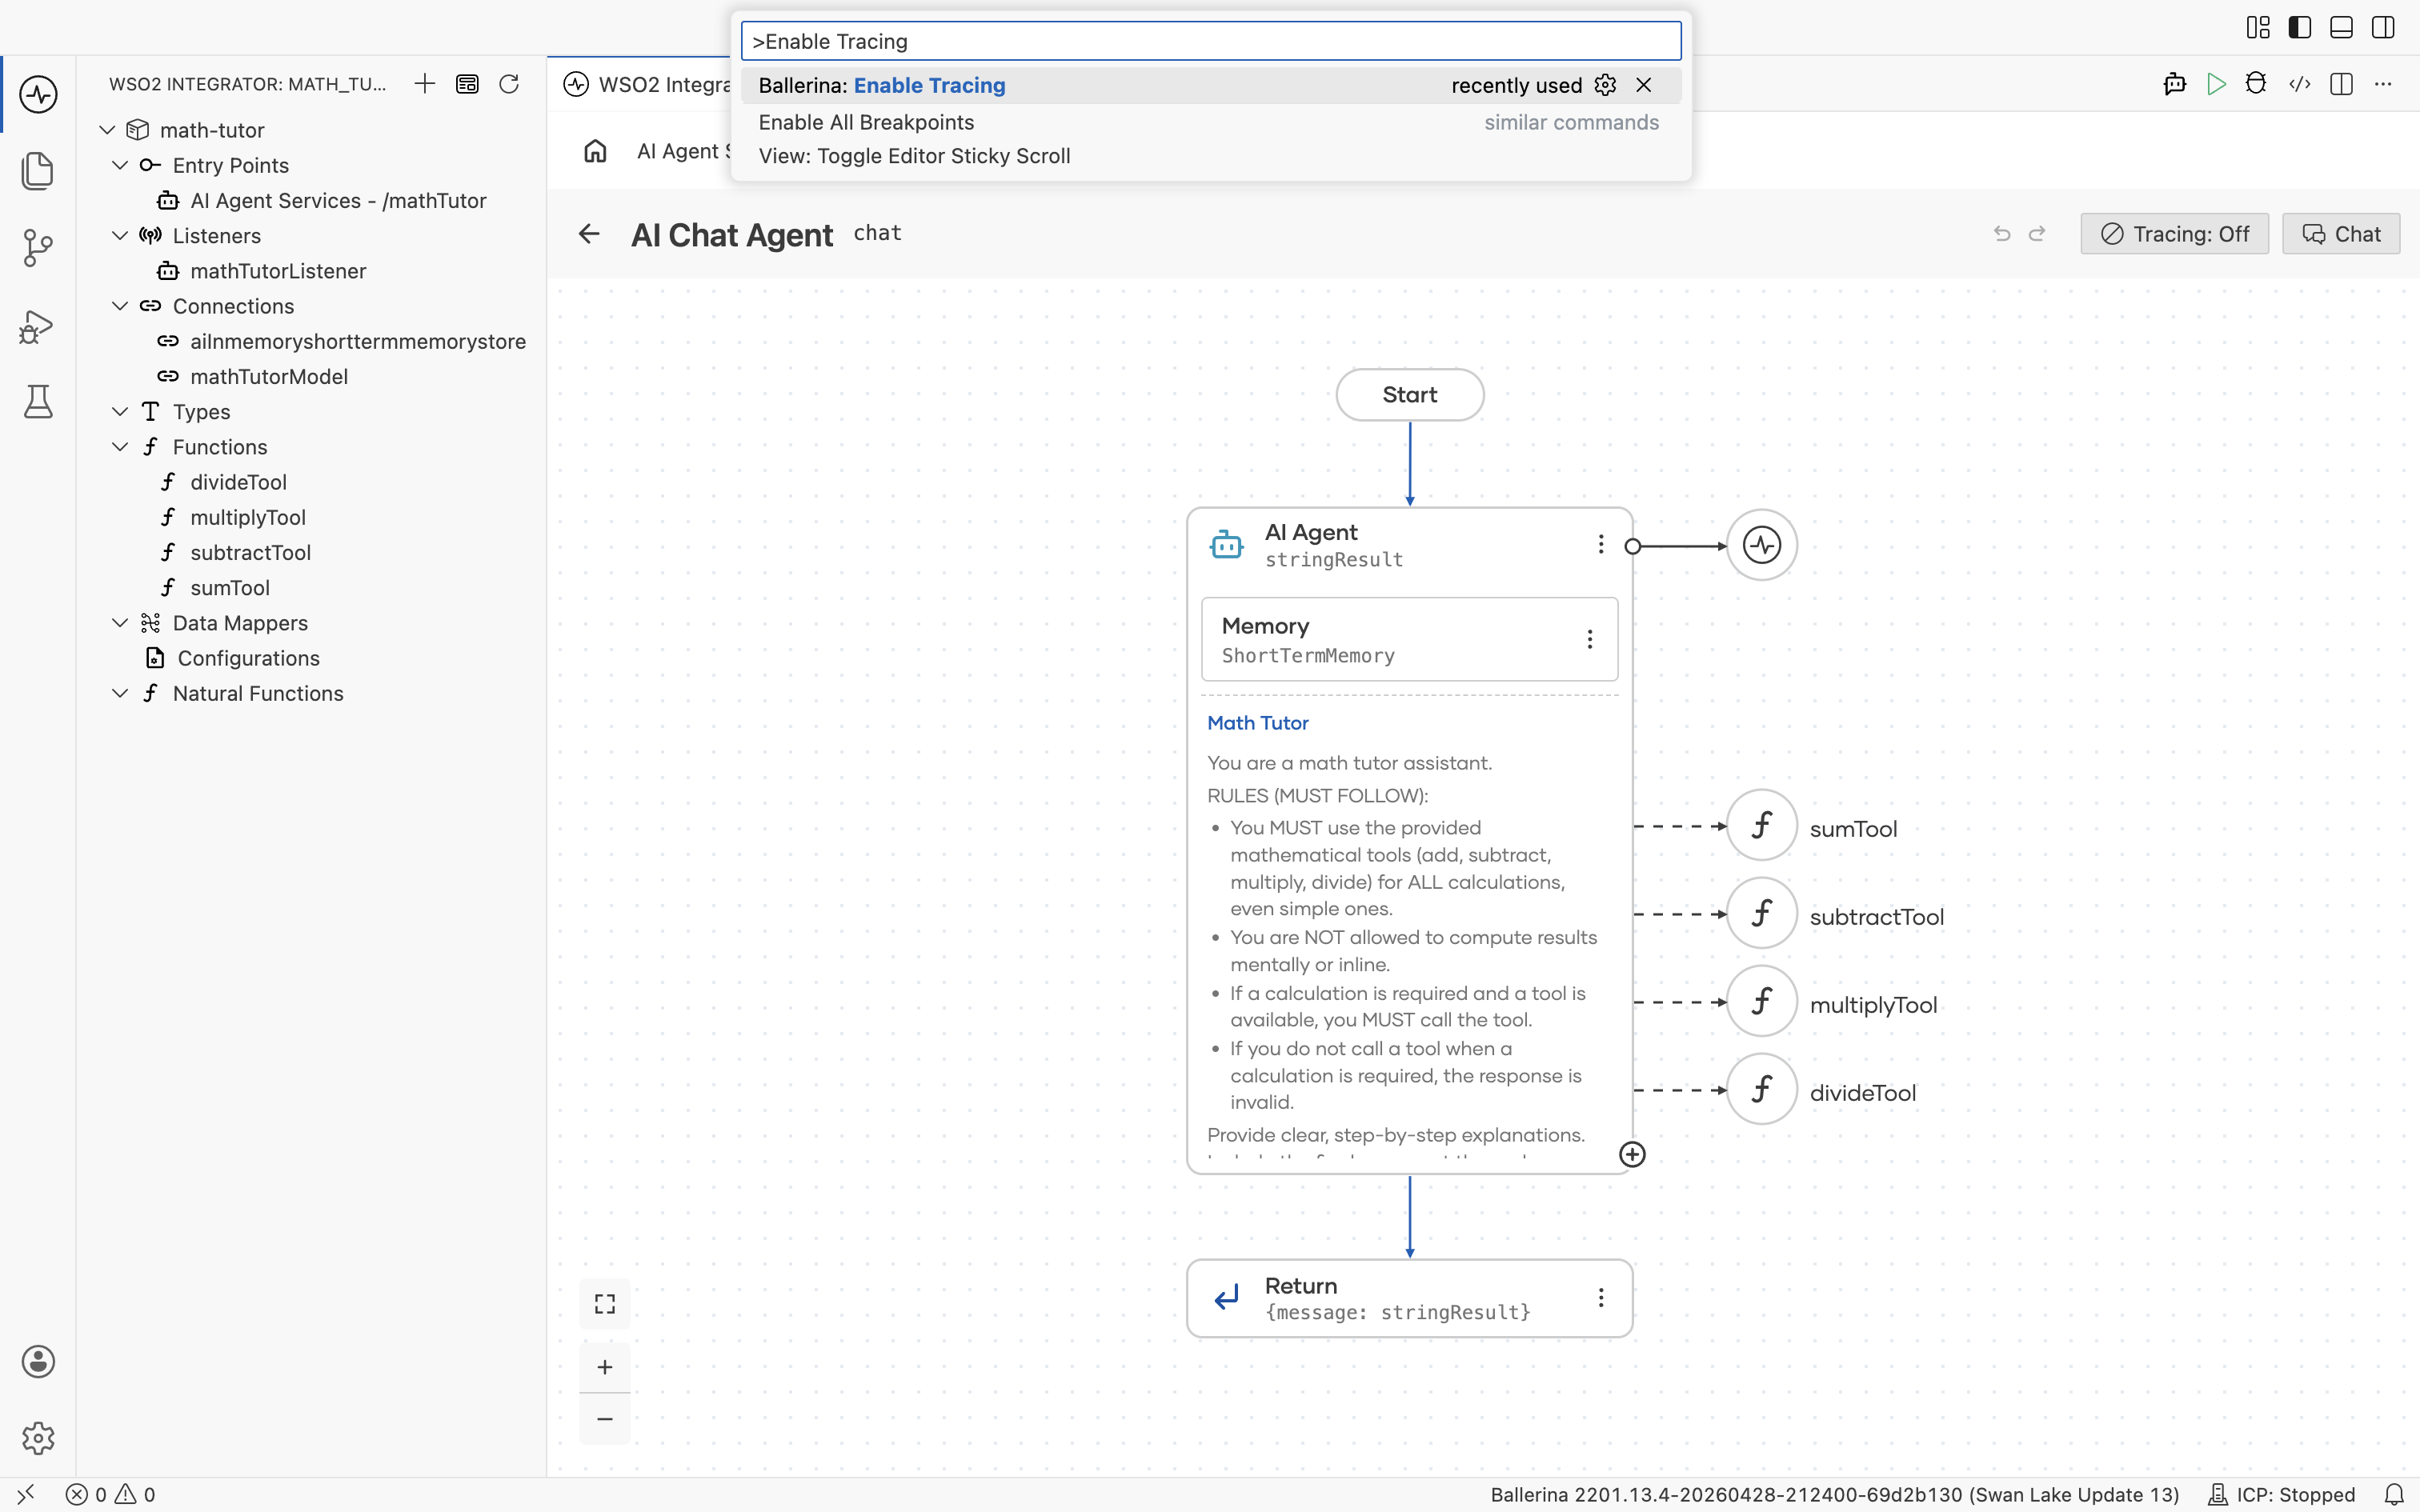
Agents declared inline in source, anywhere outside the AI Chat Agent wizard, don't show the toggle. Use the command palette instead.
- Open the command palette with
Cmd+Shift+P(macOS) orCtrl+Shift+P(Windows/Linux). - Run Ballerina: Enable Tracing.
To stop tracing, run Ballerina: Disable Tracing the same way.
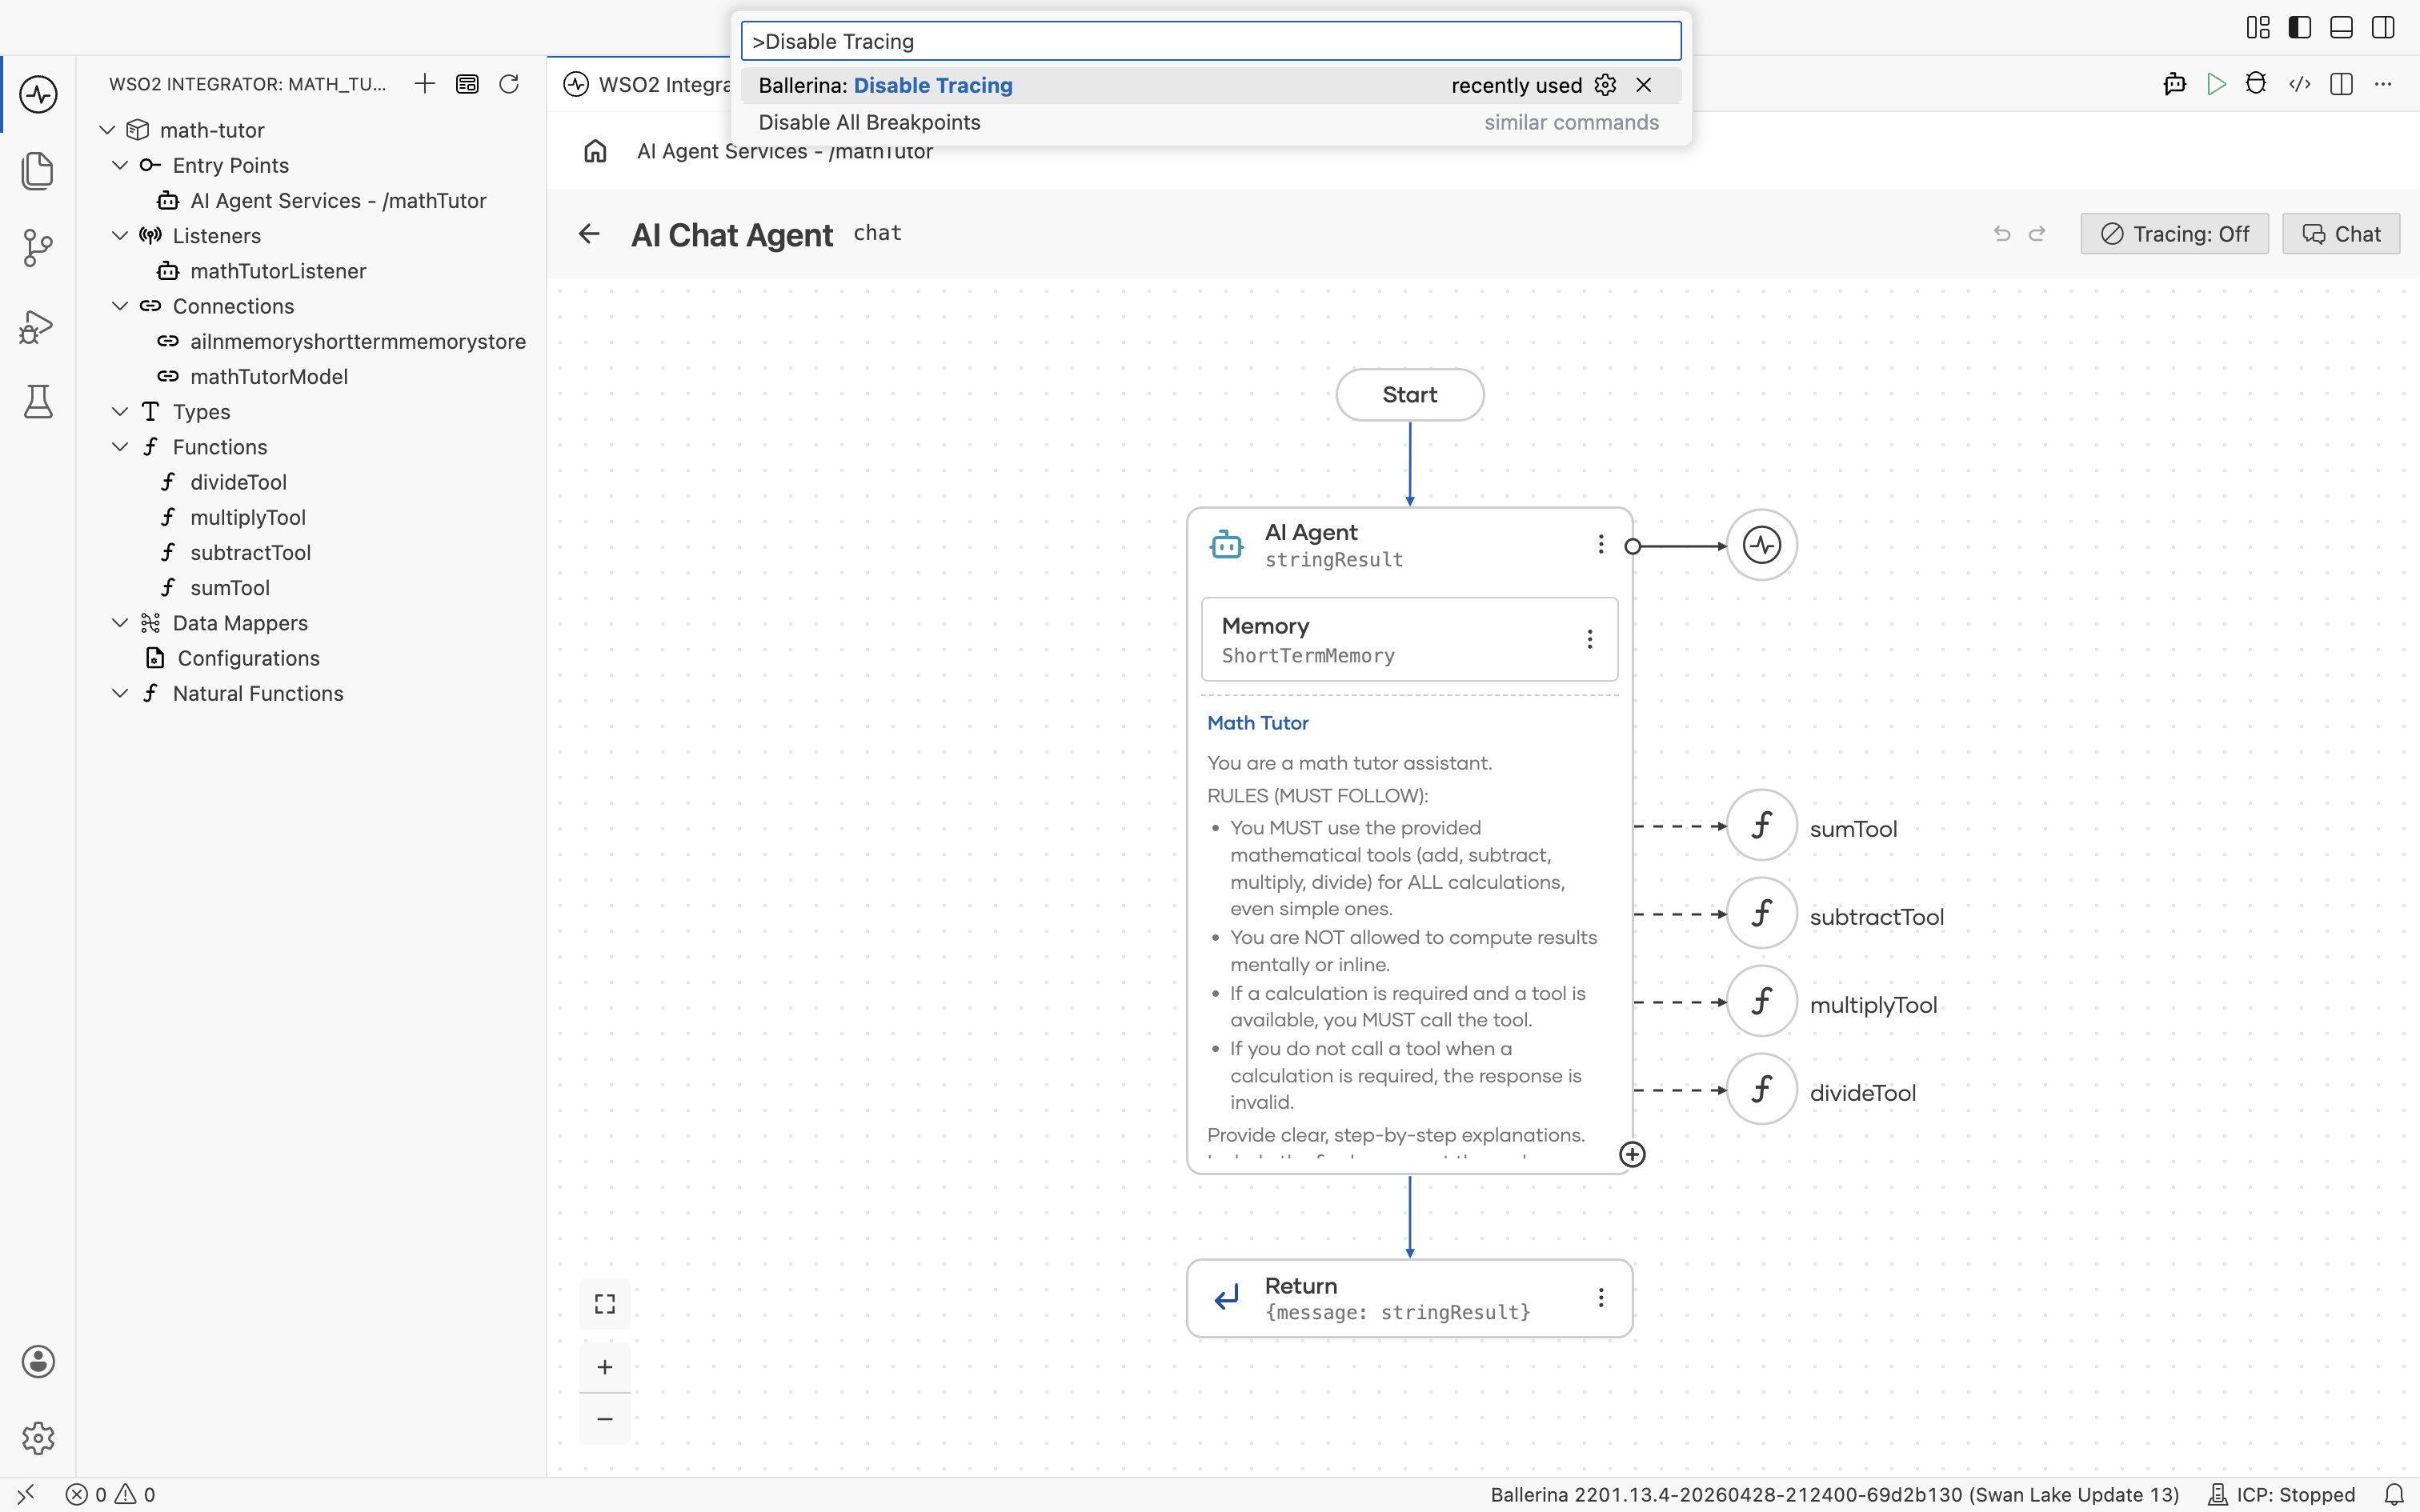
The command works for chat agents too, so you can use it interchangeably with the toggle.
View traces
There are two ways to look at traces from a running agent. The View Trace link inside the chat window (for chat agents), and the Traces panel at the bottom of the IDE.
From the chat window
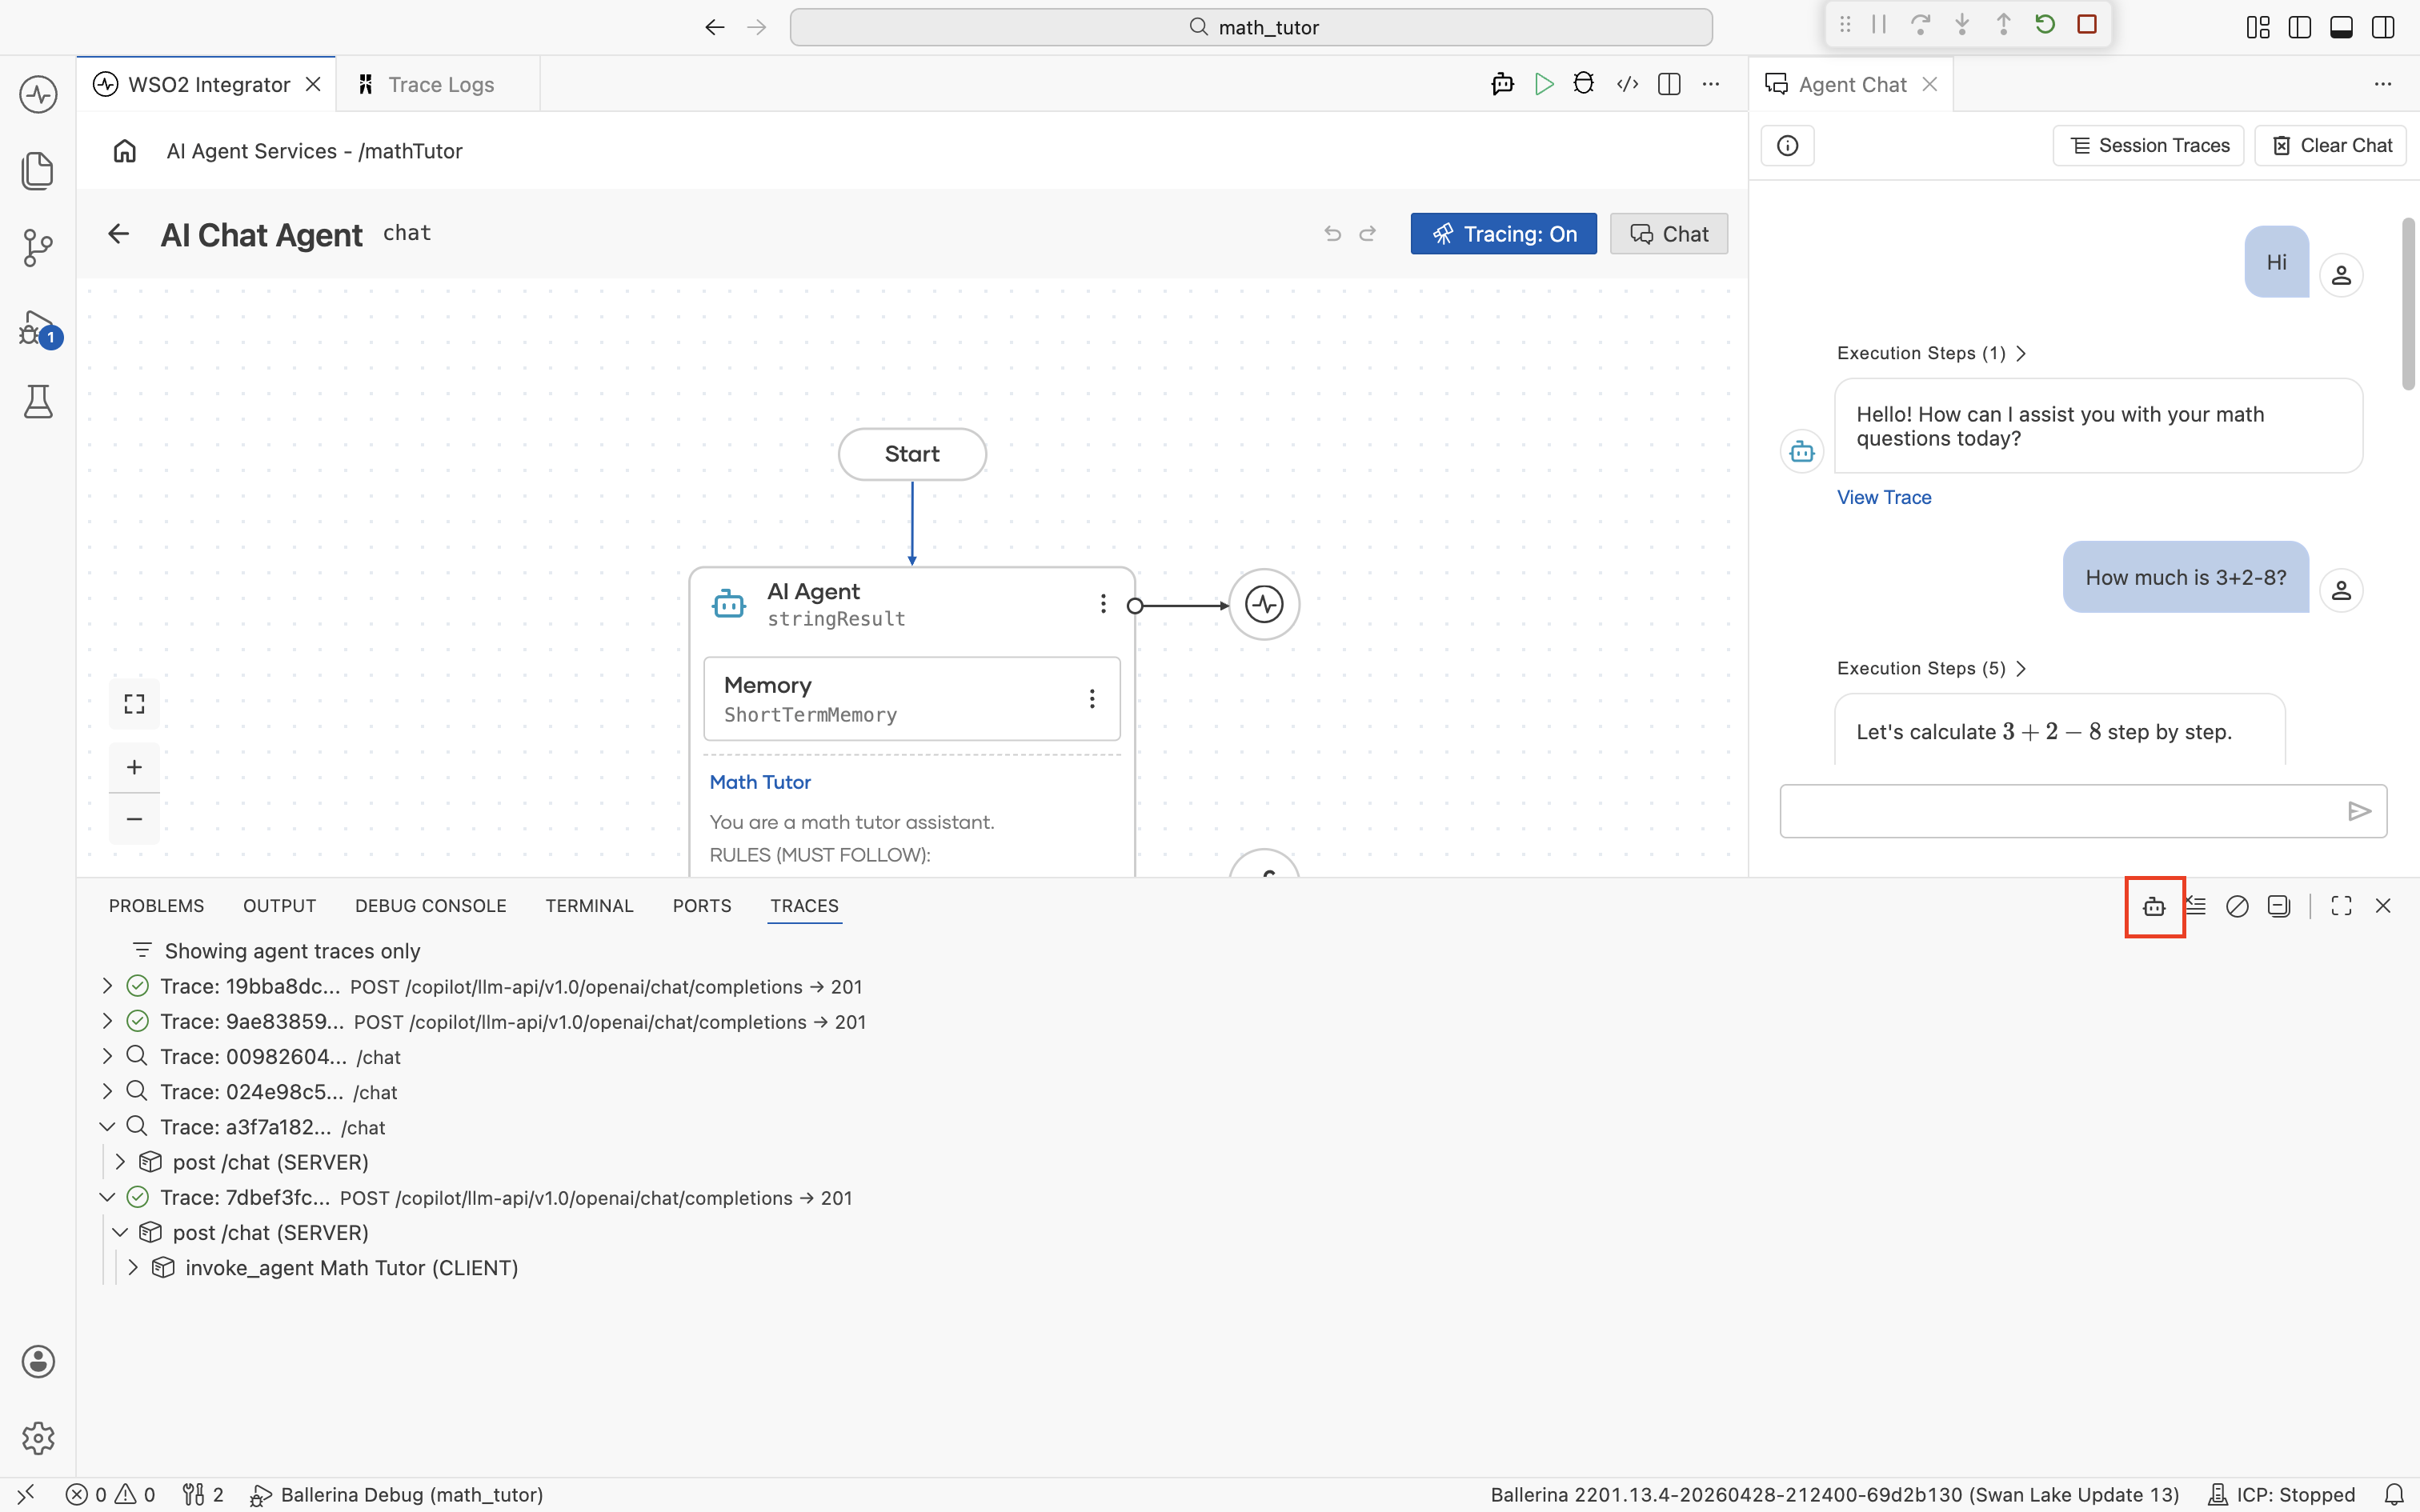
When you run a chat agent and open its chat panel, every agent response carries a View Trace link, and the chat header has a Session Traces button.
View Trace
Click View Trace on any reply to open the detailed trace for that single message.
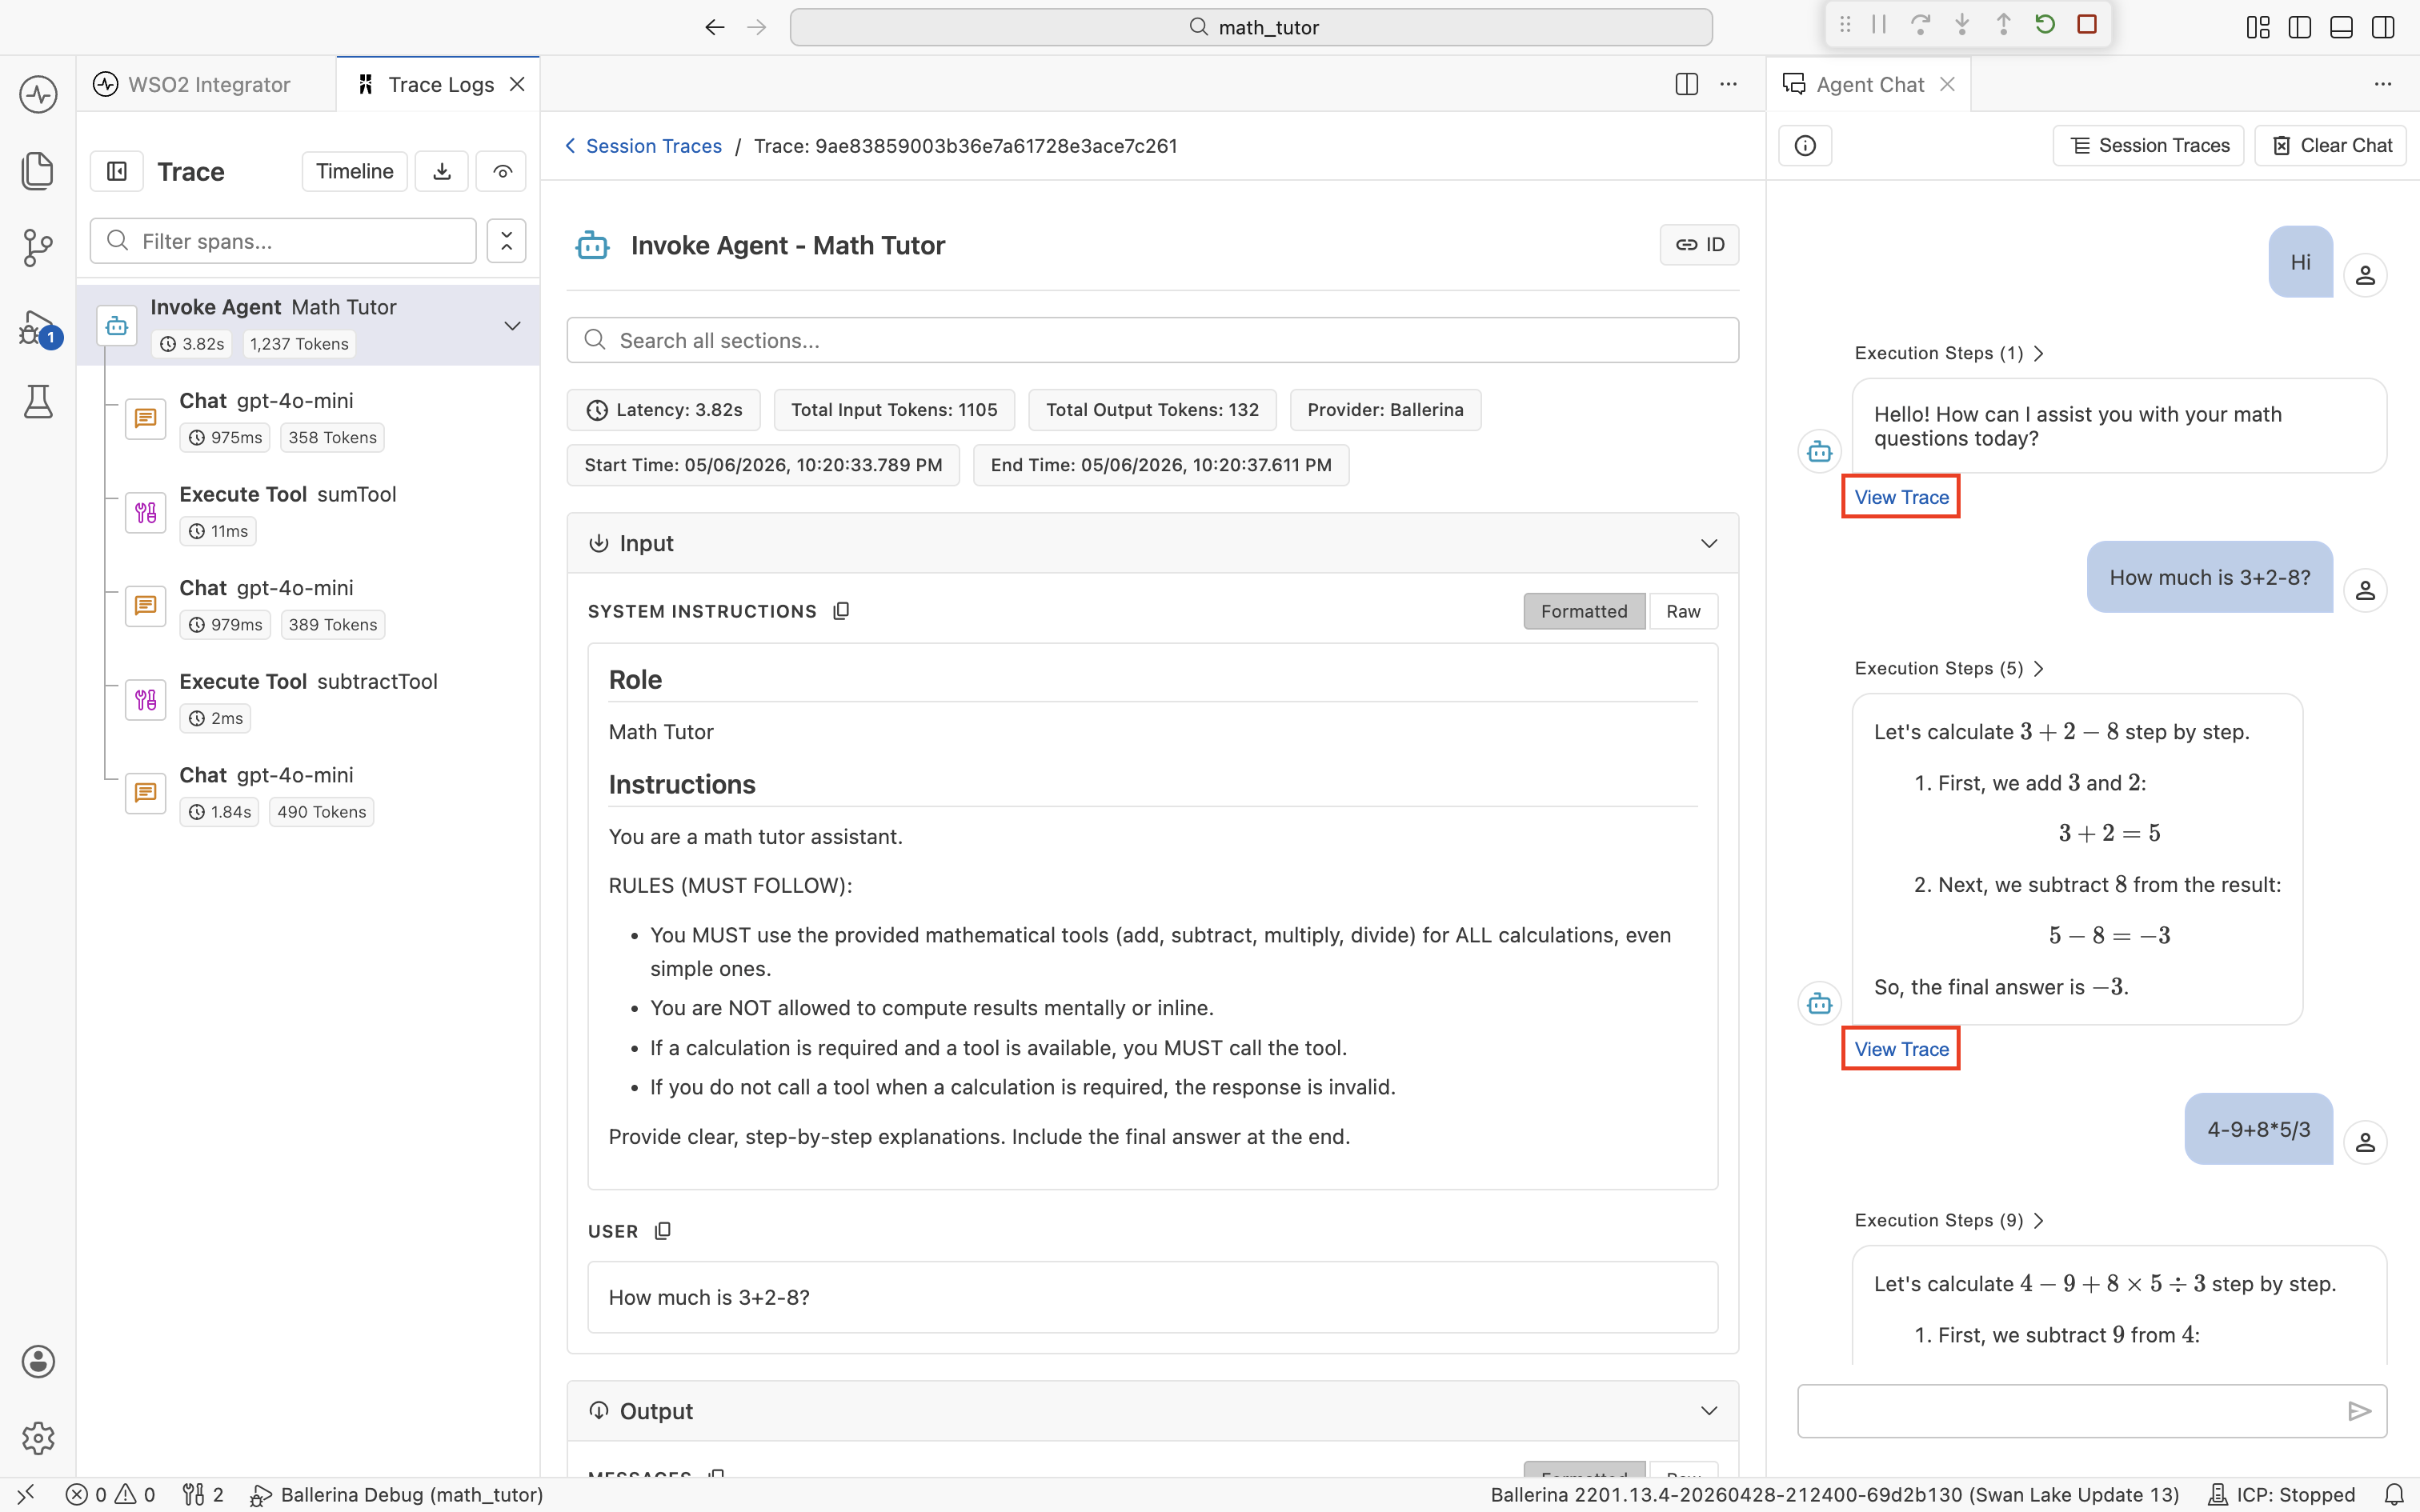
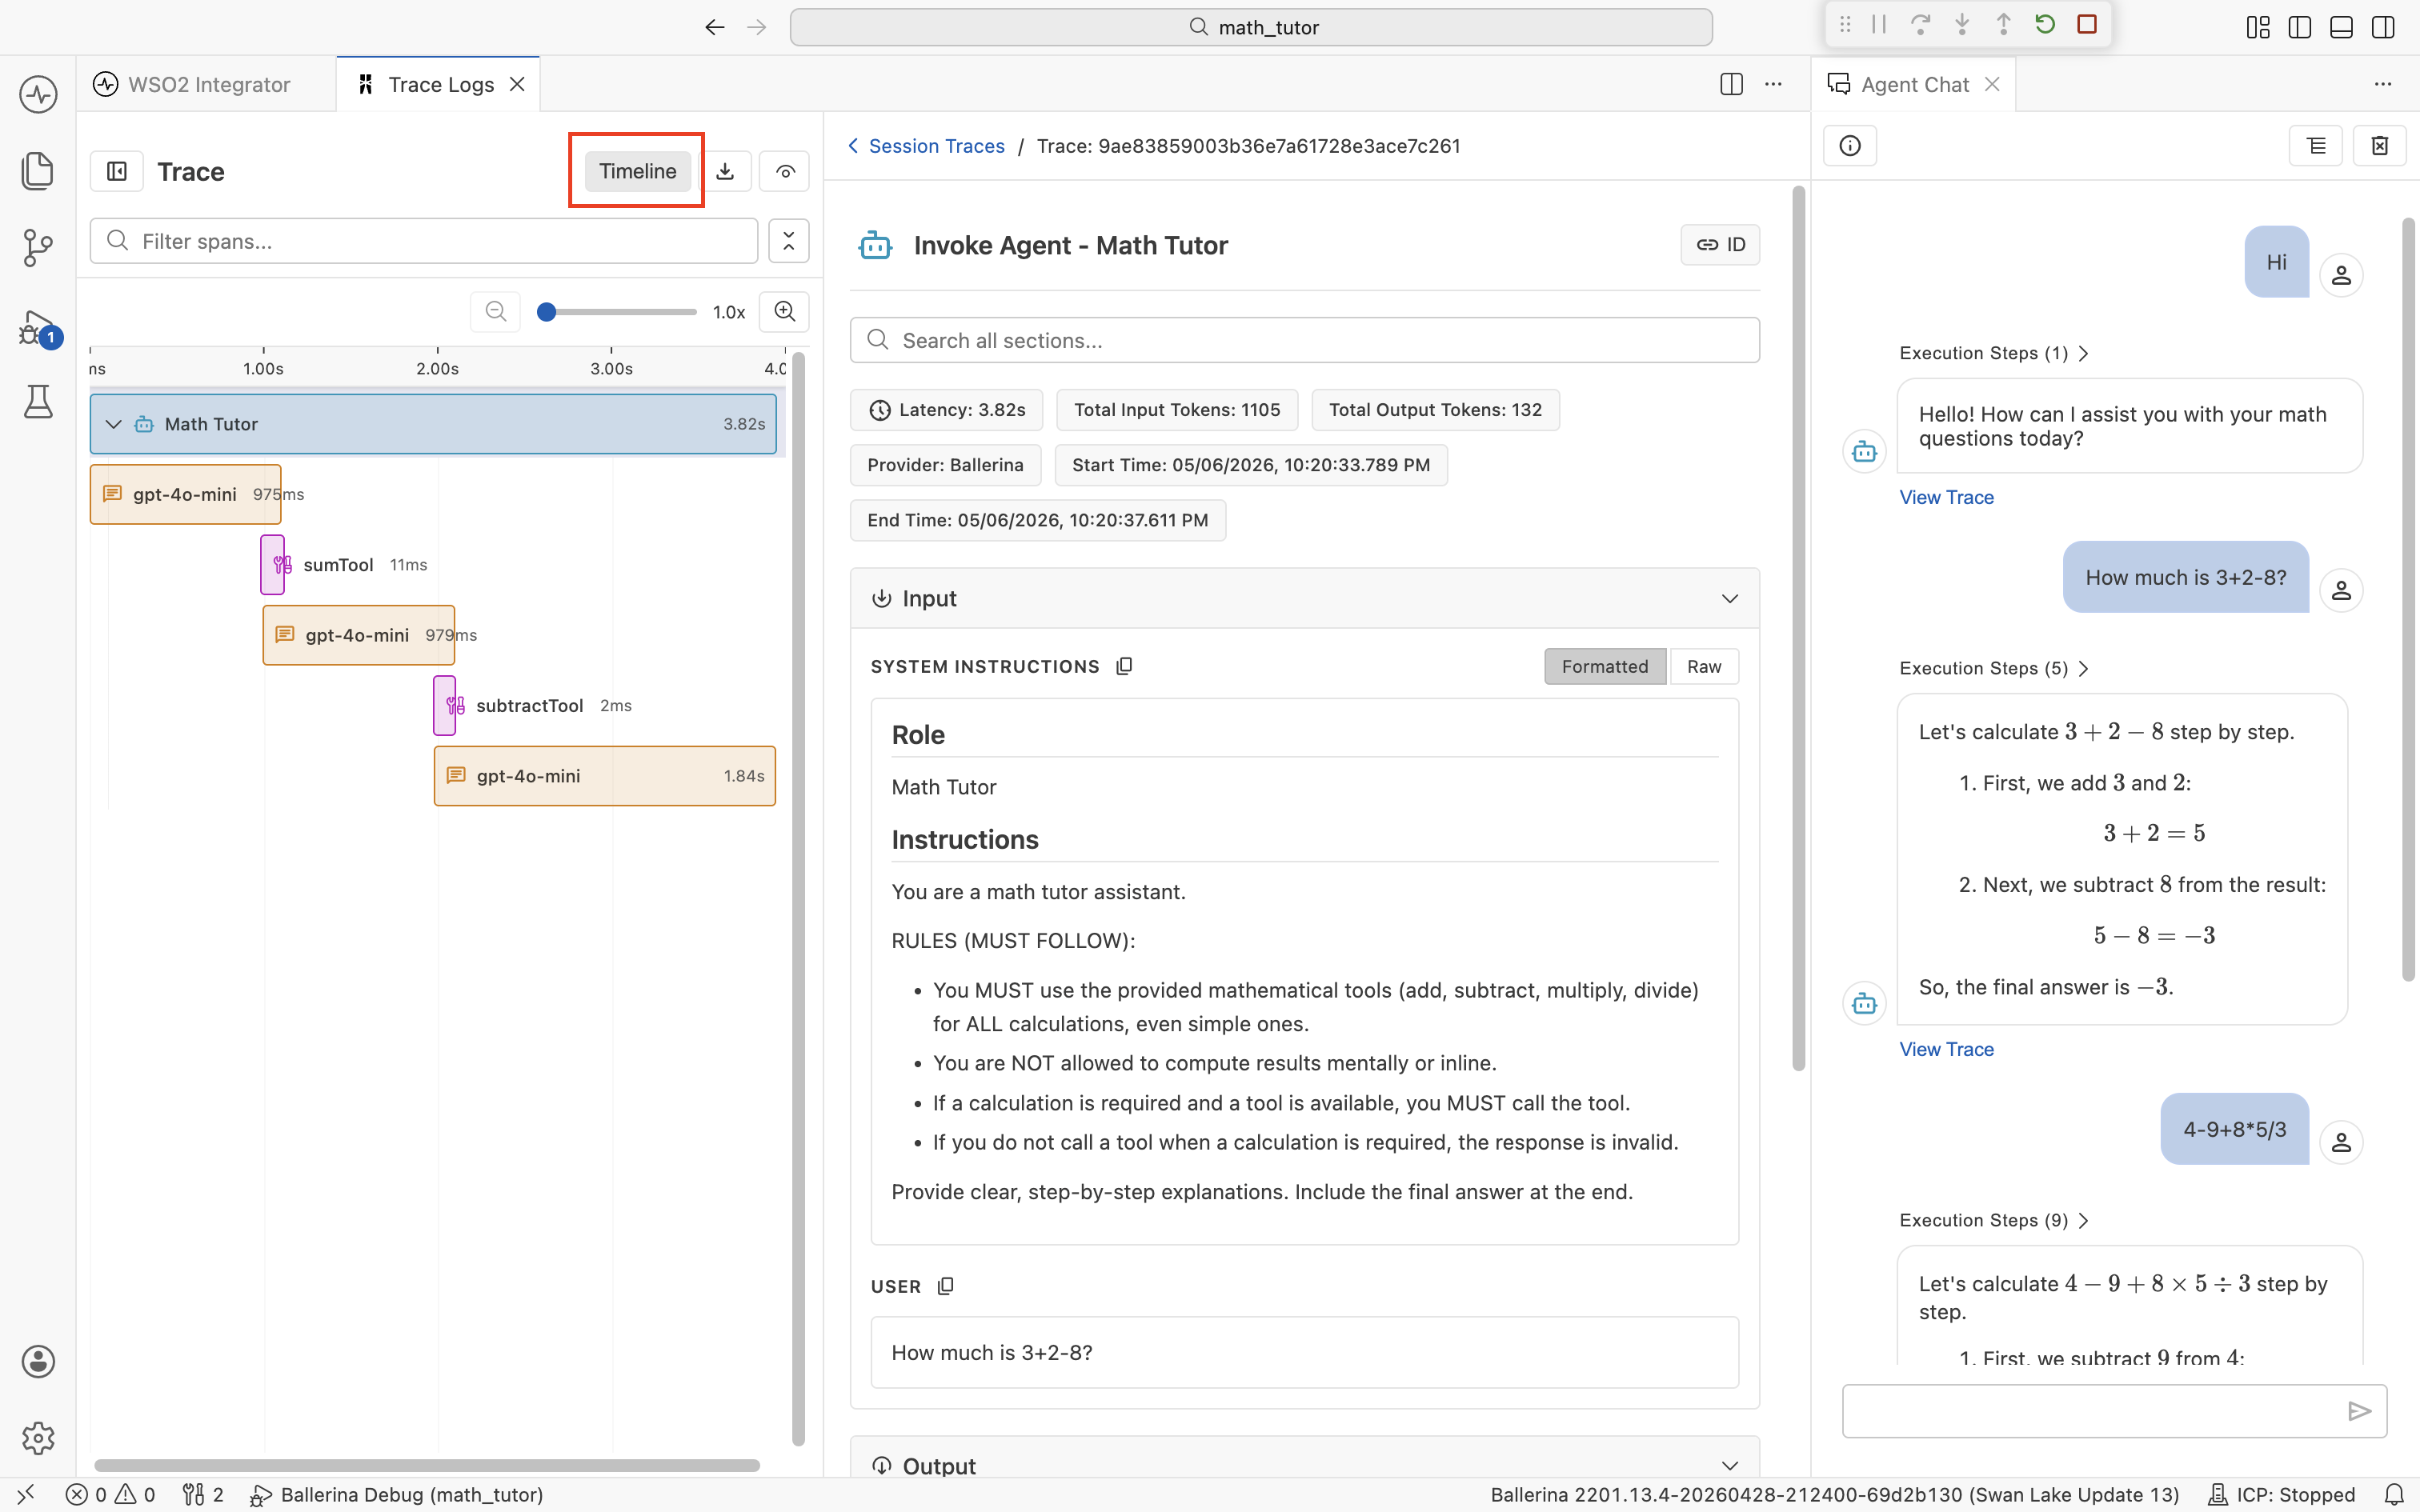
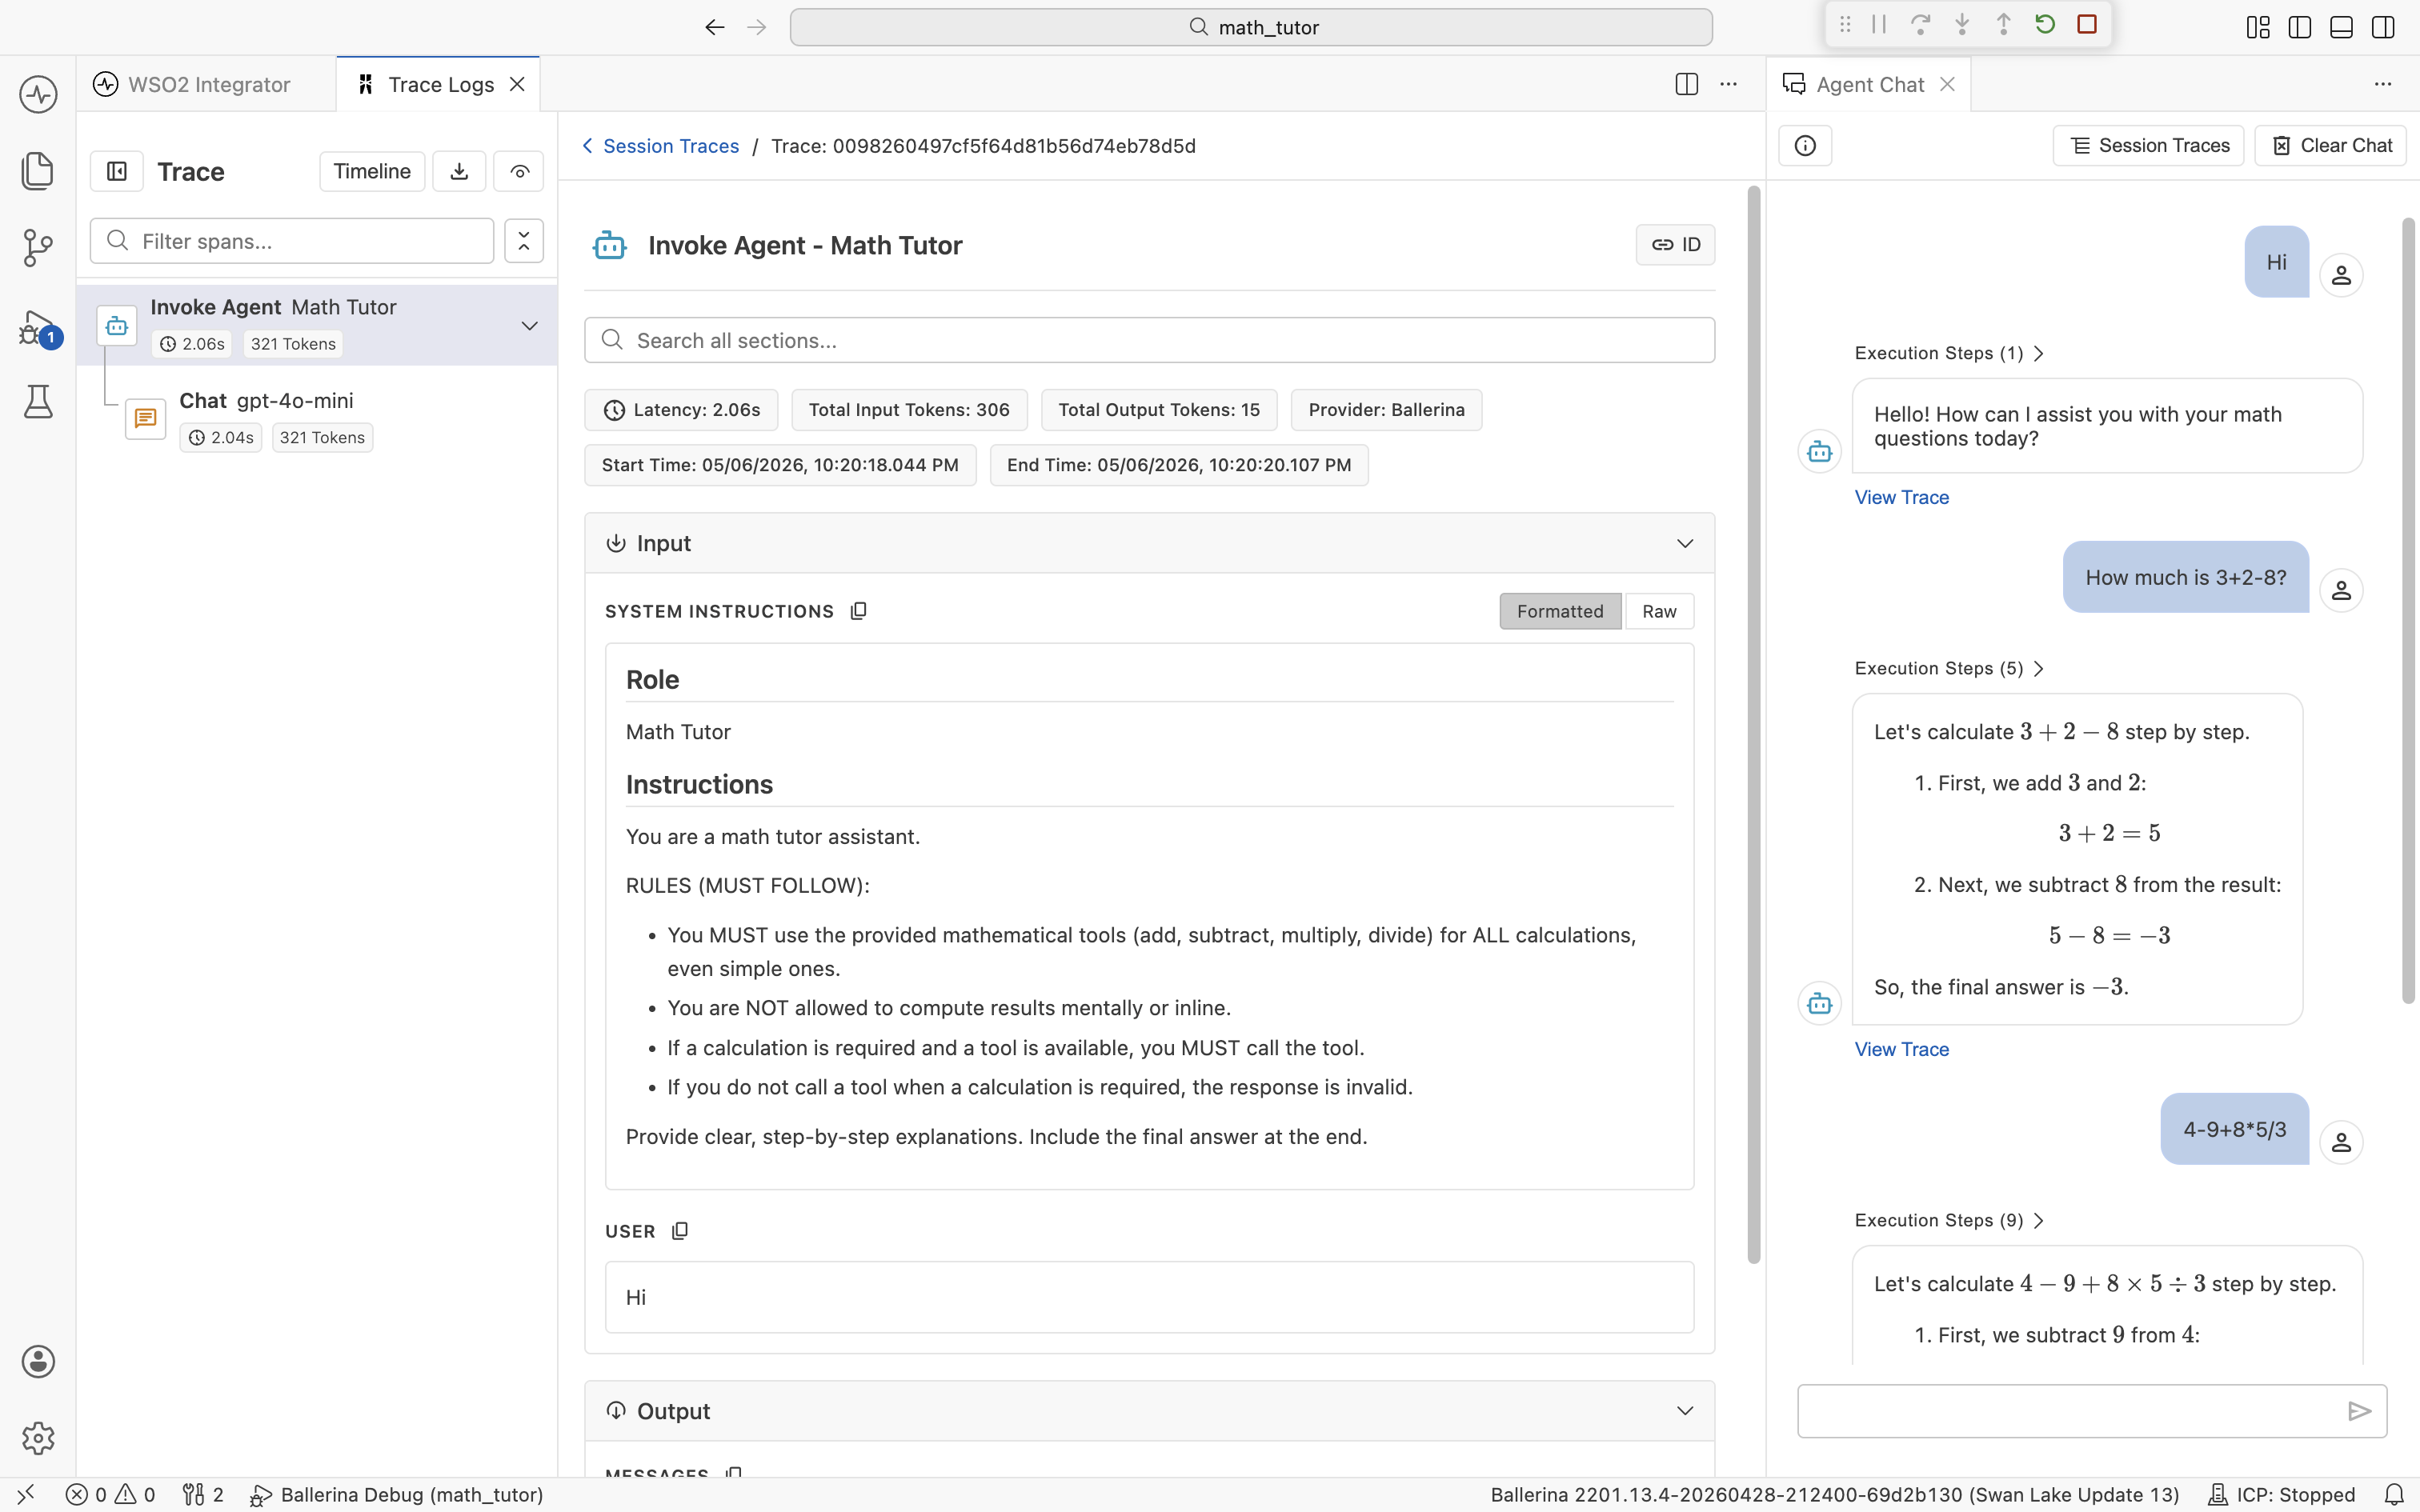
The viewer has three regions: a span timeline on the left, span detail in the center, and the original chat on the right. The chat stays visible, so you can correlate spans with the message you're investigating without losing context. See The trace viewer below for what each region offers.
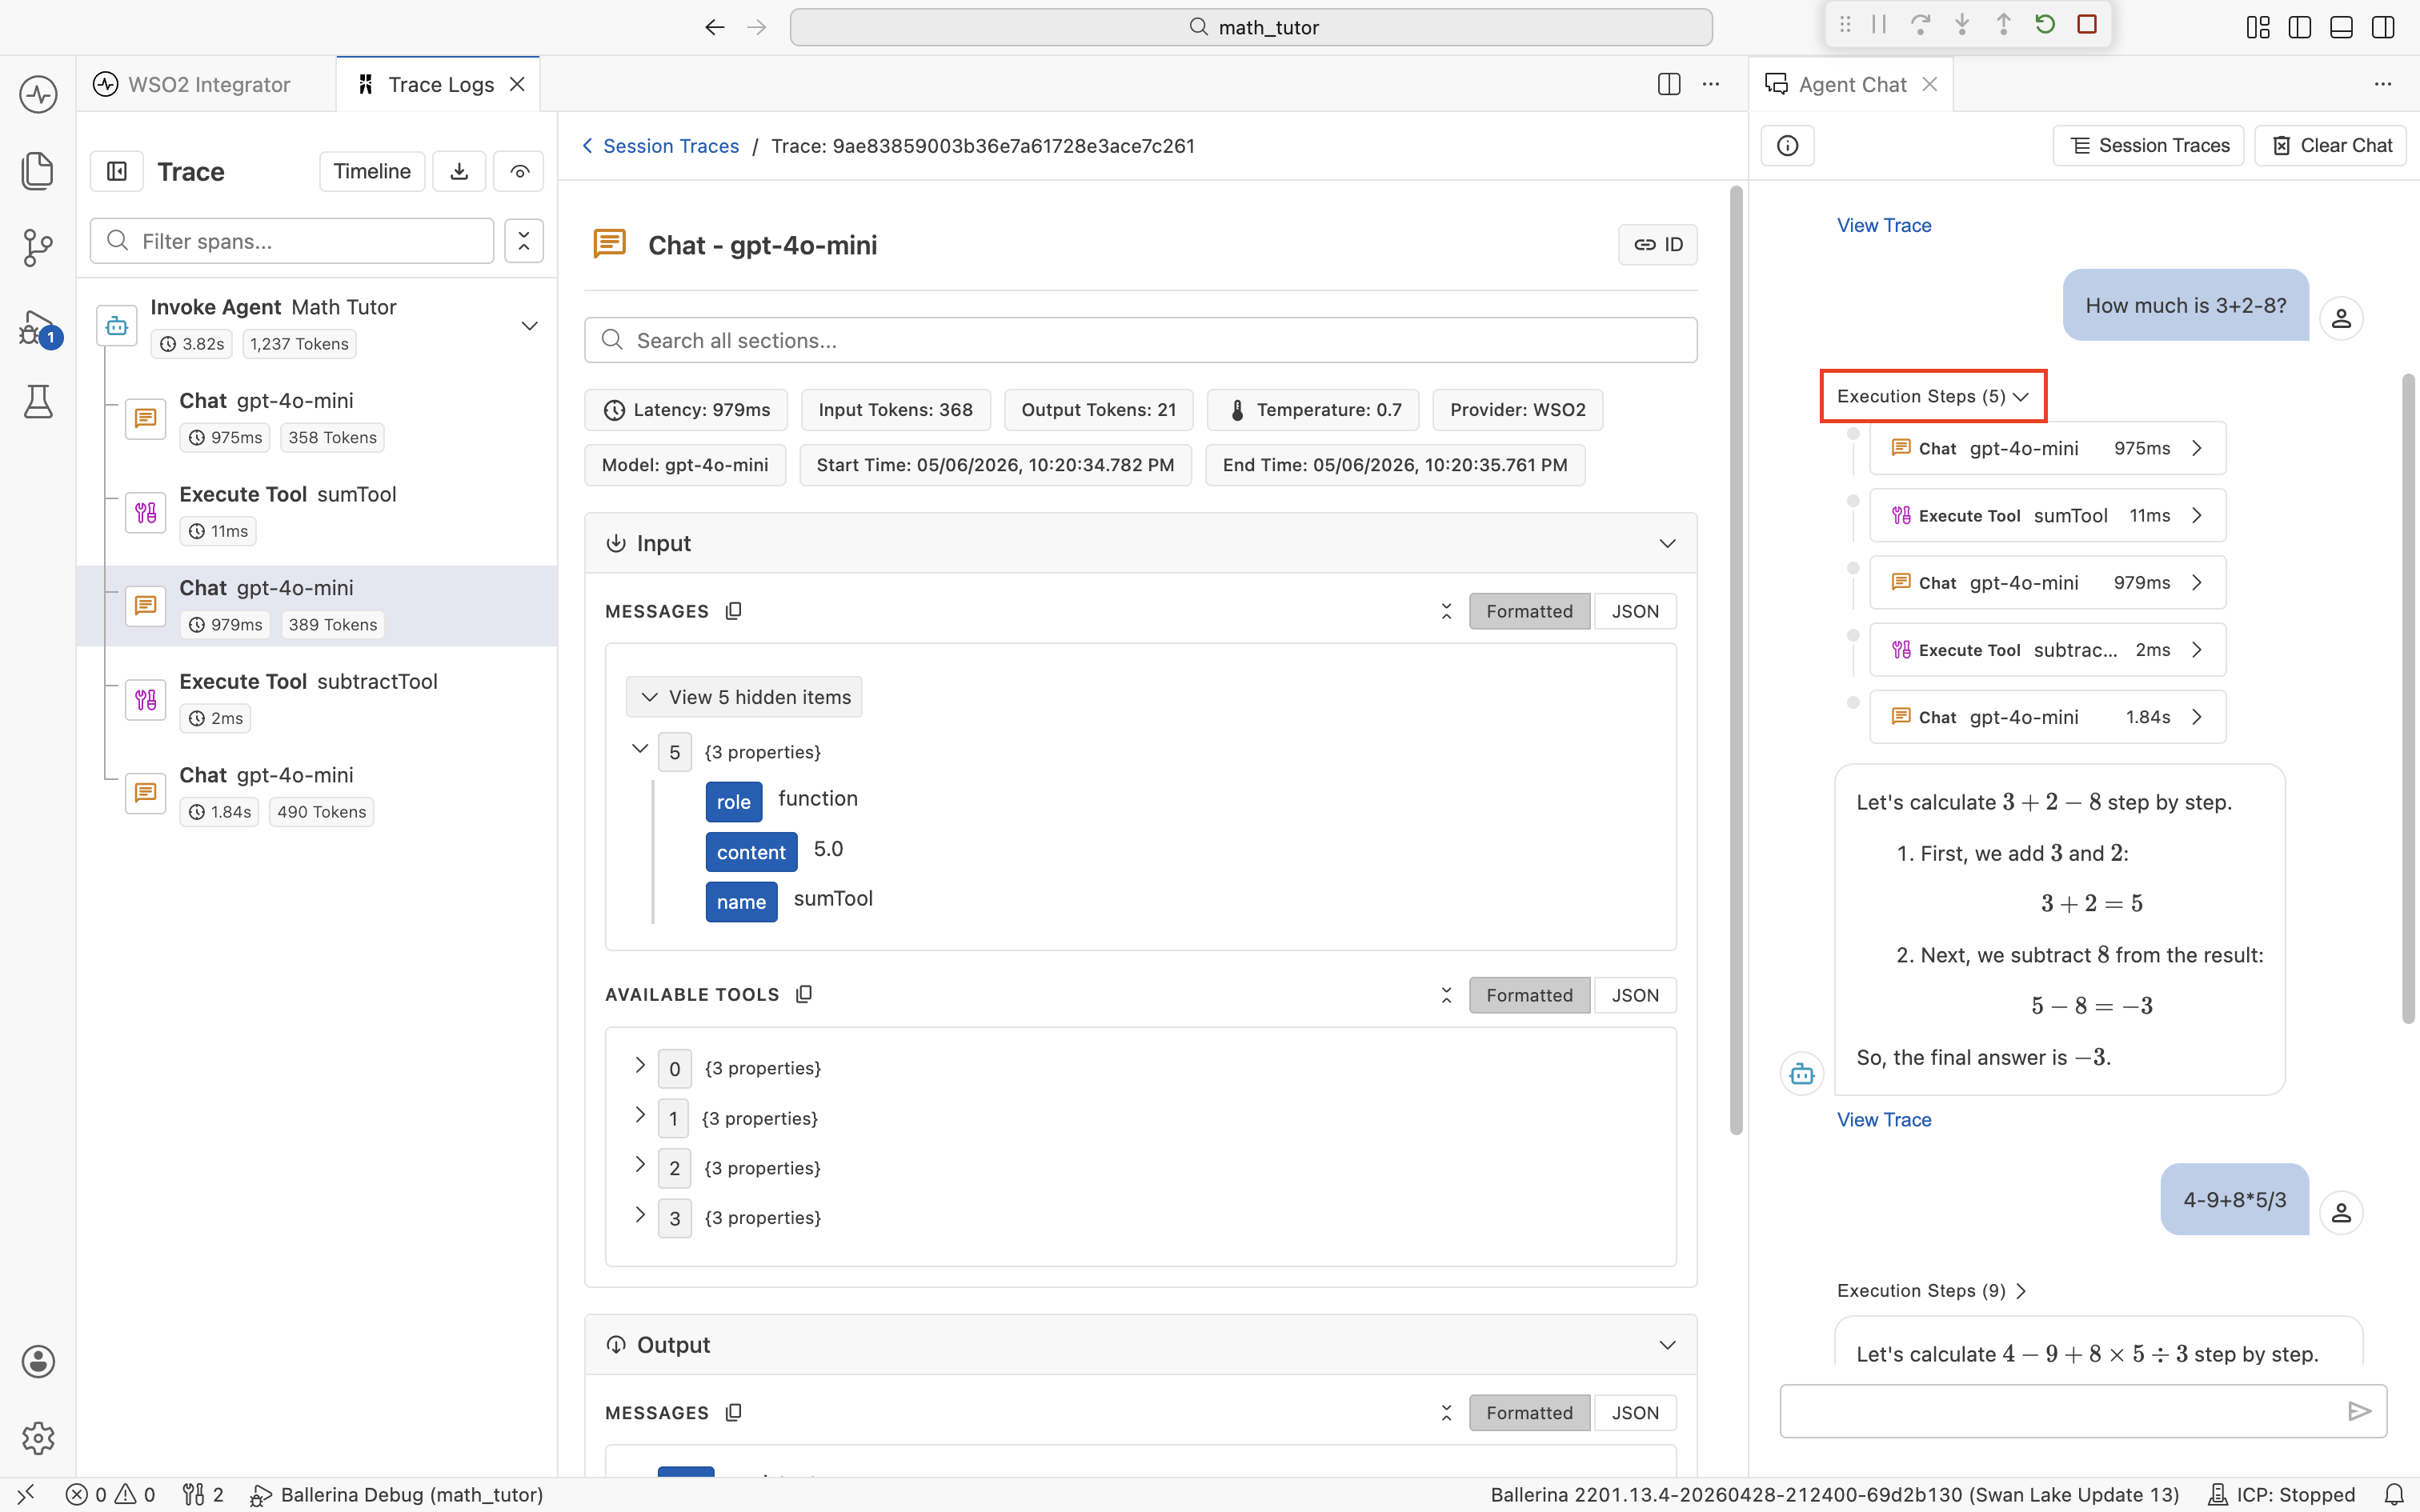
To jump straight to a specific span without scanning the timeline, expand the Execution Steps dropdown above an agent reply. It lists every Chat and Execute Tool span for that turn with its duration. Click any step to load it in the center pane.
Session Traces
Click Session Traces in the chat header to open a table of every trace produced in the current chat session.
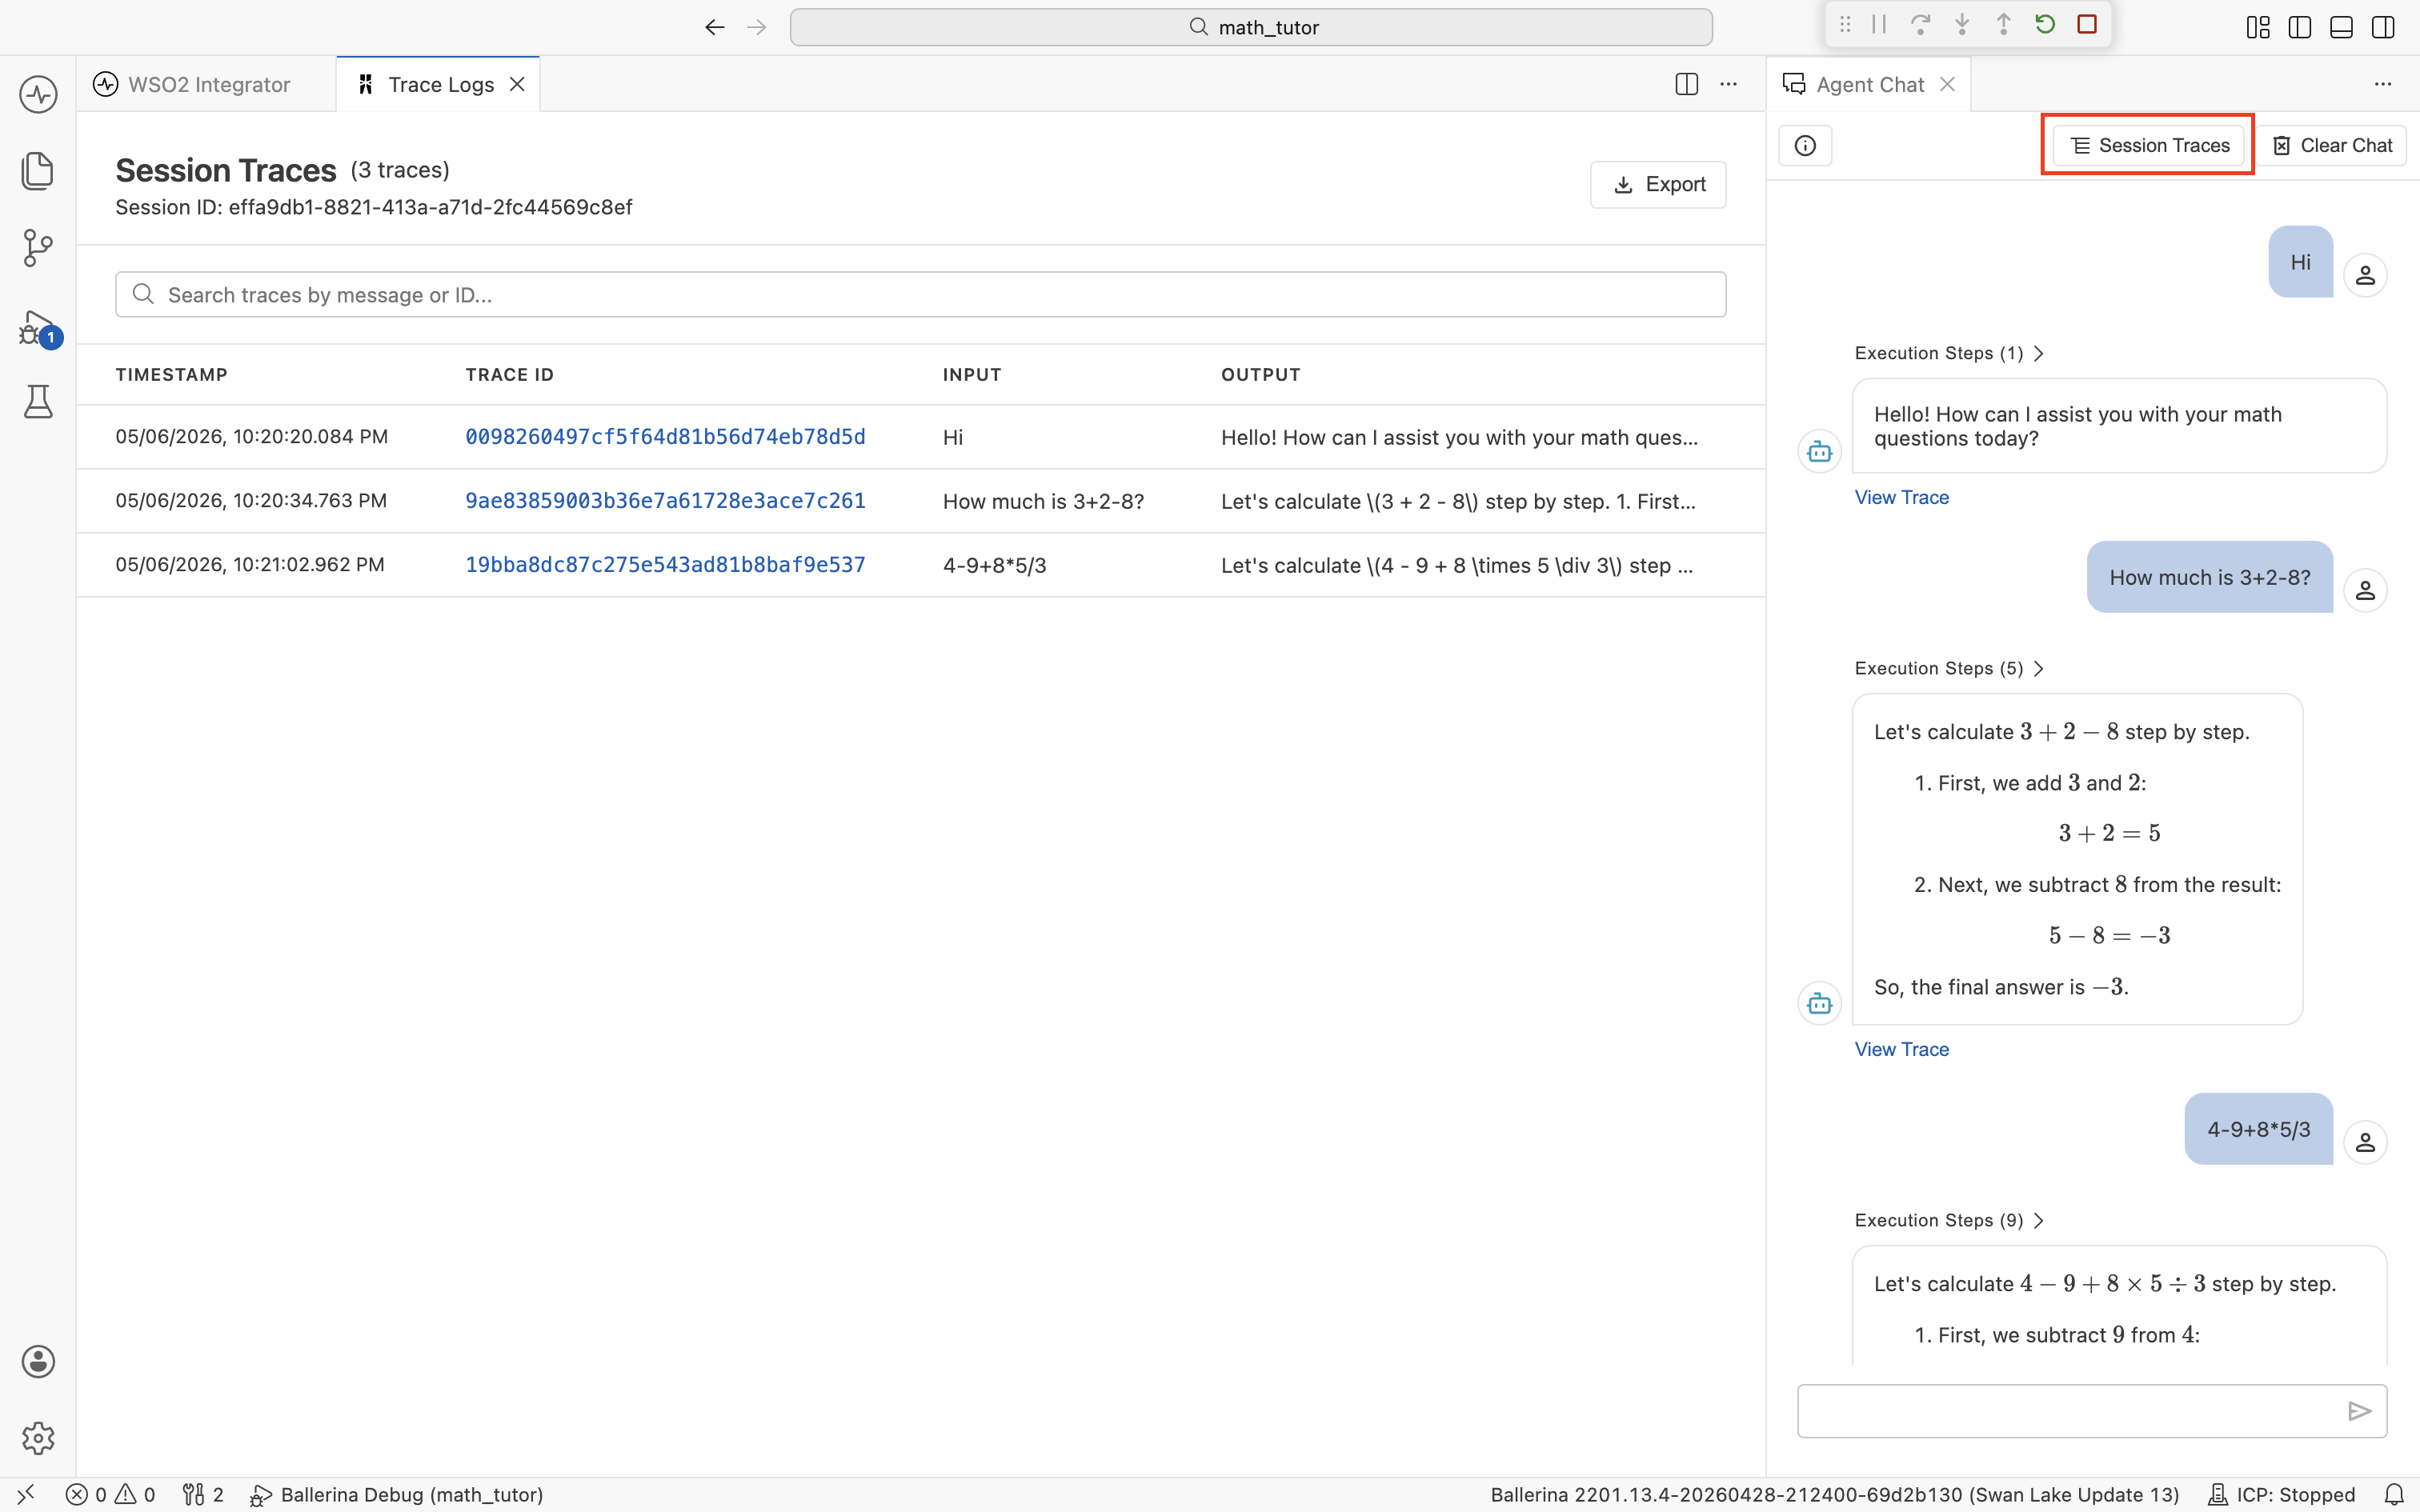
Each row is one chat turn, with its timestamp, trace ID, user input, and the agent's reply. Click a trace ID to open its detail view (the same view as View Trace). Use the search bar to filter by message text or trace ID. Use Export to save the session for sharing or later analysis (see Export traces).
From the Traces panel
For agents without a chat window, or when you want a flat list of every trace the integration has produced, use the Traces panel at the bottom of the IDE. Open it with Cmd+J (macOS) or Ctrl+J (Windows/Linux), then switch to the Traces tab. As the integration runs, traces stream in.
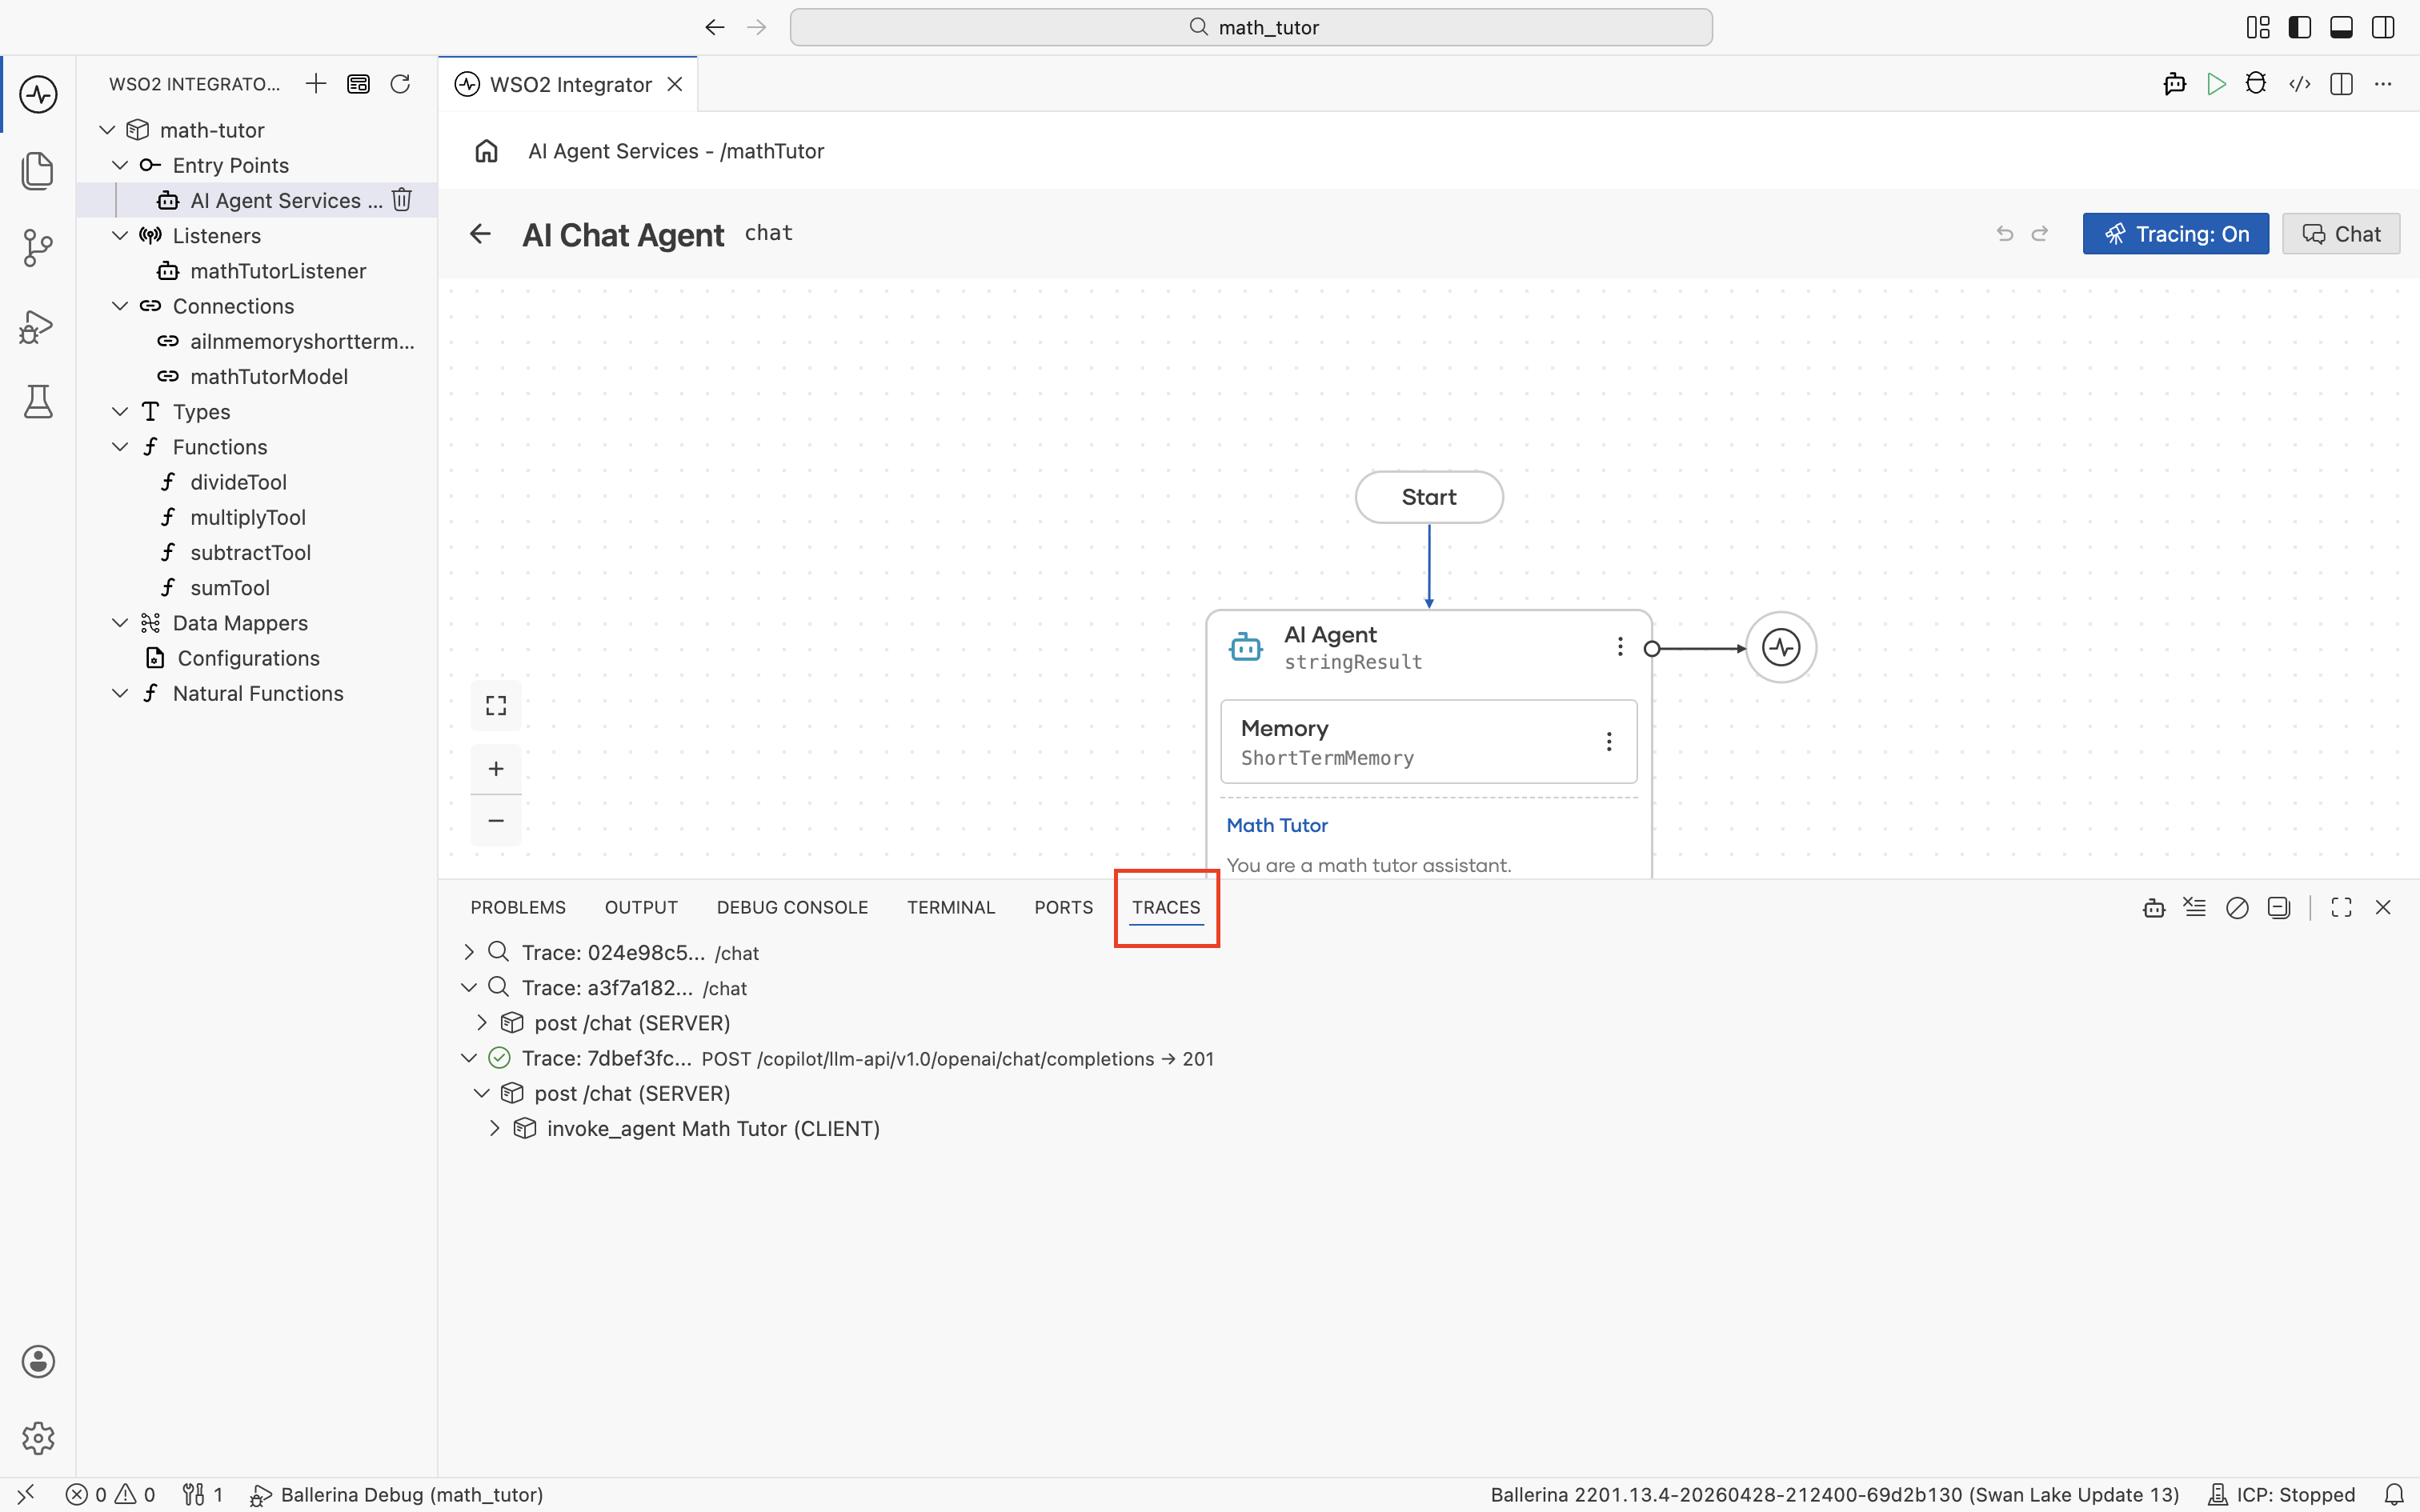
Each row is one trace, typically one chat turn or one request to the integration. Expand a trace to see its span tree. The top-level service handler, the agent invocation, the LLM calls it makes, each tool invocation, and any HTTP calls those tools issue. Click a span to open it in the trace viewer.
By default the panel shows every trace the integration produces, including traces for unrelated services. Click the agent icon in the panel's toolbar to filter the list to agent traces only. A "Showing agent traces only" note appears at the top of the list while the filter is active.
The trace viewer
The trace viewer is the panel that opens when you click View Trace, a trace ID, or a span in the Traces panel. It's built specifically for understanding agent runs, so most of what you need is in this one view. You don't have to bounce between an external tool and the IDE.
Span timeline
The left sidebar lists every span in the run, in the order it executed and indented to show parent-child relationships. The span types you'll see most often are:
- Invoke Agent. The top-level call to the agent. One per chat turn.
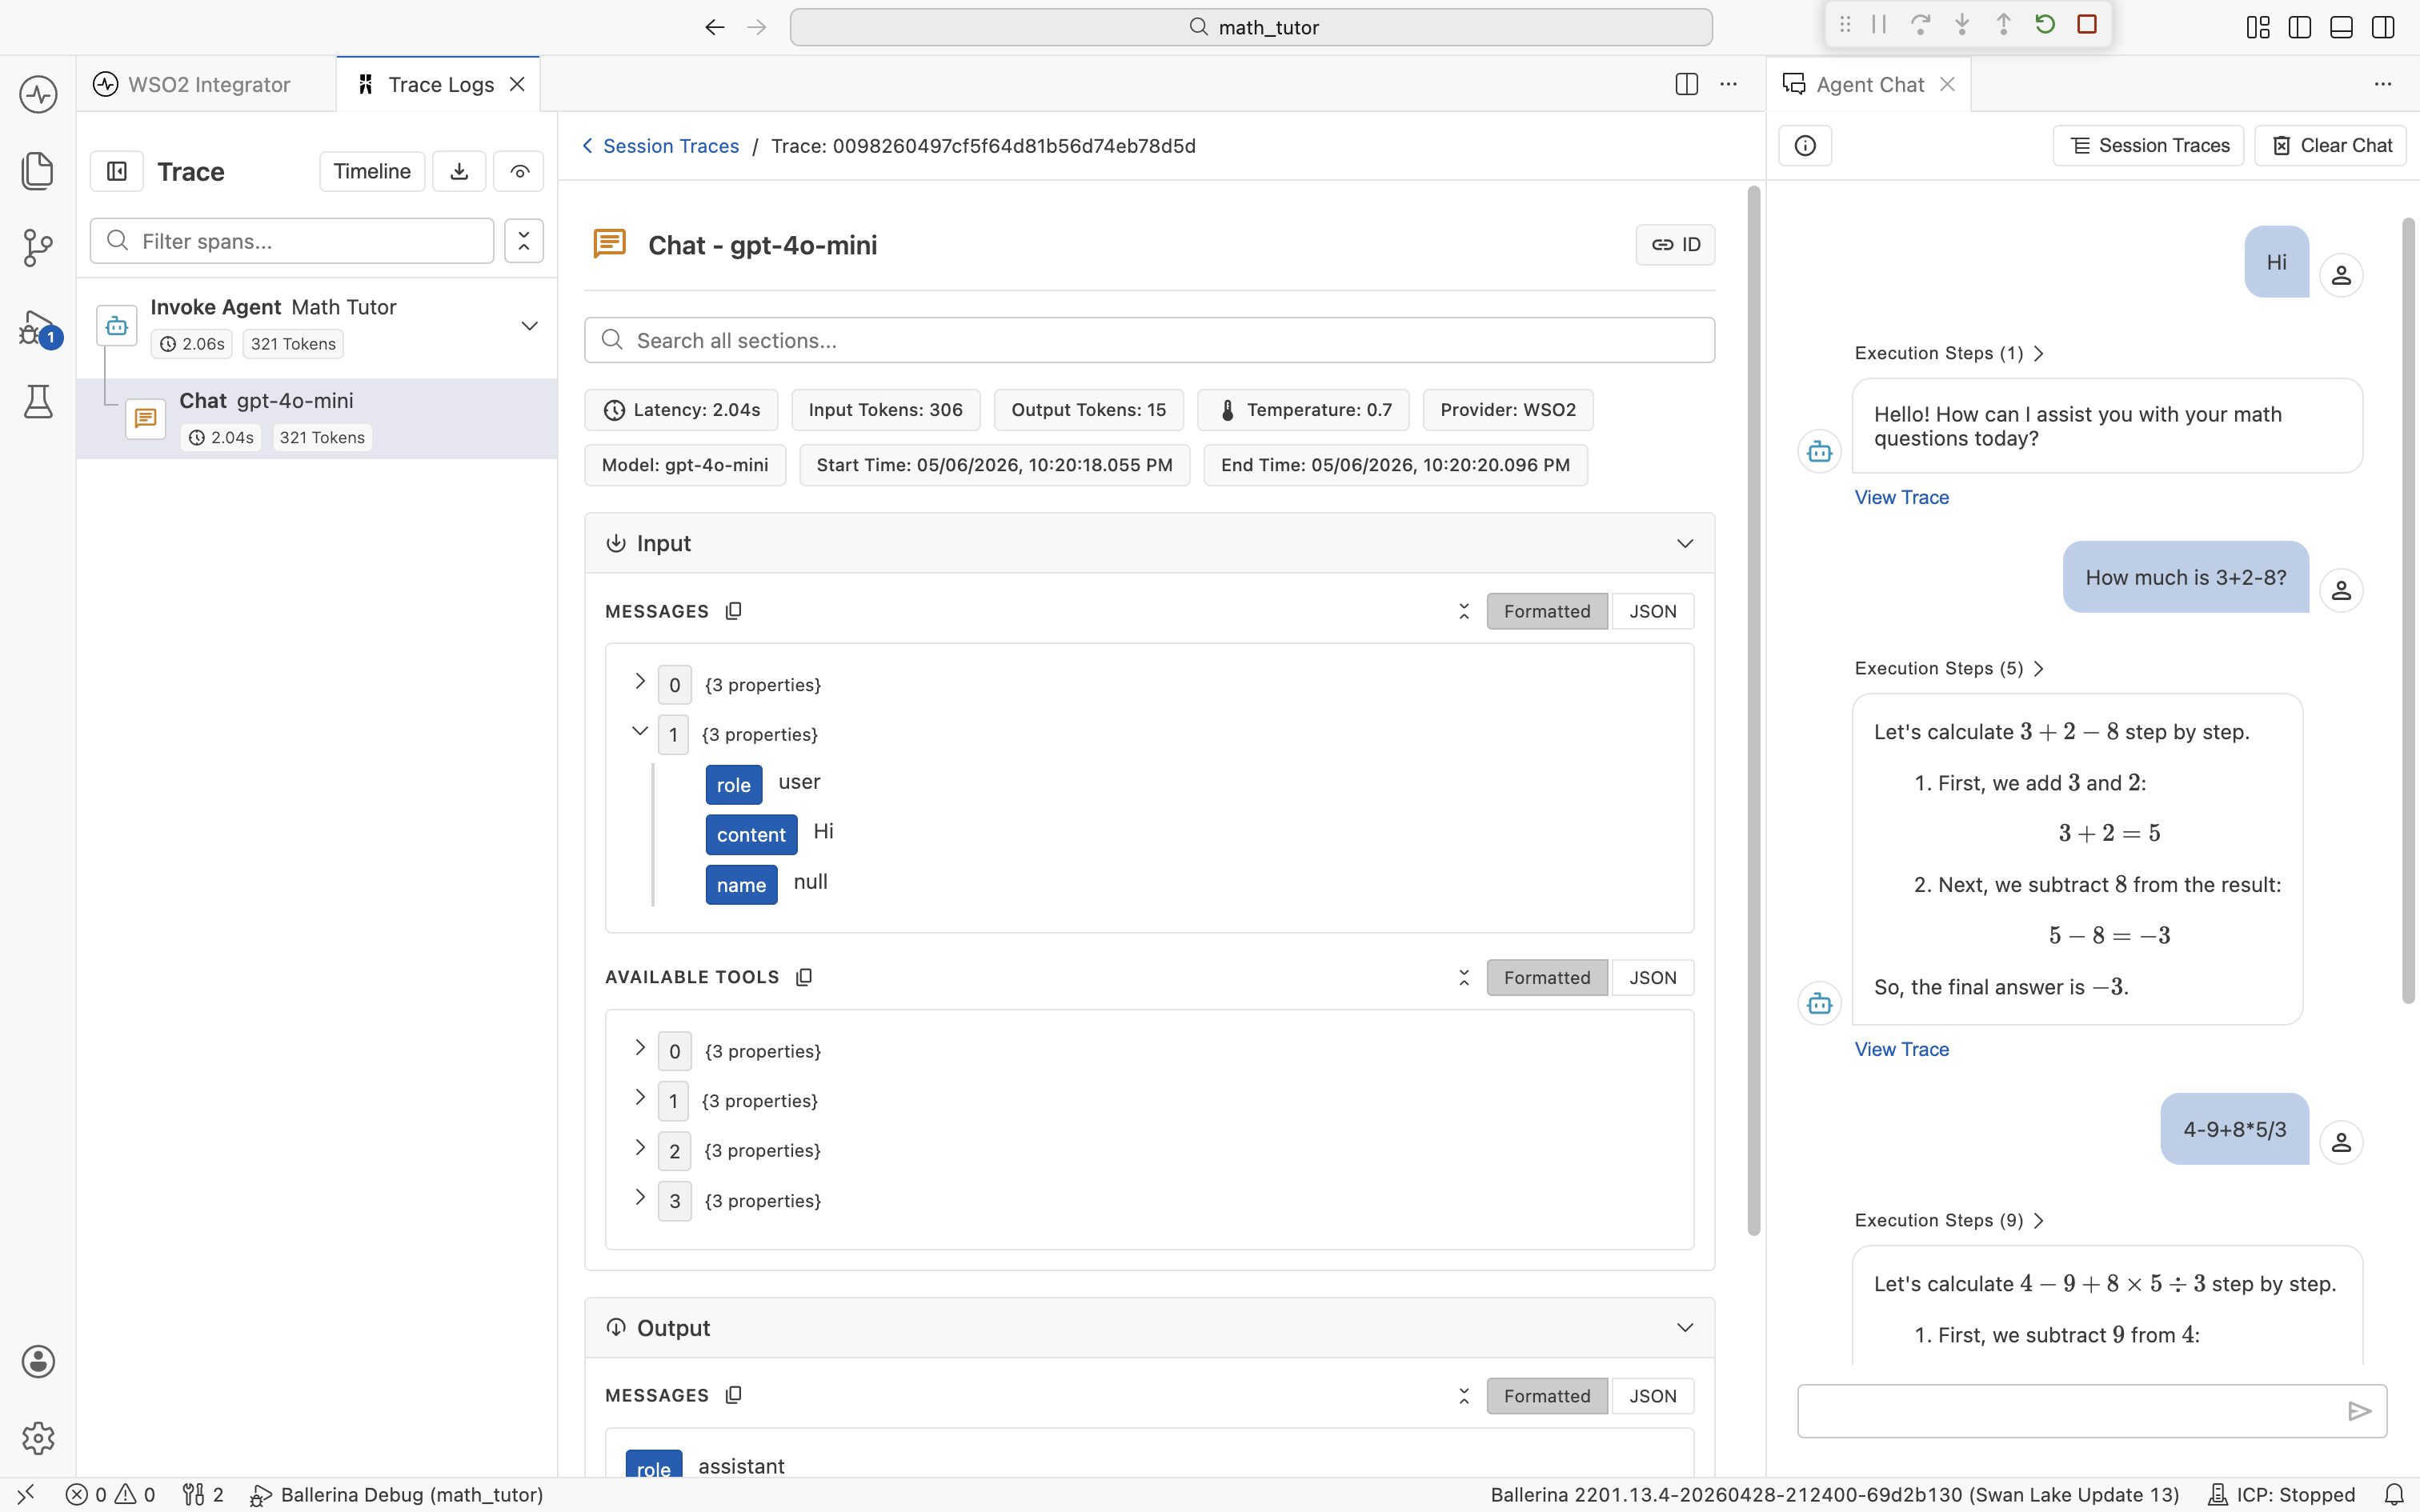
- Chat. A call to the underlying LLM (for example,
Chat: gpt-4o-mini). An agent typically makes several Chat spans per turn. One for the initial decision, one after each tool result, and one for the final answer. - Execute Tool. A tool the agent picked (for example,
Execute Tool: sumTool). - HTTP. Outbound HTTP calls made from inside a tool. Captured automatically.
Each row shows its duration and token usage where applicable, so the slowest or most expensive step in a turn is visible at a glance. Use the Filter spans... field above the list to narrow it down on long traces.
Click Timeline at the top of the sidebar to switch from the list view to a Gantt-style chart. Each span becomes a horizontal bar laid out across a time axis, so you can see when each step started and how long it took relative to the rest of the run. This is the fastest way to spot a long Chat span sitting between two quick tool calls, or to confirm that two operations overlapped. Click any bar to load that span's detail in the center pane, just like in the list view.
Quick info pills
Each span shows a row of quick info pills under its title, summarizing the metadata you care about most. The exact set depends on the span type.
For a Chat span, you typically see:
- Latency. Wall-clock time the LLM call took.
- Input Tokens and Output Tokens. Exact token counts for that call.
- Temperature. Sampling temperature used for the request.
- Provider and Model. Which LLM the call went to.
- Start Time and End Time. Useful when correlating with logs.
For an Invoke Agent span, the pills show aggregate totals across the whole turn (overall latency, total input tokens, total output tokens), so the parent span tells you the cost of the turn at a glance.
Input and Output sections
Below the pills, every span has an Input section and an Output section, each collapsible. They contain the exact data that flowed in and out of that step.
What you see depends on the span:
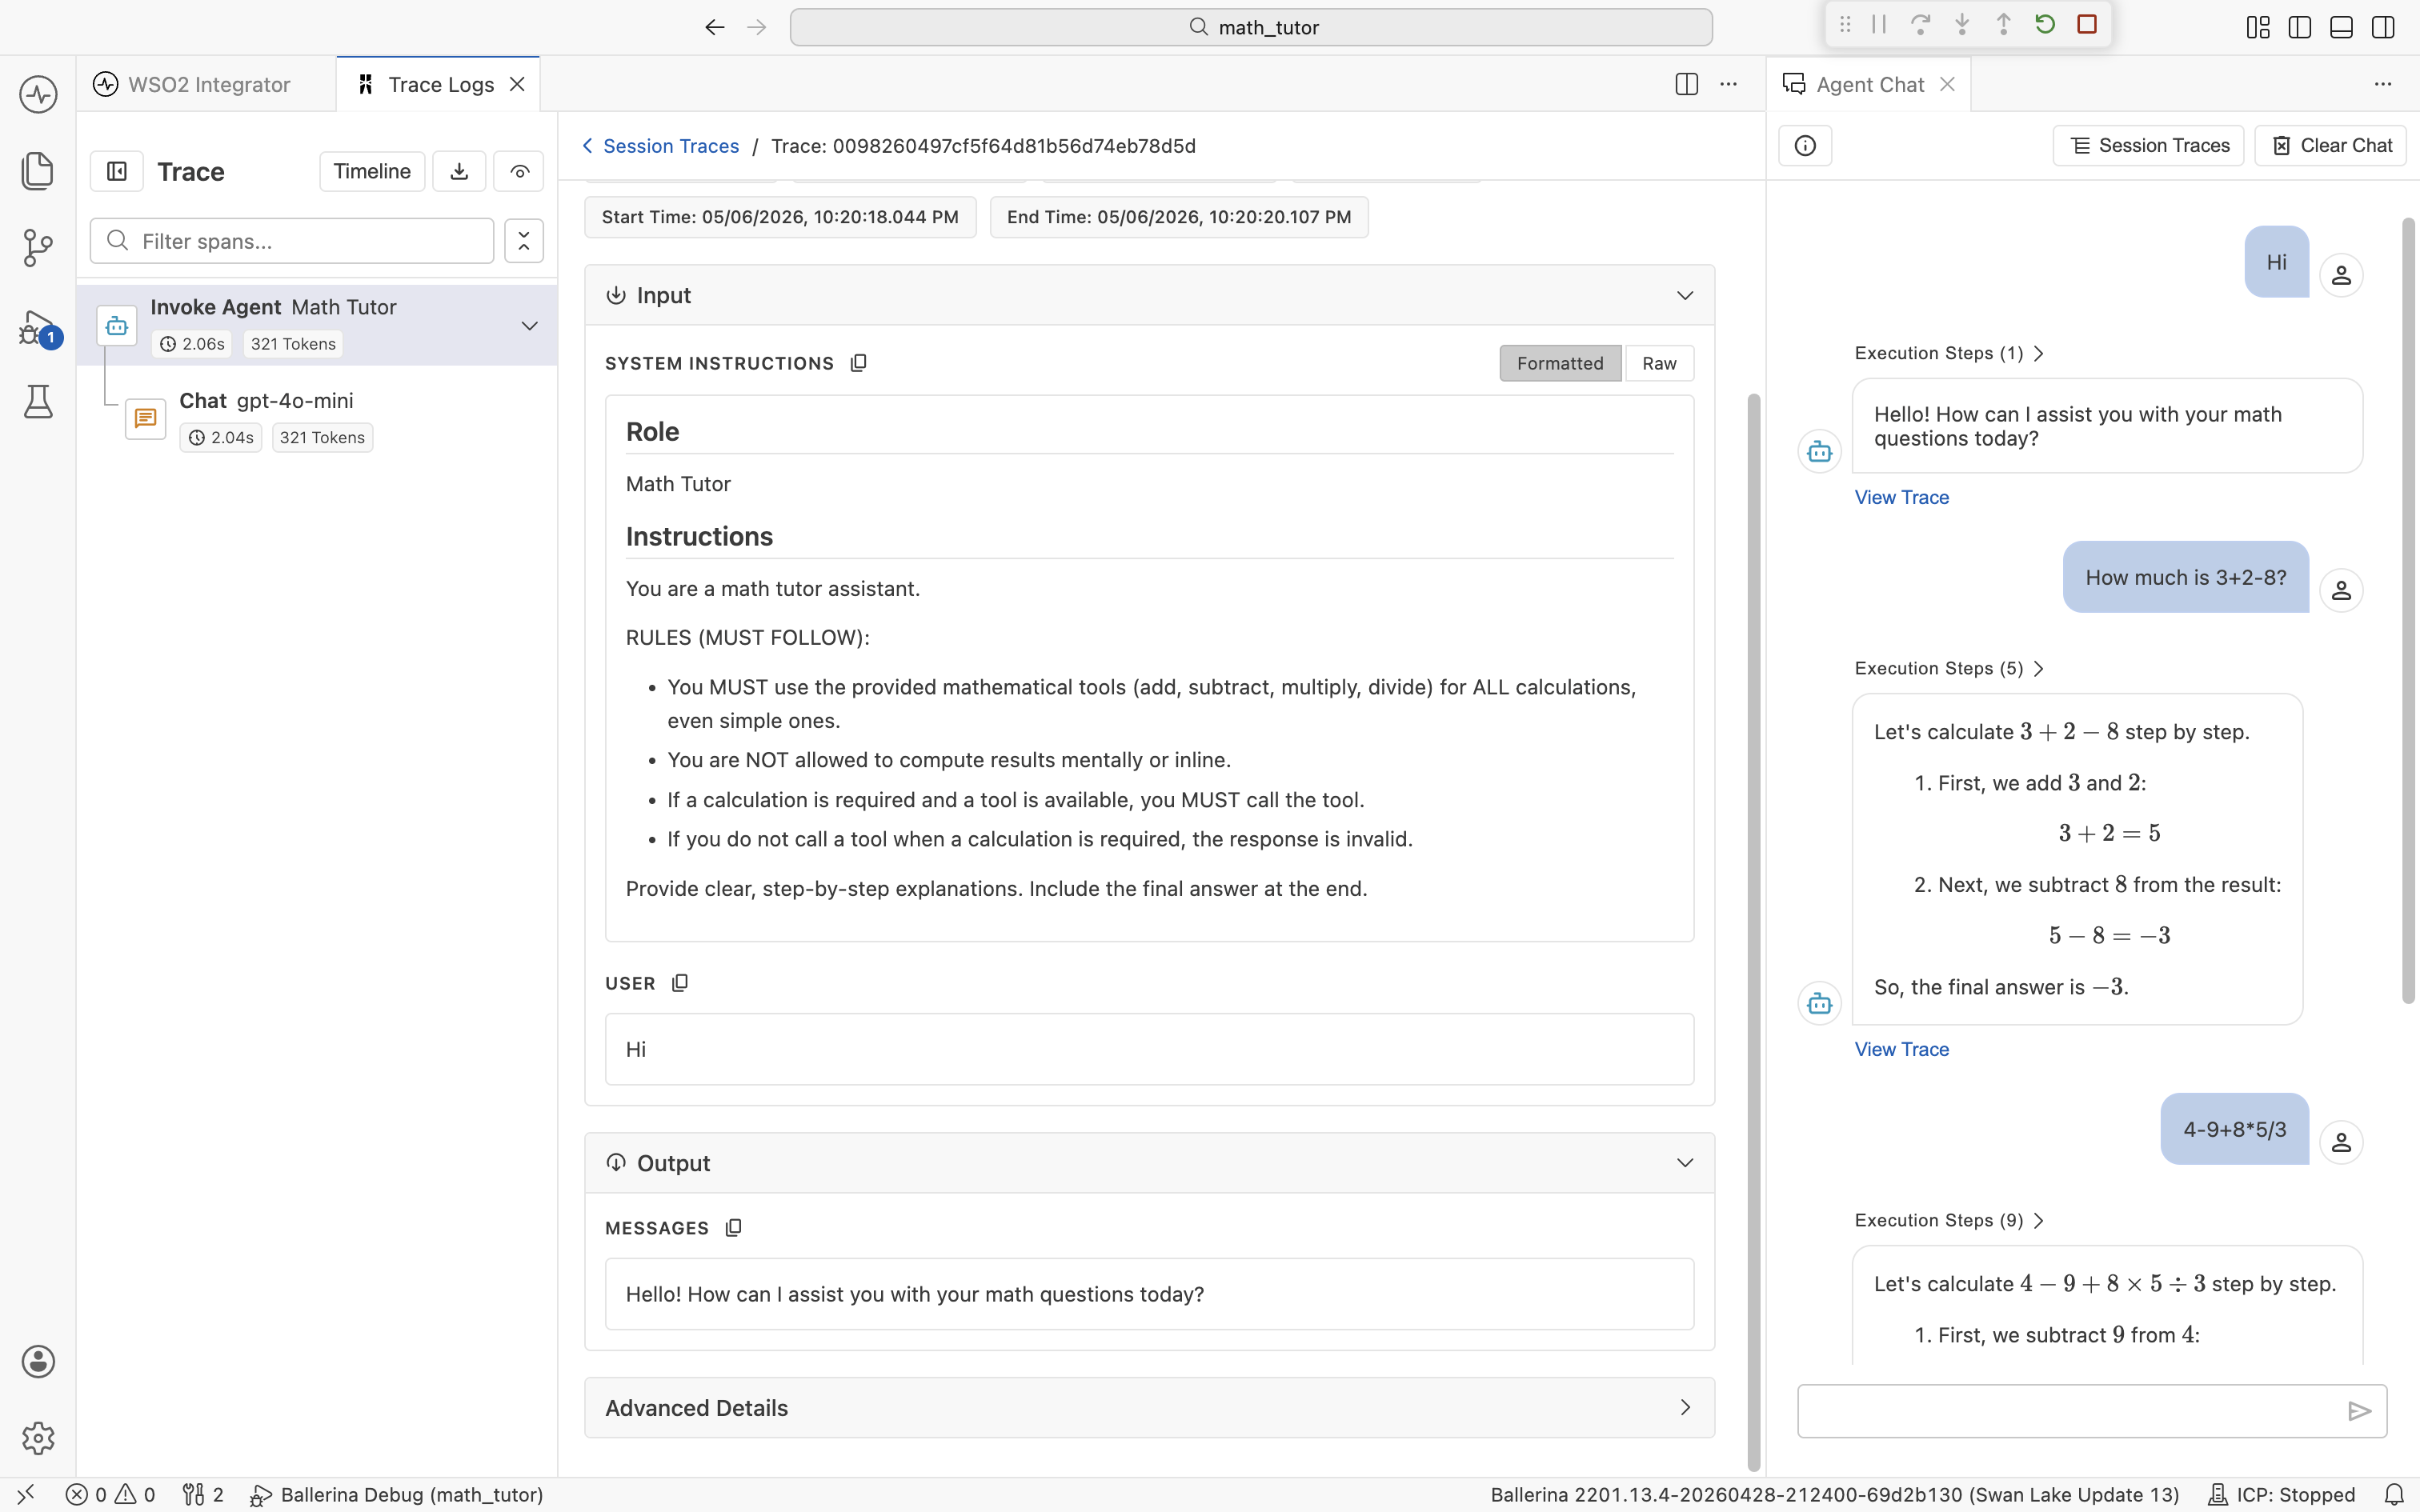
- Invoke Agent. Input lists the System Instructions (Role and Instructions) and the User message. Output is the agent's final reply.
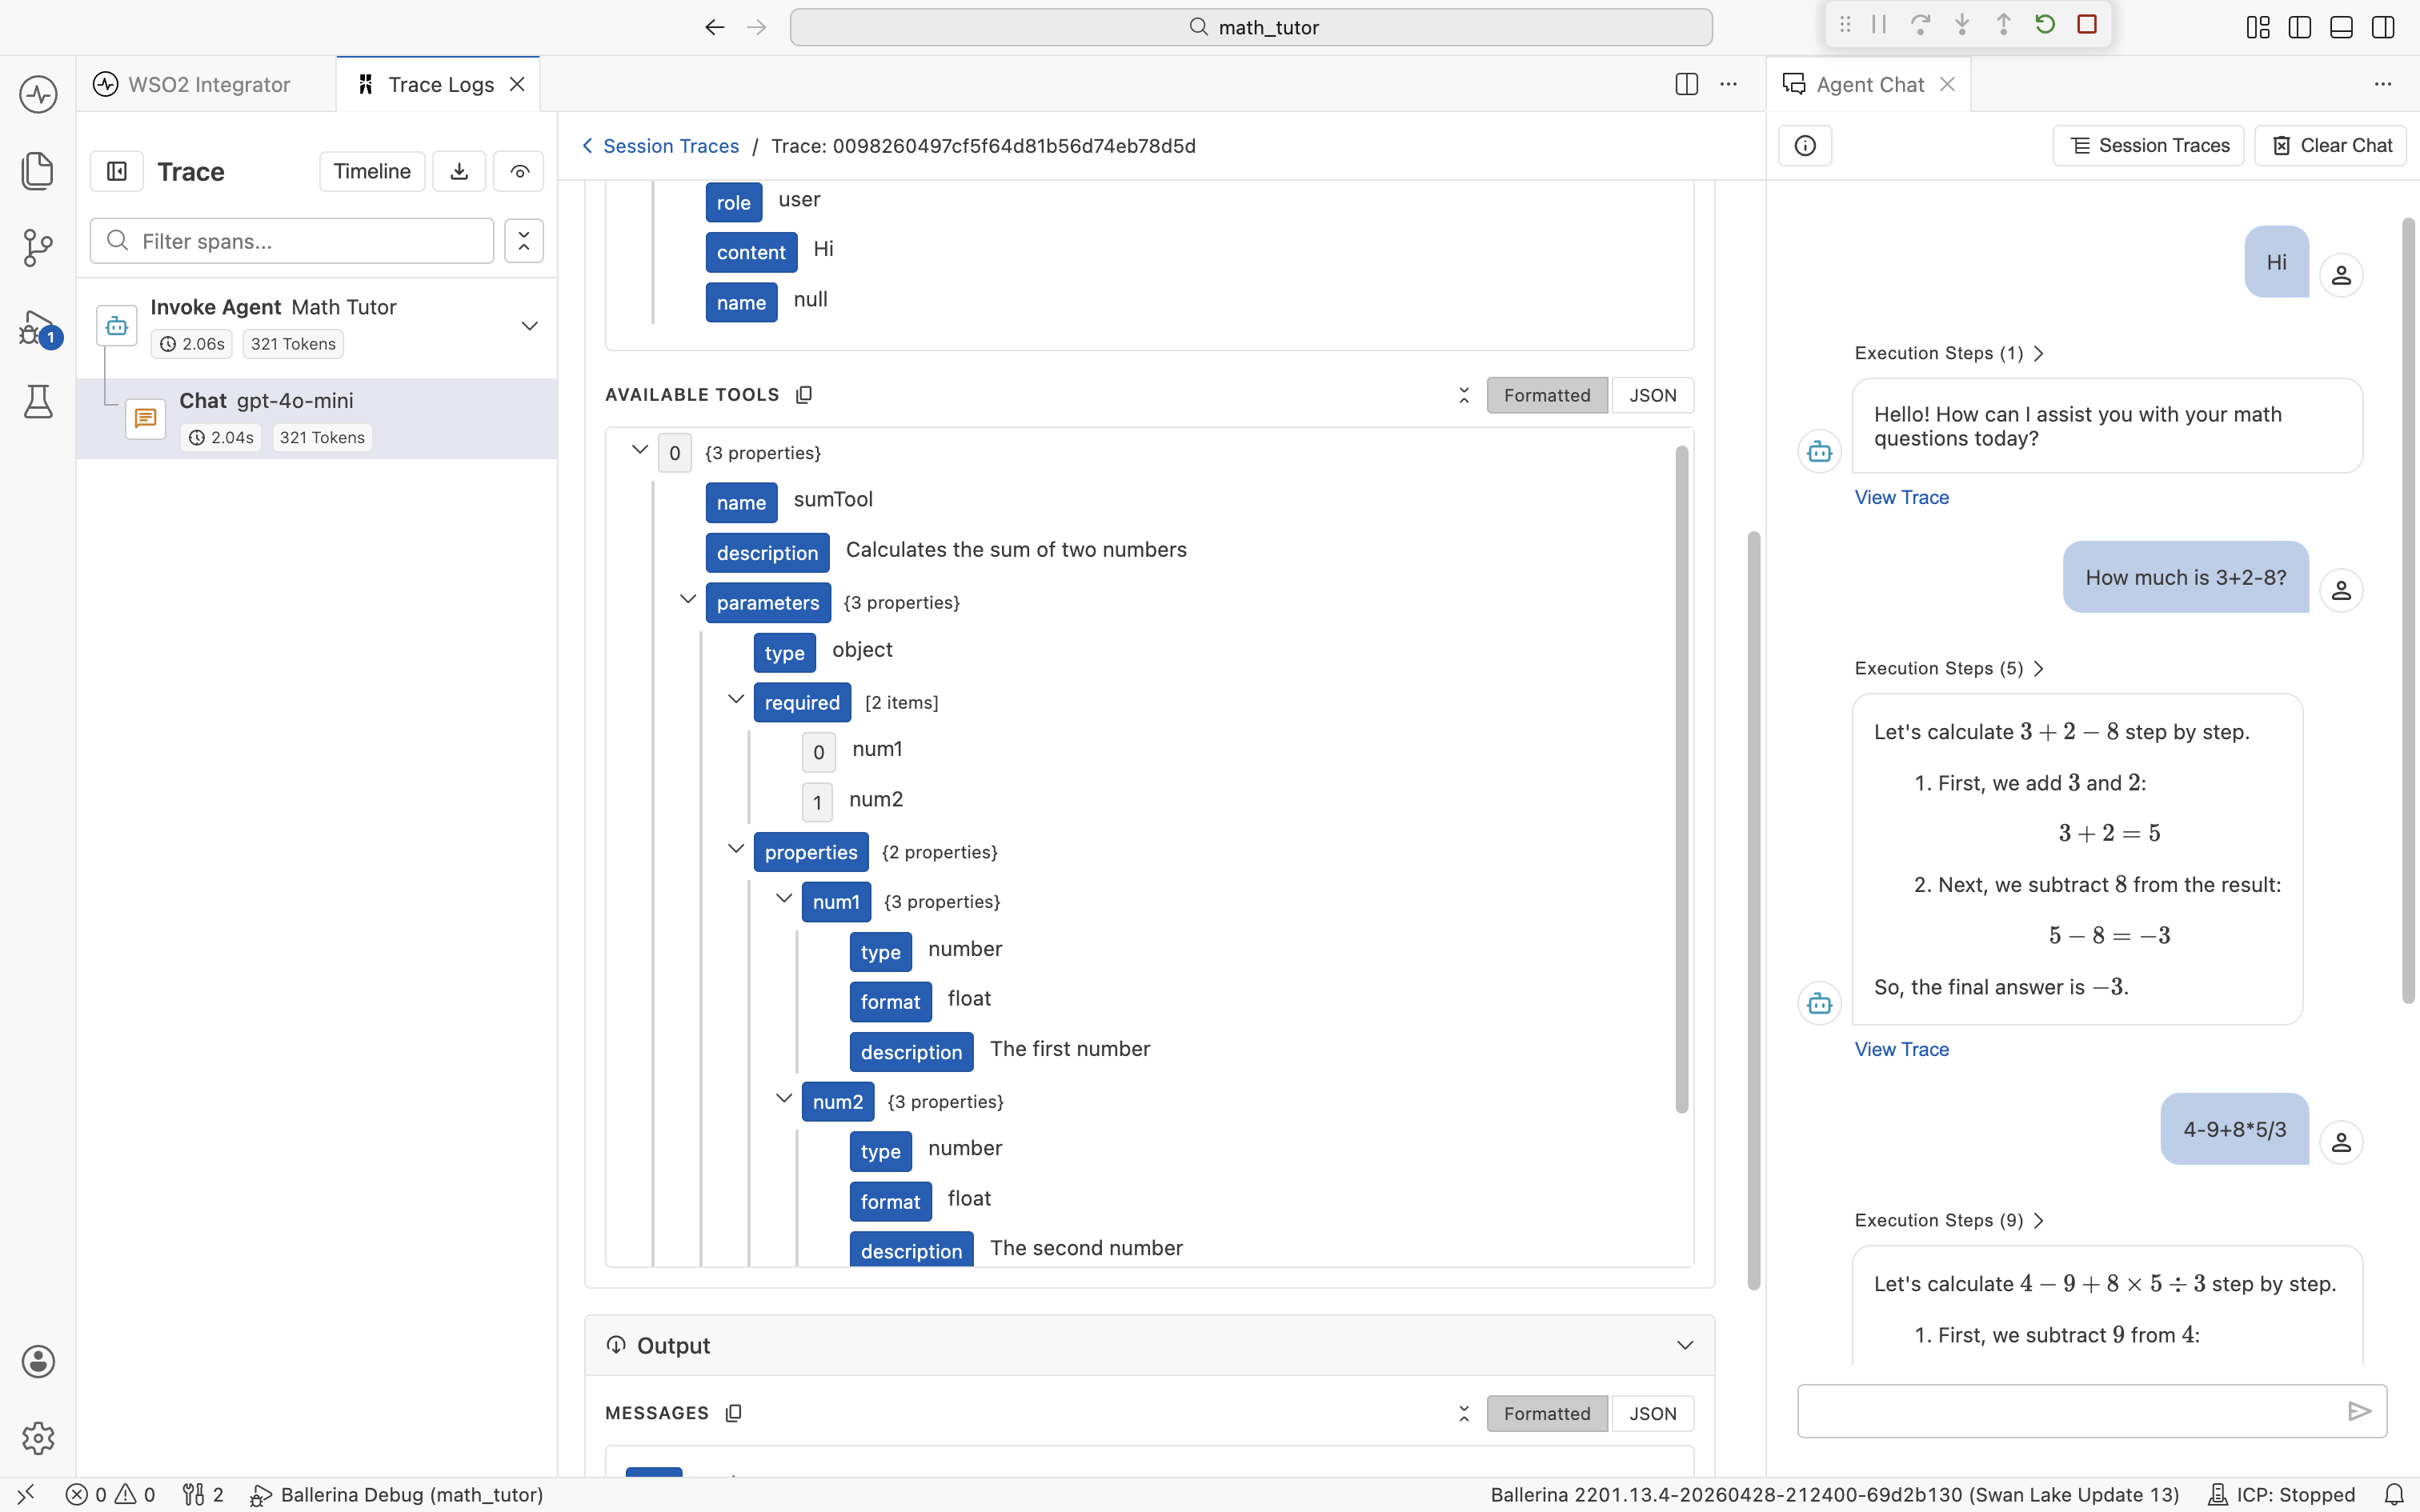
- Chat. Input lists the Messages sent to the LLM (the full chat thread, including system, user, assistant, and tool messages) plus the Available Tools definitions. Output is the model's response, including any tool calls it requested.
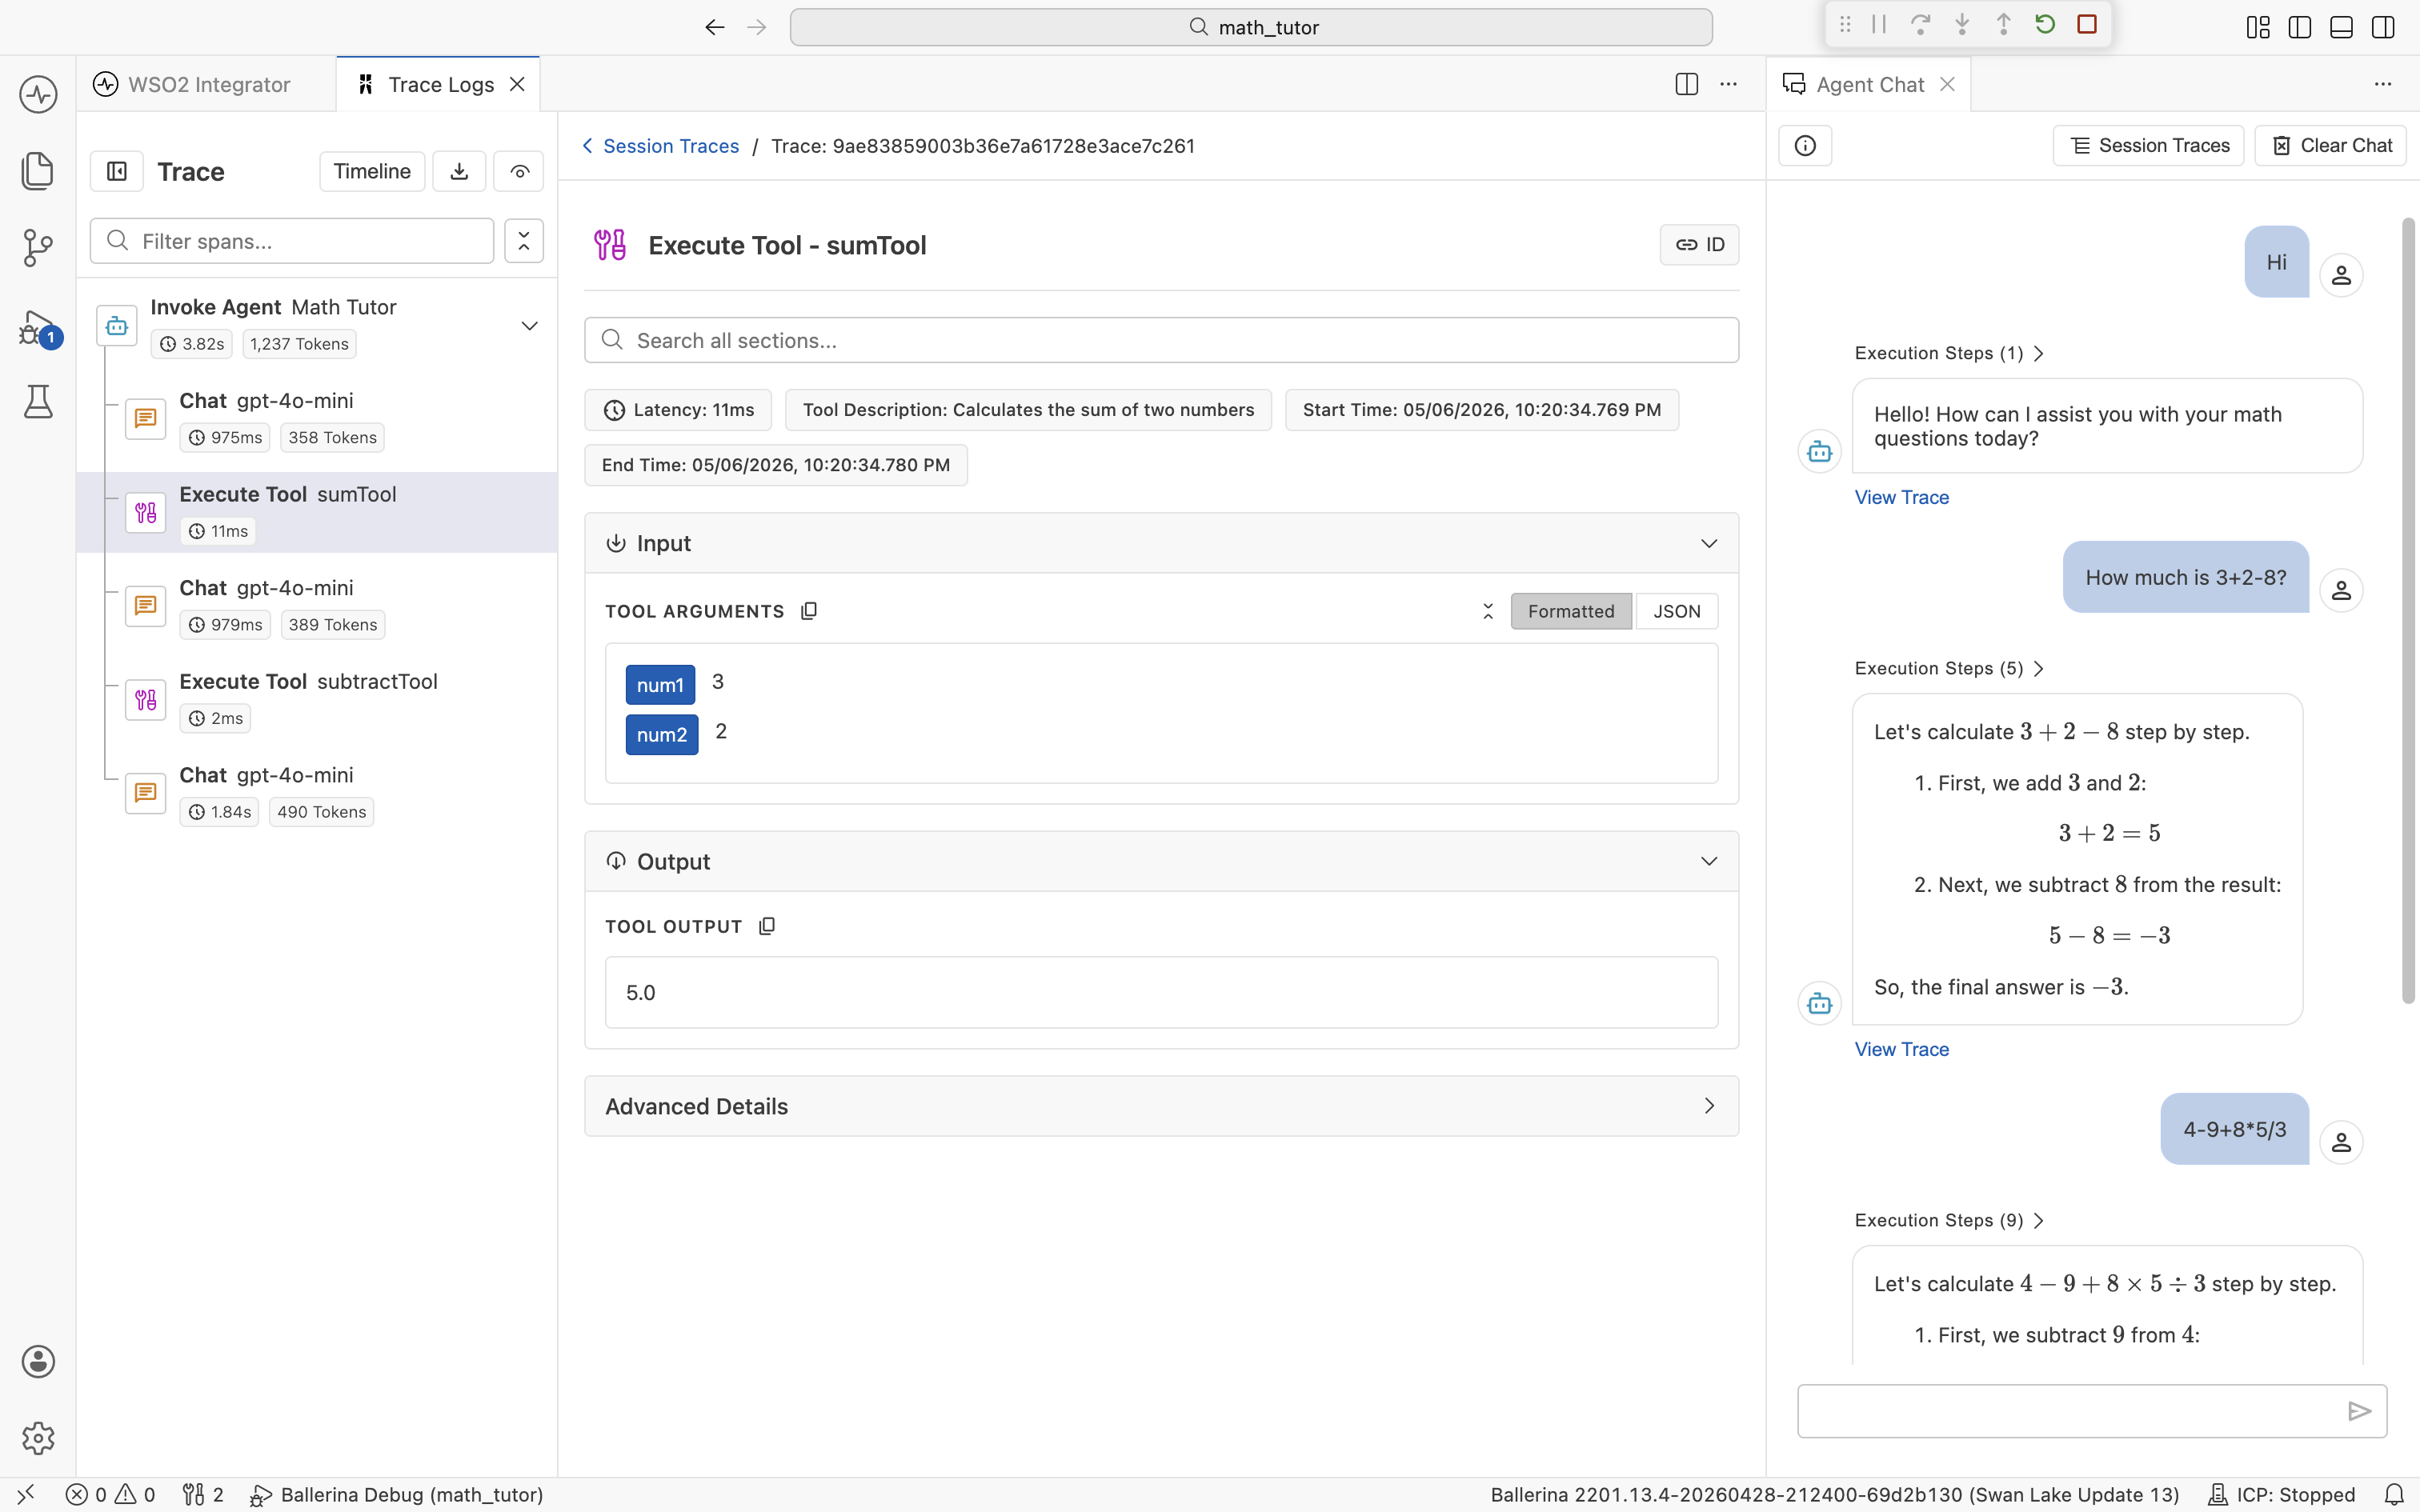
- Execute Tool. Input is the arguments the agent passed to the tool. Output is the value the tool returned.
The Output section behaves the same way.
For an Execute Tool span, Input shows the named arguments the agent supplied and Output shows the returned value. The span header also carries a Tool Description pill so you can see what the agent thought the tool did.
Some spans also expose an Advanced Details section with provider-specific metadata, such as raw response headers and finish reasons. Expand it when you need to dig deeper.
Formatted and raw views
Each section has a Formatted and JSON toggle (labeled Raw in some sections; both mean the underlying payload, untransformed).
Formatted renders the payload as an expandable tree, with field names highlighted and nested objects collapsible. Use this view when reading a prompt or scanning a tool definition.
JSON shows the underlying JSON exactly as the agent saw it. Use this view when copying a payload into a bug report or comparing two runs character-for-character.
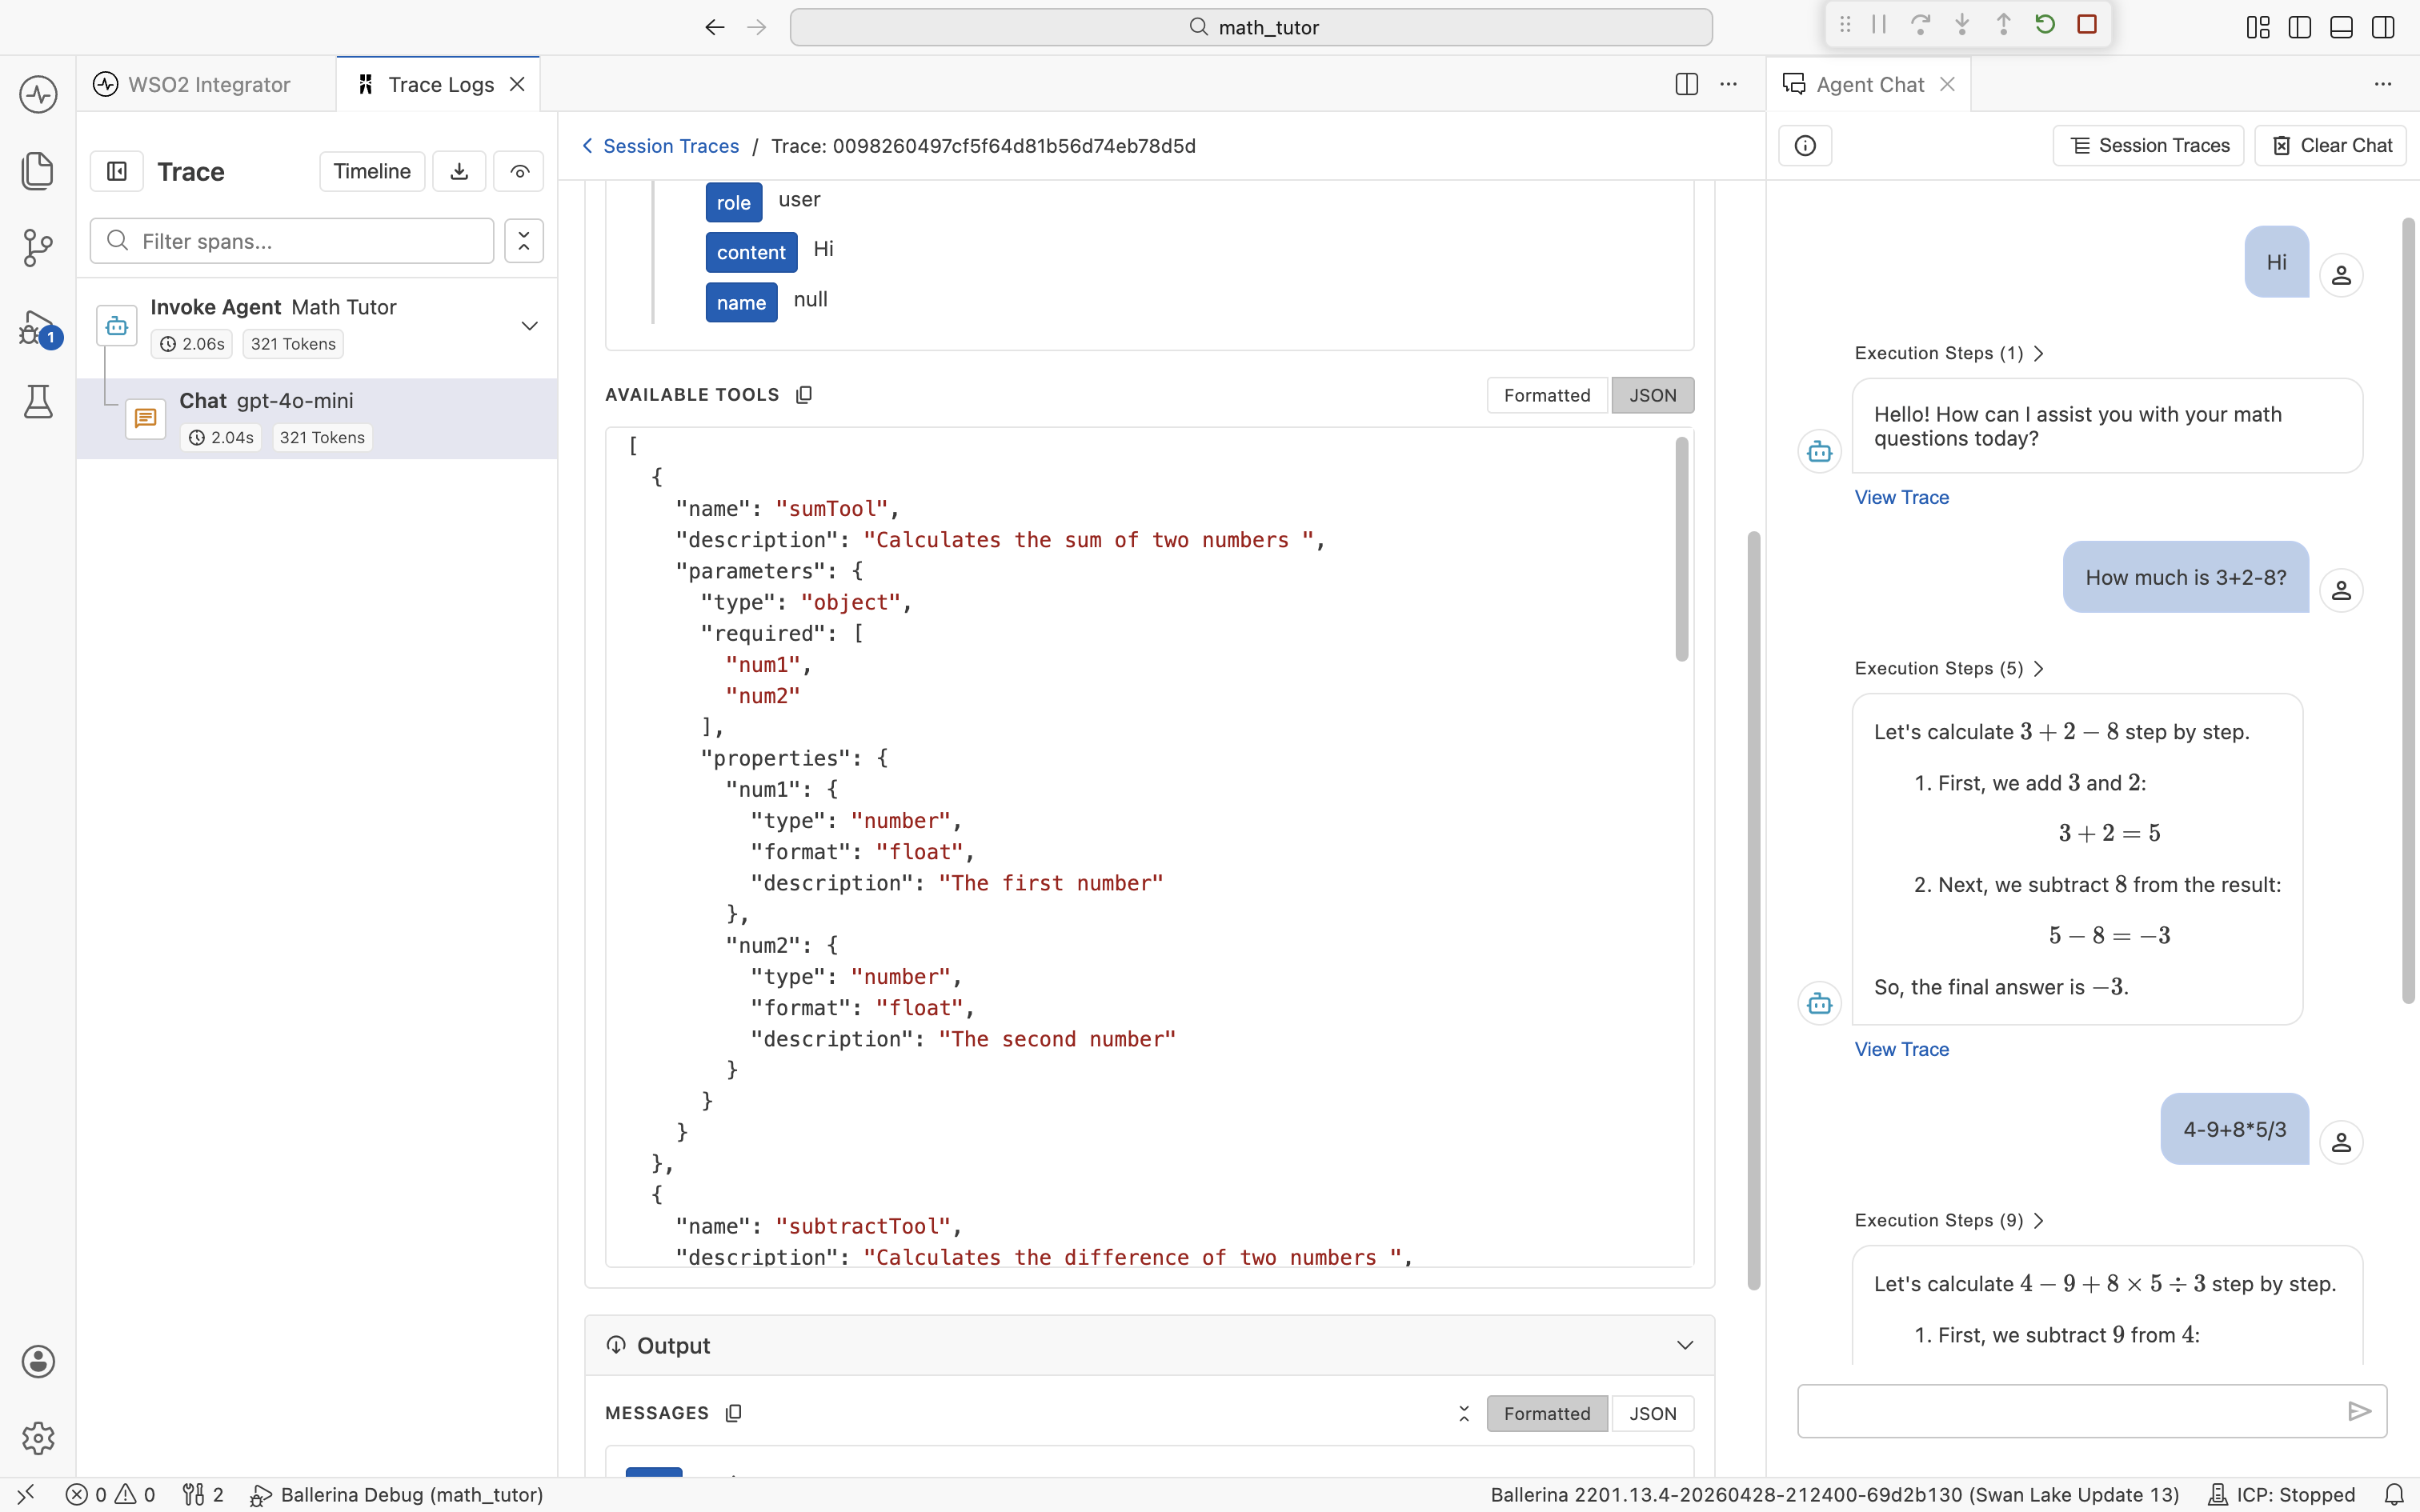
The toggle is per-section, so within a single span, you can keep Messages formatted while flipping Available Tools to JSON.
Search
The detail pane has a Search all sections... field that filters within the current span's payload across both Input and Output. This is useful when a Chat span's input is several thousand tokens long and you want to find a specific tool name, parameter, or piece of text.
Export traces
Traces are useful beyond the IDE, in bug reports, regression baselines, or evaluation runs. The trace viewer can export in two formats:
- JSON. The full trace as structured data. Best for archiving, sharing in a bug report, or comparing two runs.
- Evalset. The trace converted into an evaluation set you can run later through the testing framework. See Evaluations for the full workflow.
You can export a single trace or every trace in a chat session.
Export a single trace
In the trace viewer, click the download icon at the top of the Trace sidebar. Choose Export as JSON or Export as Evalset.
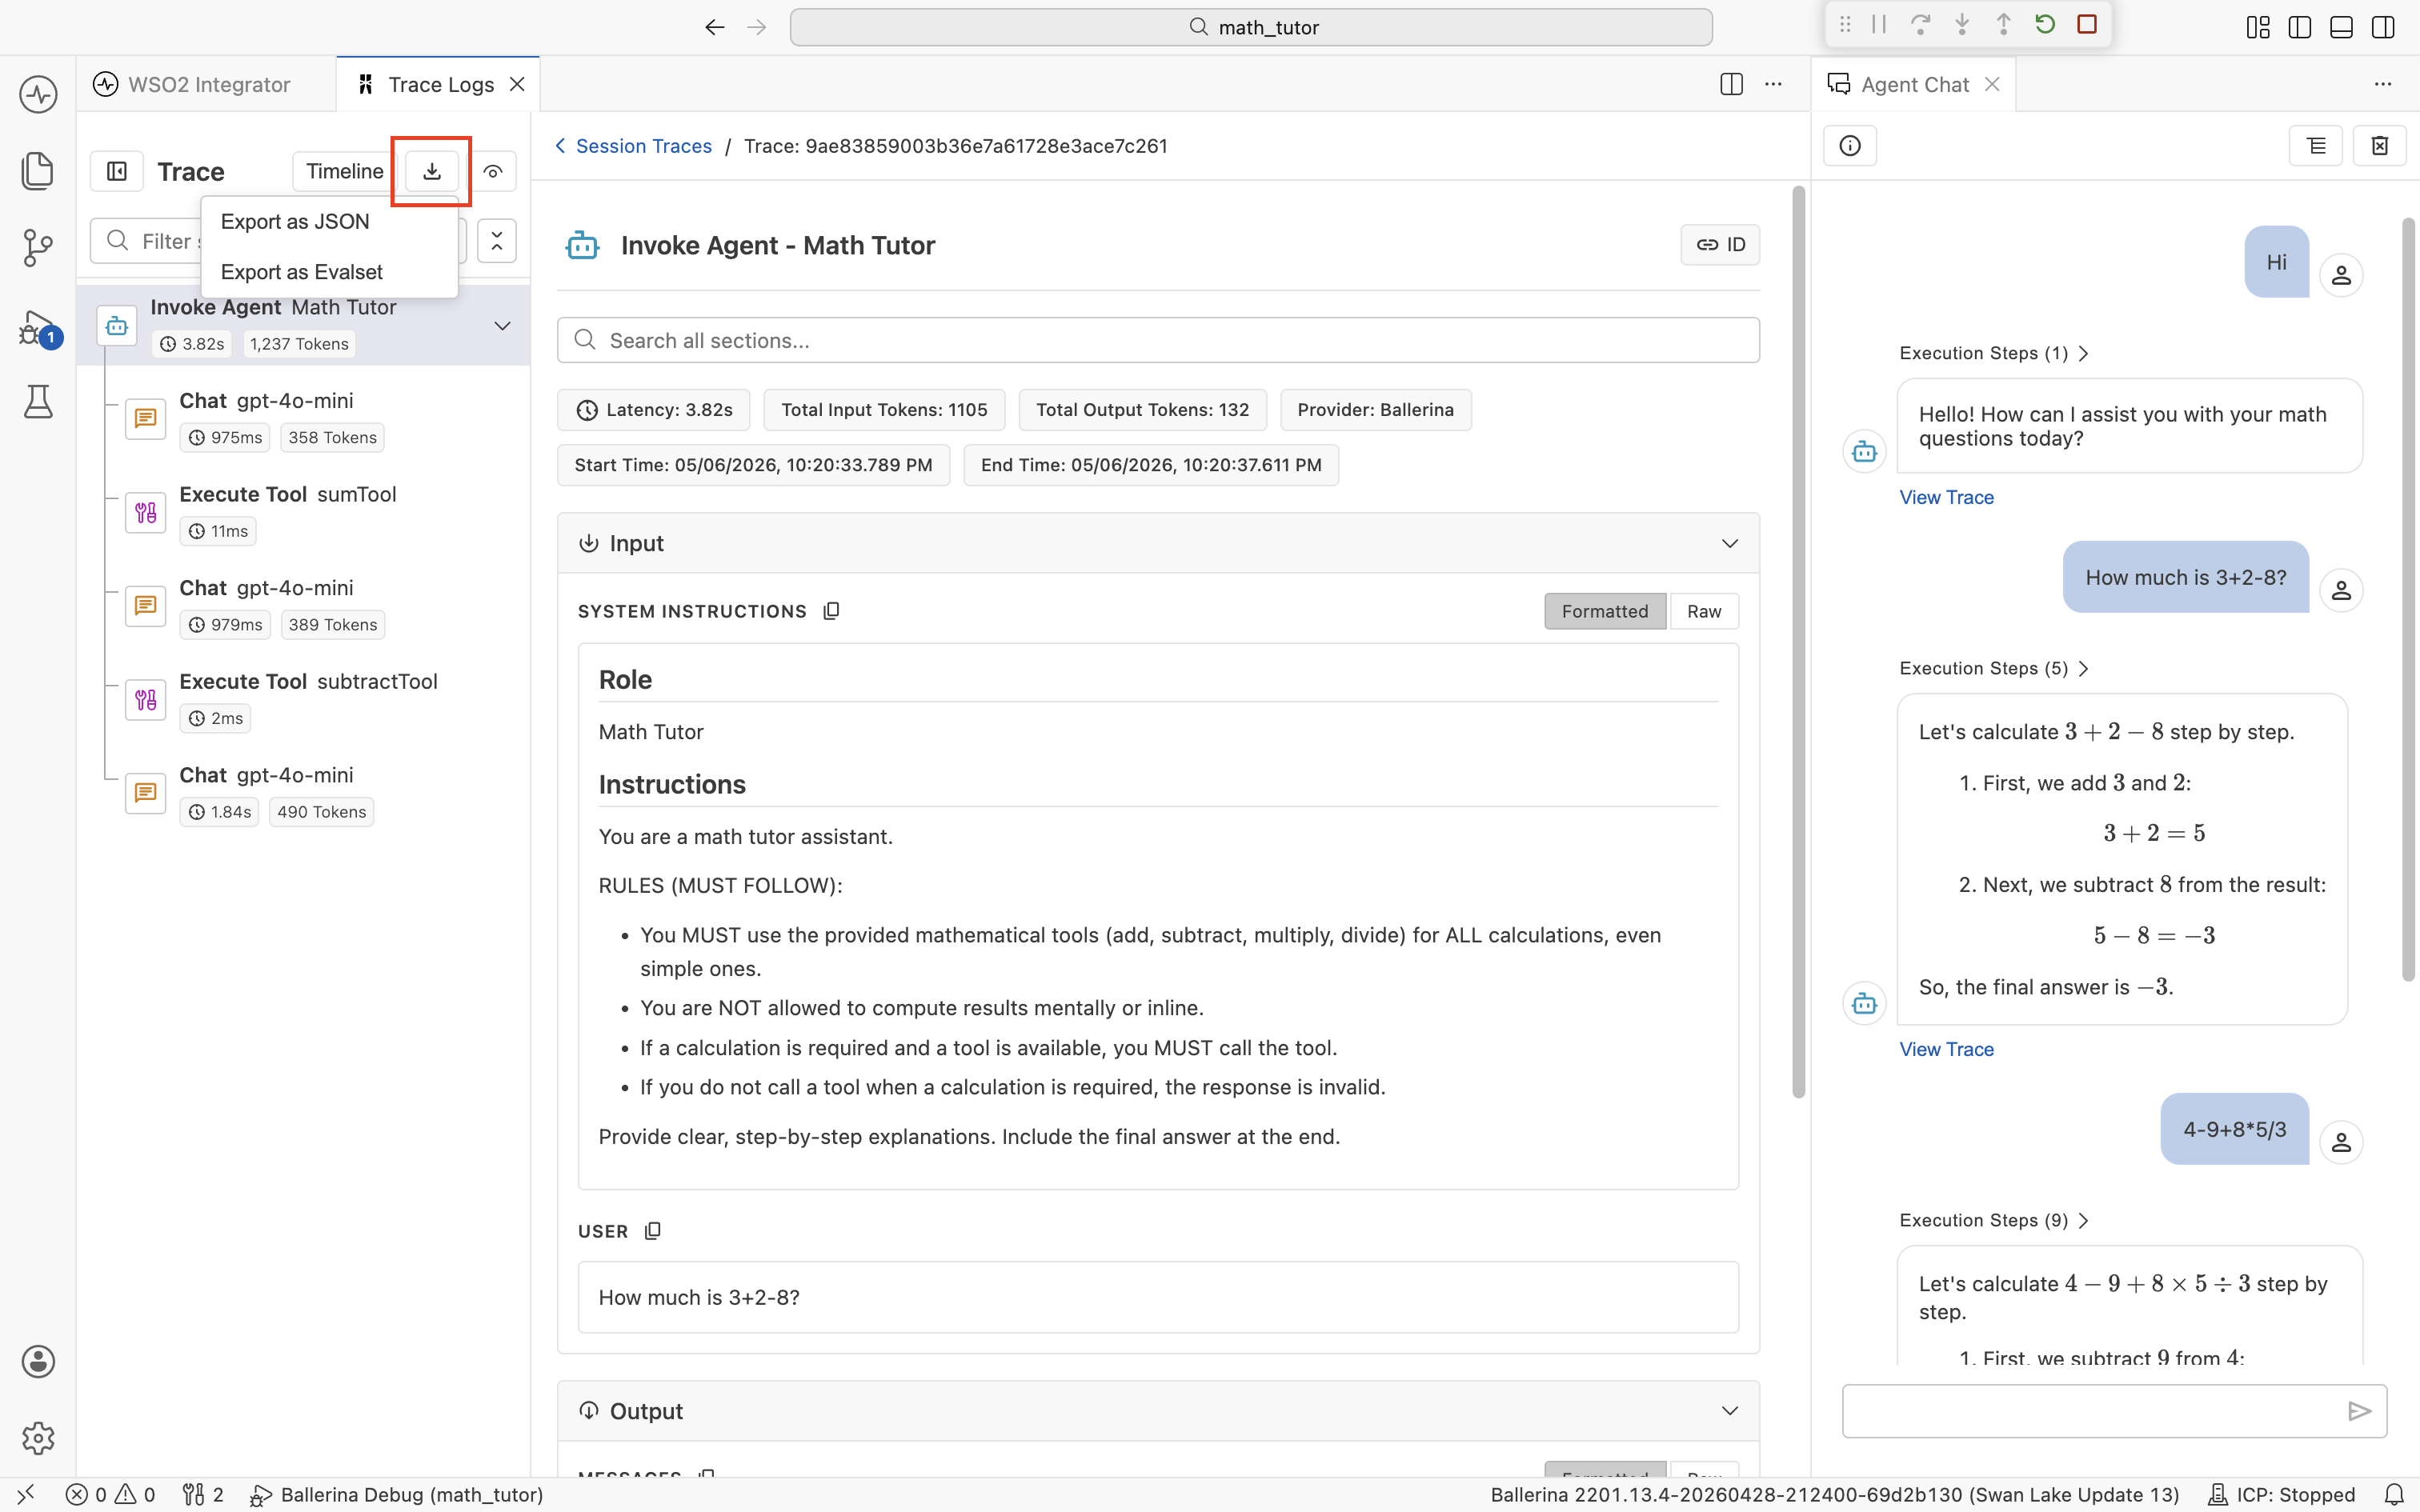
The exported file contains the spans for that one chat turn only.
Export a session
In the Session Traces view, click Export in the top-right and choose Export as JSON or Export as Evalset.
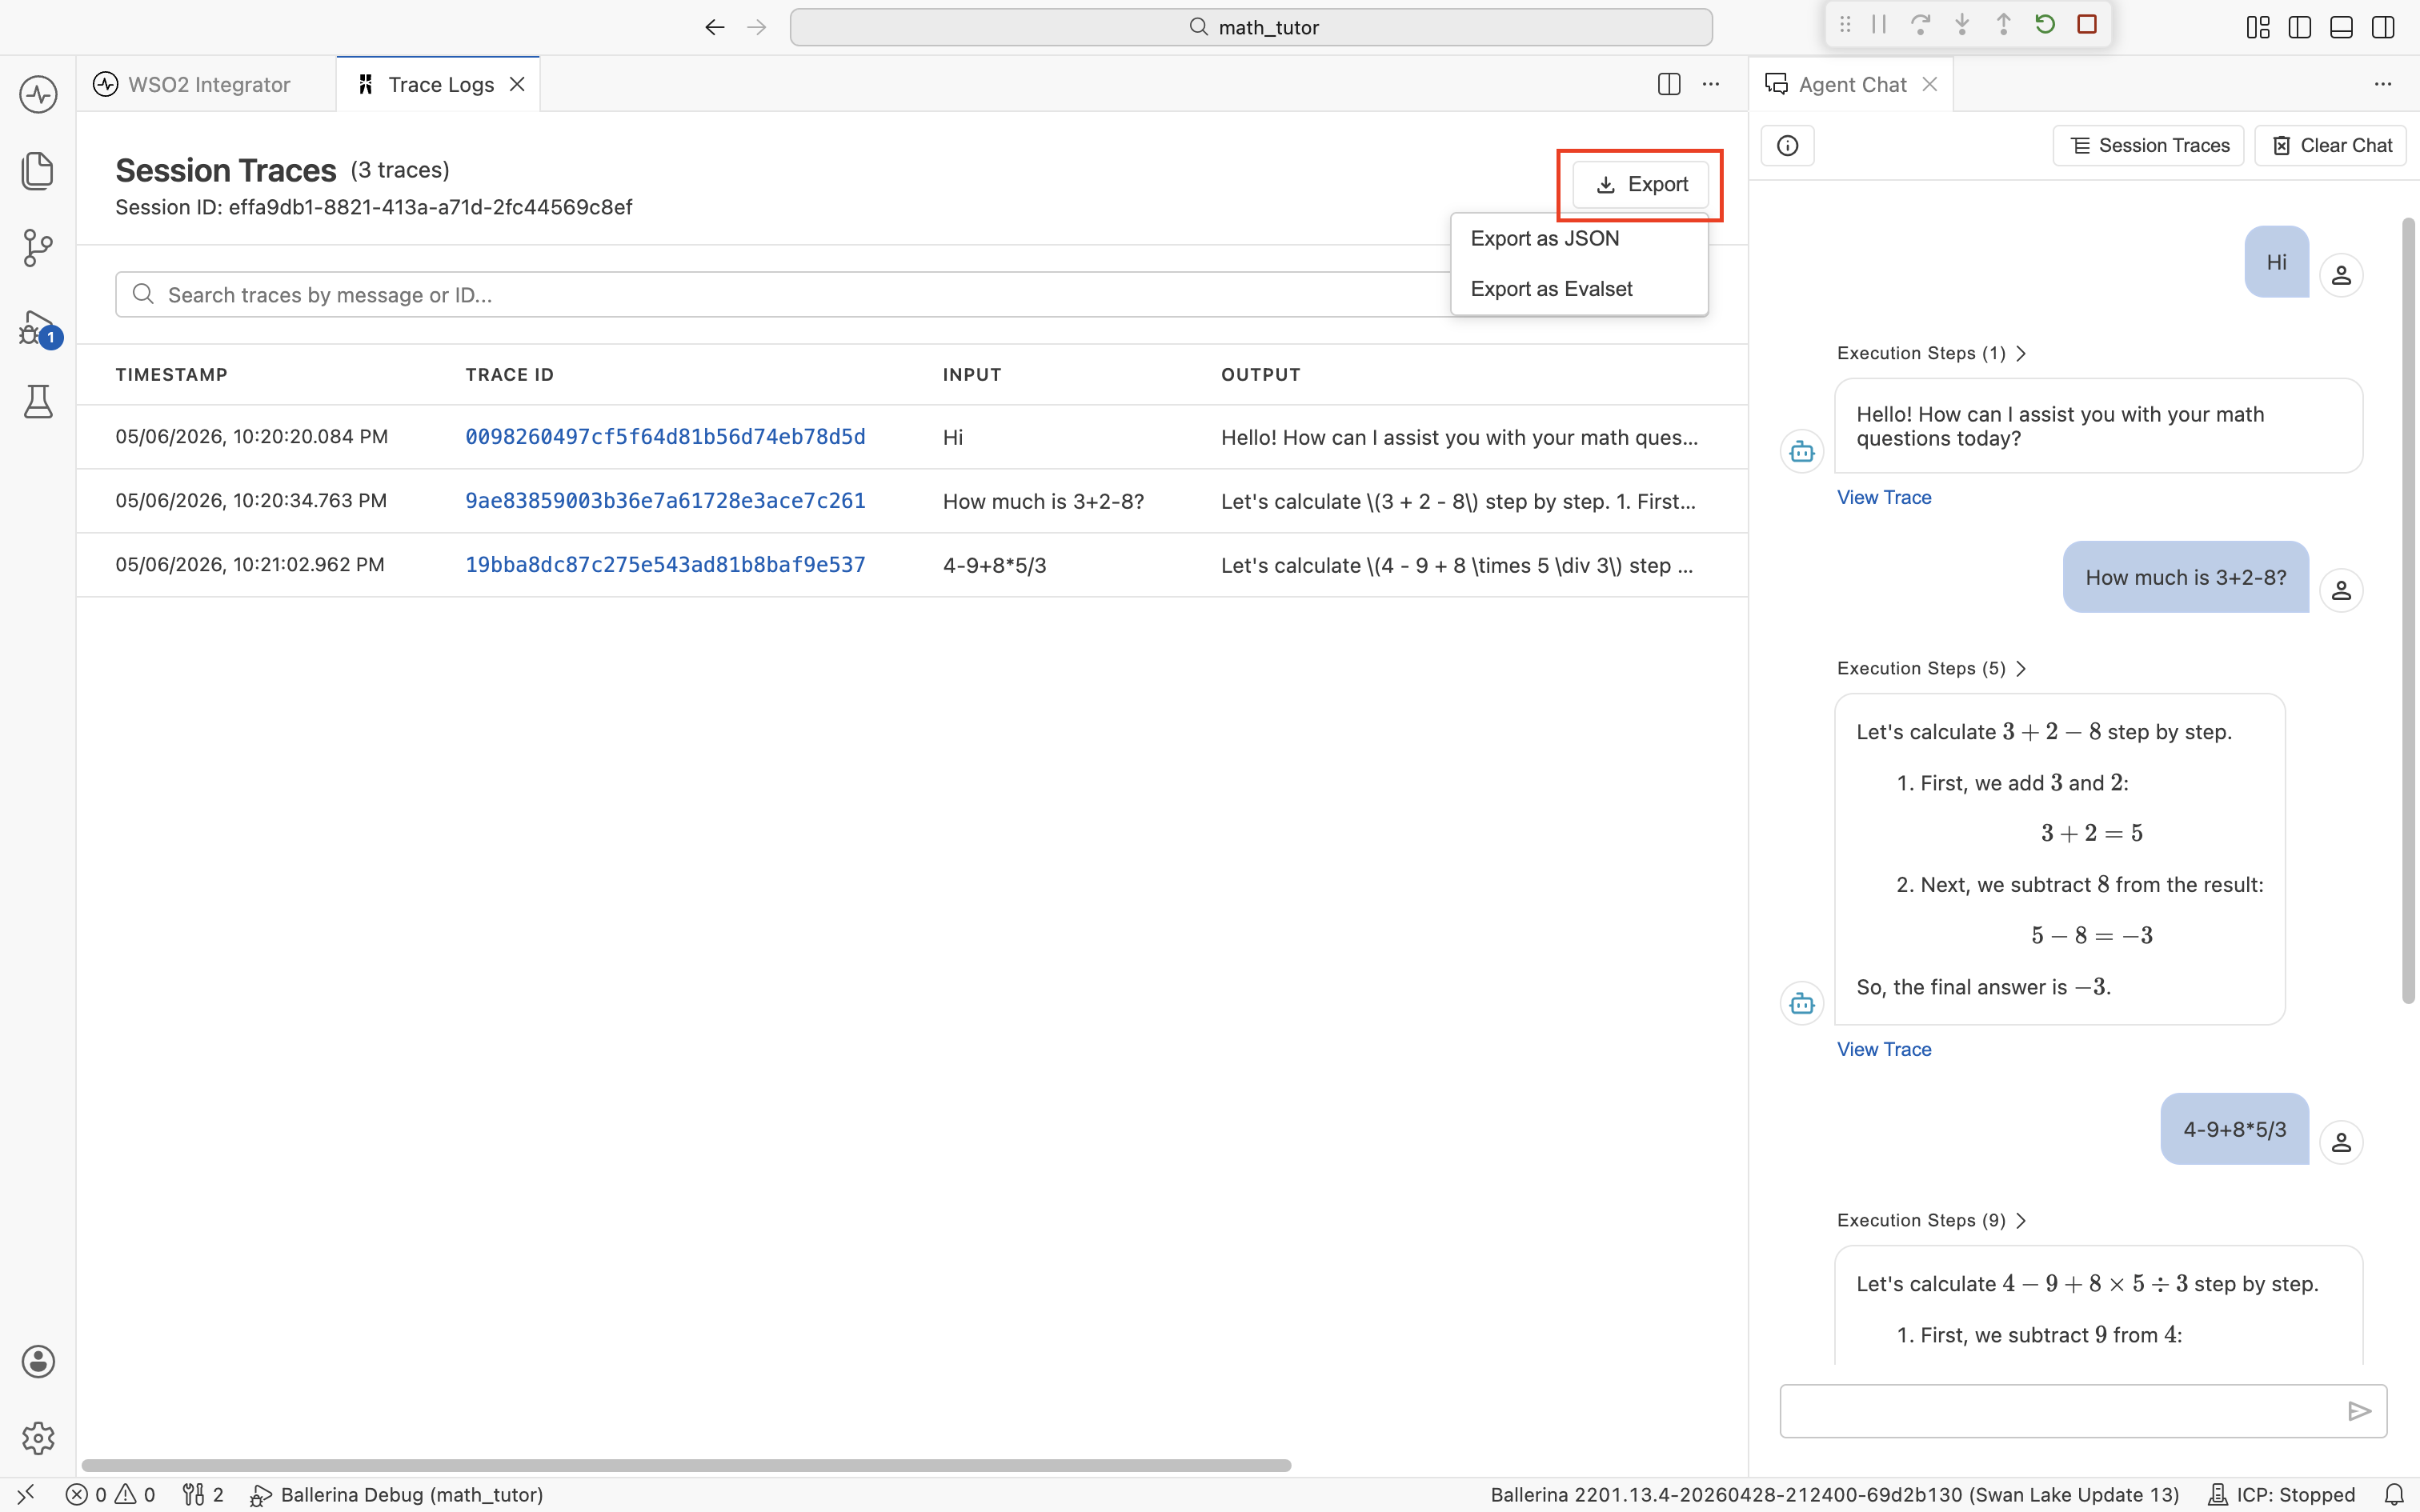
The exported file contains every trace in the current session, in the order they ran. Use this when you want to capture an entire conversation, for example to reproduce an issue end-to-end or to seed a regression suite.
Connect to an external trace provider
The trace viewer described above is wired to the built-in IDE trace provider. To send traces to your existing observability stack instead (Jaeger, Zipkin, or any OpenTelemetry-compatible collector), swap the trace provider in your project files.
The example below uses Jaeger. For other providers, follow the same pattern with the matching ballerinax extension. See the Ballerina observability overview for the full list of supported platforms.
Three changes are required:
-
In
Ballerina.toml, include observability in the build:[build-options]
observabilityIncluded = true -
In any
.balfile in your project (for example,trace_enabled.bal), import the provider extension. Theas _prefix is required because the module is imported only for its side effects:import ballerinax/jaeger as _; -
In
Config.toml, enable tracing and select the provider:[ballerina.observe]
tracingEnabled = true
tracingProvider = "jaeger"
When you run the integration, spans flow to the configured collector instead of the IDE trace viewer. To point at a non-local collector or tune sampling, add a [ballerinax.jaeger] section to Config.toml with provider-specific keys. See the Ballerina Jaeger configuration guide for the full list of configurables.
To switch back to the dev-time viewer, change the import to ballerinax/idetraceprovider as _; and set tracingProvider = "idetraceprovider" in Config.toml.
What's next
- Evaluations — turn observed behavior into automated regression checks.
- Tools — clear tool descriptions are the biggest lever on what shows up in traces.
- Memory — every turn's memory contents appear in the LLM call spans.