Using Different Reporting Frameworks with WSO2 Business Activity Monitor

- Sachini Jayasekara
- Software Engineer - WSO2
Introduction
Enterprises today depend very much on big data analysis and visualizations. There are a wide variety of usages of these visualizations. They are mostly used to get details on customer interests, market behaviour, and also to get new leads for potential customers. Today many critical business decisions rely on these visualizations.
As big data analysis and visualization have become such a critical area, there are dozens of analyzing and reporting tools emerging today.
In this article we will describe how to use such tools to visualize page visit details of a website of an IT company to be used in a decision making process.
Applies to
| WSO2 BAM | 2.0.0 |
Table of Contents
- Use case
- Solution
- Analyzing data
- Visualizing data
Use Case
In the current world many companies use page view details of their websites to track their customer behaviour, track new potential customers etc. Our use case is to analyse page view details of a website of an IT company and visualize them on a monthly basis with well known reporting frameworks such as Jasper, GoodData and Pentaho to be used by the marketing department to make critical marketing decisions. These frameworks are free, open source and the APIs are readily available as well so that anyone can easily use these for reporting purposes. IT companies want to analyze user interest toward their products by analyzing number of pageviews from a particular user. Also the company wants to know about which product pages are visited more often. Marketing department of the company should be able to get relevant reports through an application just by mentioning the month and criteria (user interest and popularity of products).
Solution
The proposed solution was to upload the page view details to WSO2 Business Activity Monitor (BAM) as a data stream and analyze the data set using BAM and produce a summarized result set and store the result set in a MySQL database. Then use the reporting tools (such as iReport for Jasper) to create report templates with necessary visualizations and queries to fetch relevant data for visualizations. Then direct those report templates to use MySQL database as the data source. Finally deploy the report templates in WSO2 Application Server and use a simple web application or deploy them as gadgets in BAM gadget portal to get relevant reports based on month, user, product etc.
High level architecture of the solution is illustrated below.

Analyzing data
WSO2 BAM mainly facilitates monitoring and understanding business activities within SOA and cloud deployments. But it can be configured to analyze and monitor key business indicators and also capture other general monitoring requirements.
In our use case we publish page view details to BAM’s built in Cassandra database as an event stream. This can be done by writing a simple Java client using the DataBridge API. Following sample code shows how to define a data stream and publish events to Cassandra database inside BAM. You can refer [1] to get to know about DataBridge API.
String streamId=null;
  		 streamId = dataPublisher.defineStream("{" +
               	"  'name':'" + STREAM_NAME + "'," +
               	"  'version':'" + VERSION + "'," +
               	"  'nickName': 'OTAnalytics'," +
               	"  'description': 'Page View'," +
               	"  'metaData':[" +
               	"      	{'name':'ipAdd','type':'STRING'}" +
               	"  ]," +
               	"  'payloadData':[" +
               	"      	{'name':'userID','type':'STRING'}," +
               	"      	{'name':'month','type':'STRING'}," +
               	"      	{'name':'monthsPassed','type':'STRING'}," +
               	"      	{'name':'userOrg','type':'STRING'}," +
               	"      	{'name':'document','type':'STRING'}," +
               	"      	{'name':'name','type':'STRING'}," +
               	"      	{'name':'tag','type':'STRING'}" +
               	"  ]" +
               	"}");


dataPublisher.publish(new Event(streamId, System.currentTimeMillis(),
                                                      createMetaData(), createCorrelationData(), eventData));
In the above code eventData is an object array which contains the data we want and it should comply with the format given in the stream definition.
DataBridge API is simple so that anyone can easily write a data agent to push a data stream to BAM. Also setting up WSO2 BAM is straightforward and can be done with few easy steps mentioned in INSTALL file inside BAM distribution. There is no need for further configurations. This makes it easy for the programmer. Also after publishing the events, if you want, you can manually browse the data with WSO2 BAM management console through ‘List Key Space’ (you have to log into Cassandra cluster before doing this. Default Credentials > Connection url-localhost:9160, username - admin, password - admin).
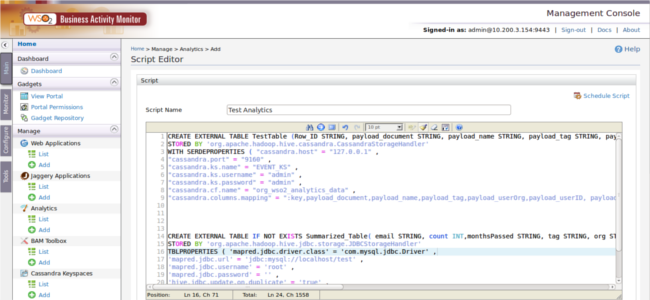
Analyzing is done by scheduling queries to run on this. Also we can use the same query to store the results of the analytics directly to an external database (MYSQL). WSO2 BAM2 leverages Apache Hive [5] to run analytic queries on a Hadoop cluster. Apache Hive is a query language which uses popular map-reduce technology [6] to run queries on the dataset as map-reduce jobs. Map-reduce jobs allow to analyze large quantities of data within a relatively short period of time because of the parallel execution capabilities. So BAM is ideal for a dataset like page views since they are very large in size. Also the functionality of storing query results to an external MySQL database is unique to WSO2 BAM and very useful for use cases like this. It really makes the task very easy. Also WSO2 BAM comes with a nice query editor (Management console -> Analytics -> Add) where we can write queries and also try it before scheduling.
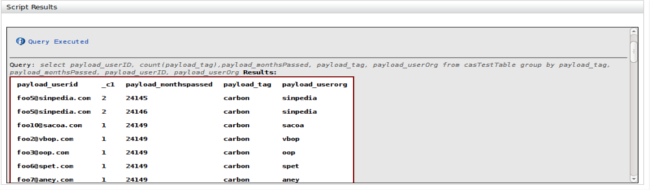
After executing the query as a Hadoop Map-Reduce job result will be displayed in the GUI too. This helps a lot to test Hive queries.
First we have to write a Hive query to define Table A and get data from Cassandra to Table A. For that BAM uses Apache Cassandra connector. Then we have to write a query to create Table B which is an external table and then we need an analytic query to analyze the data and filter out necessary details and store the summarized results inside external database (MYSQL). BAM has a WSO2 storage connector which can be used to write results directly to external databases such as H2 and MySQL. In this use case we are using a MySQL database. Once the script is executed BAM runs a map-reduce job and the results are automatically stored into the given database.
We have shared the Hive script from our use case for your convenience.
CREATE EXTERNAL TABLE TestTable (Row_ID STRING, payload_document STRING,
         payload_name STRING, payload_tag STRING, payload_userOrg STRING,
         payload_userID STRING, payload_month STRING, payload_monthsPassed STRING)
STORED BY 'org.apache.hadoop.hive.cassandra.CassandraStorageHandler'
WITH SERDEPROPERTIES ( "cassandra.host" = "127.0.0.1" ,
"cassandra.port" = "9160" ,
"cassandra.ks.name" = "EVENT_KS" ,
"cassandra.ks.username" = "admin" ,
"cassandra.ks.password" = "admin" ,
"cassandra.cf.name" = "org_wso2_analytics_data" ,
"cassandra.columns.mapping" = ":key,payload_document,payload_name,payload_tag,
         payload_userOrg,payload_userID, payload_month, payload_monthsPassed" );


CREATE EXTERNAL TABLE IF NOT EXISTS Summarized_Table
                         ( email STRING, count INT,monthsPassed STRING, tag STRING, org STRING)
STORED BY 'org.apache.hadoop.hive.jdbc.storage.JDBCStorageHandler'
TBLPROPERTIES ( 'mapred.jdbc.driver.class' = 'com.mysql.jdbc.Driver' ,
'mapred.jdbc.url' = 'jdbc:mysql://localhost/test' ,
'mapred.jdbc.username' = 'root' ,
'mapred.jdbc.password' = '' ,
'hive.jdbc.update.on.duplicate' = 'true' ,
'hive.jdbc.primary.key.fields' = 'email' ,
'hive.jdbc.table.create.query' = 'CREATE TABLE CONTENT_ACCESS_BY_MONTH
                                (email VARCHAR(100) NOT NULL PRIMARY KEY, count  INT,
                                monthsPassed VARCHAR(10),tag VARCHAR(100),org VARCHAR(100)) ');

INSERT OVERWRIT TABLE summarized_Table
                                       select payload_userID, count(payload_tag),payload_monthsPassed,
                                       payload_tag, payload_userOrg from casTestTable group by payload_tag,
                                       payload_monthsPassed, payload_userID, payload_userOrg;
The first block of the Hive script is used to create a table in Cassendra and sync that with the events we published to Cassendra. “cassandra.columns.mapping" part is responsible for mapping the event stream to the newly created table.
In the second block we create another table in a MySQL database. We have the luxury of defining the table schema from the Hive script. As an alternative we can also use an existing table.
Third block is the actual analytics and it runs the query and stores the results to the given external table which resides in MySQL database.
After running the Hive script, the results are automatically stored in the given MySQL database. It is a summarized data set compared to the initial page view data. Then we can use the MySQL database as the data source for reporting tools and reports can be generated as explained in the following section.
Visualizing data
Data visualization becomes useful for decision making as well as for communication. It is a powerful way of representing information and it allows to communicate correct information in a user friendly manner. Reporting frameworks provide a set of reporting functionalities which can be used for proper business intelligence processing.
Jasper, Pentaho, BIRT and Gooddata are some of the reporting frameworks that can be used to visualize the data. We will be discussing how to generate reports Jasper, Pentaho and GoodData frameworks. As mentioned earlier MYSQL database will be used as the main data source for the reports.
Generating Jasper Reports
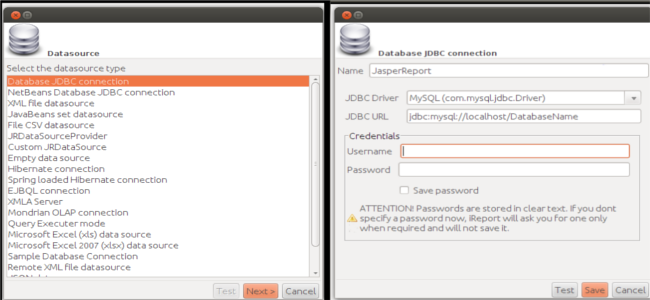
Jasper Report is an open source Java reporting library. Jasper reports can be exported to different formats such as html, pdf, .docx, .pptx and reports can also be viewed through web applications. iReport is a tool used to design Jasper reports from scratch. Using iReport what we create is a JRXML file which specifies the layout of the report. iReport can be considered as a flexible tool when it comes to data source connection as different types of data sources can be used with it. As mentioned earlier we will be using MySQL.
Creating a connection to the data source
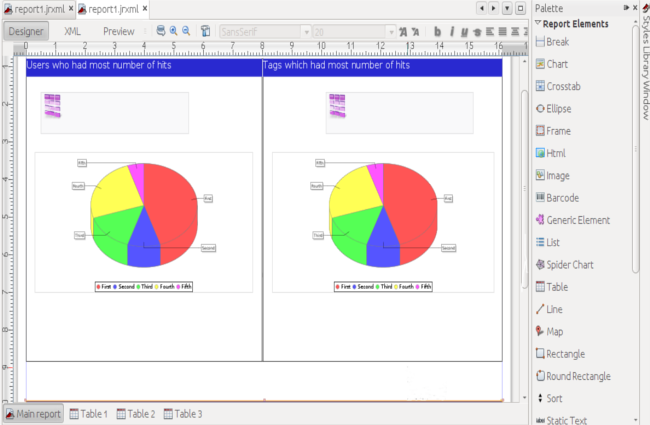
Once the data source connection is created report template can be designed by adding available report elements such as tables, charts, crosstabs, etc.
Retrieving data to fill reports
Queries can be defined to retrieve required data from the data source. Each element can have its own data set and each data set has its own query. This allows a single report to have visualization of data from different perspectives. Data filtering can also be done since parameters are accepted by queries.
If we want to show the top ten users who had the most number of page hits and top ten organizations which had the most number of page hits, we can create two data sets, one having a query to retrieve top organizations and another having a query to retrieve users. Once a chart or table element is added to the report template you can associate created data sets to tables or charts. The same data set can be visualized in various ways for the convenience of viewers. Likewise we can represent various information so that the viewer can easily get knowledge for their decision making tasks.
Once the data source connection is created and format is designed properly, the report can be exported to a preferred format.

Generating GoodData Reports
Loading data into GoodData
GoodData command line tool is used to create the data model and import data. For building the data model Multi-Dimension Analytical Query Language Data Definition Language is used.Once the GoodData project is created data can be imported using CL tool.[2]
Creating reports
Once the data is loaded you can login to GoodData site and create reports. Each report has a metric which is defined by Multi-Dimension Analytical Query Language (MAQL). GoodData also facilitates data filtering. Data defined by MAQL can be visualized using pie charts, funnel charts, area charts, tables etc. Created reports can be added to dashboard and dashboard can be exported to PDF format.

Generating Pentaho Reports
Pentaho Reporting is another reporting Java class library. Pentaho reports can also be exported to formats such as PDF, Excel, and XHTML. Pentaho report designer is used to design Pentaho reports.
Creating database connection
Pentaho facilitates various types of database connections.

Designing report format
Reports which contain tables and various types of charts can be designed using report designer. Once the database connection is created queries can be defined to retrieve required data. Pentaho allows to have parameters in queries as well. Retrieved data can then be visualized by tables and charts.

Conclusion
WSO2 BAM mainly facilitates monitoring and understanding business activities within SOA and cloud deployments. But it can be configured to analyze and monitor key business indicators and also capture other general monitoring requirements as well.
Data to be analyzed can easily be pushed to BAM as an event stream. Once the data is pushed data analyzing can be done by scheduling relevant queries as explained in the article. Queries can be used to store the analyzed data in an external database as well. These analytics can be used for decision making purposes as well as to get a clear understanding of the data set used for analysis.
Data visualization can be easily done by using different reporting frameworks. External databases, in which the data is stored, can be used as the data source for the frameworks and can generate various reports depending on the requirement. BAM facilitates efficient data analysis and allows different reporting frameworks such as Jasper, which are easy to use and configure, to be plugged in.
Jasper, Pentaho and GoodData are some of the reporting frameworks that can be used to visualize data with the assistance of BAM. In a similar manner different visualization frameworks can be plugged in.
References/Resources
Authors
Sachini Jayasekara, Trainee Software Engineer, WSO2 Inc
Tishan Dahanayakage, Trainee Software Engineer, WSO2 Inc
About Author
- Sachini Jayasekara
- Software Engineer
- WSO2