How to Perform a Root Cause Analysis by Monitoring Your APIs
-
By Nadheesh Jihan
- 02 Sep, 2022

Photo by Alfonso Scarpa on Unsplash
Choreo allows developers to develop, test, deploy, and manage APIs, services, and integrations efficiently. It allows developers to implement production-grade apps following best practices while assisting them to minimize bugs through comprehensive testing. Irrespective of all this, sometimes things don’t go according to plan. Hence, comprehensive observability becomes essential for troubleshooting and fixing bugs once apps are in production.
Choreo Observability is a comprehensive observability solution that assists developers to detect abnormal behaviors in production and perform root cause analysis (RCA) to pinpoint the cause of these abnormalities.
In this tutorial, let's discuss how to perform an RCA for an instance where API users get an unsuccessful/bad response for their request to an API deployed via Choreo. This RCA can be initiated due to a failing health check or user complaints when they are unable to access the app’s services.
1. First, open the Choreo Observability view for your component.
Click the Observe button in the left panel as shown in Figure 1 to navigate to the Observe tab. Then you will see the observability view shown in Figure 2.
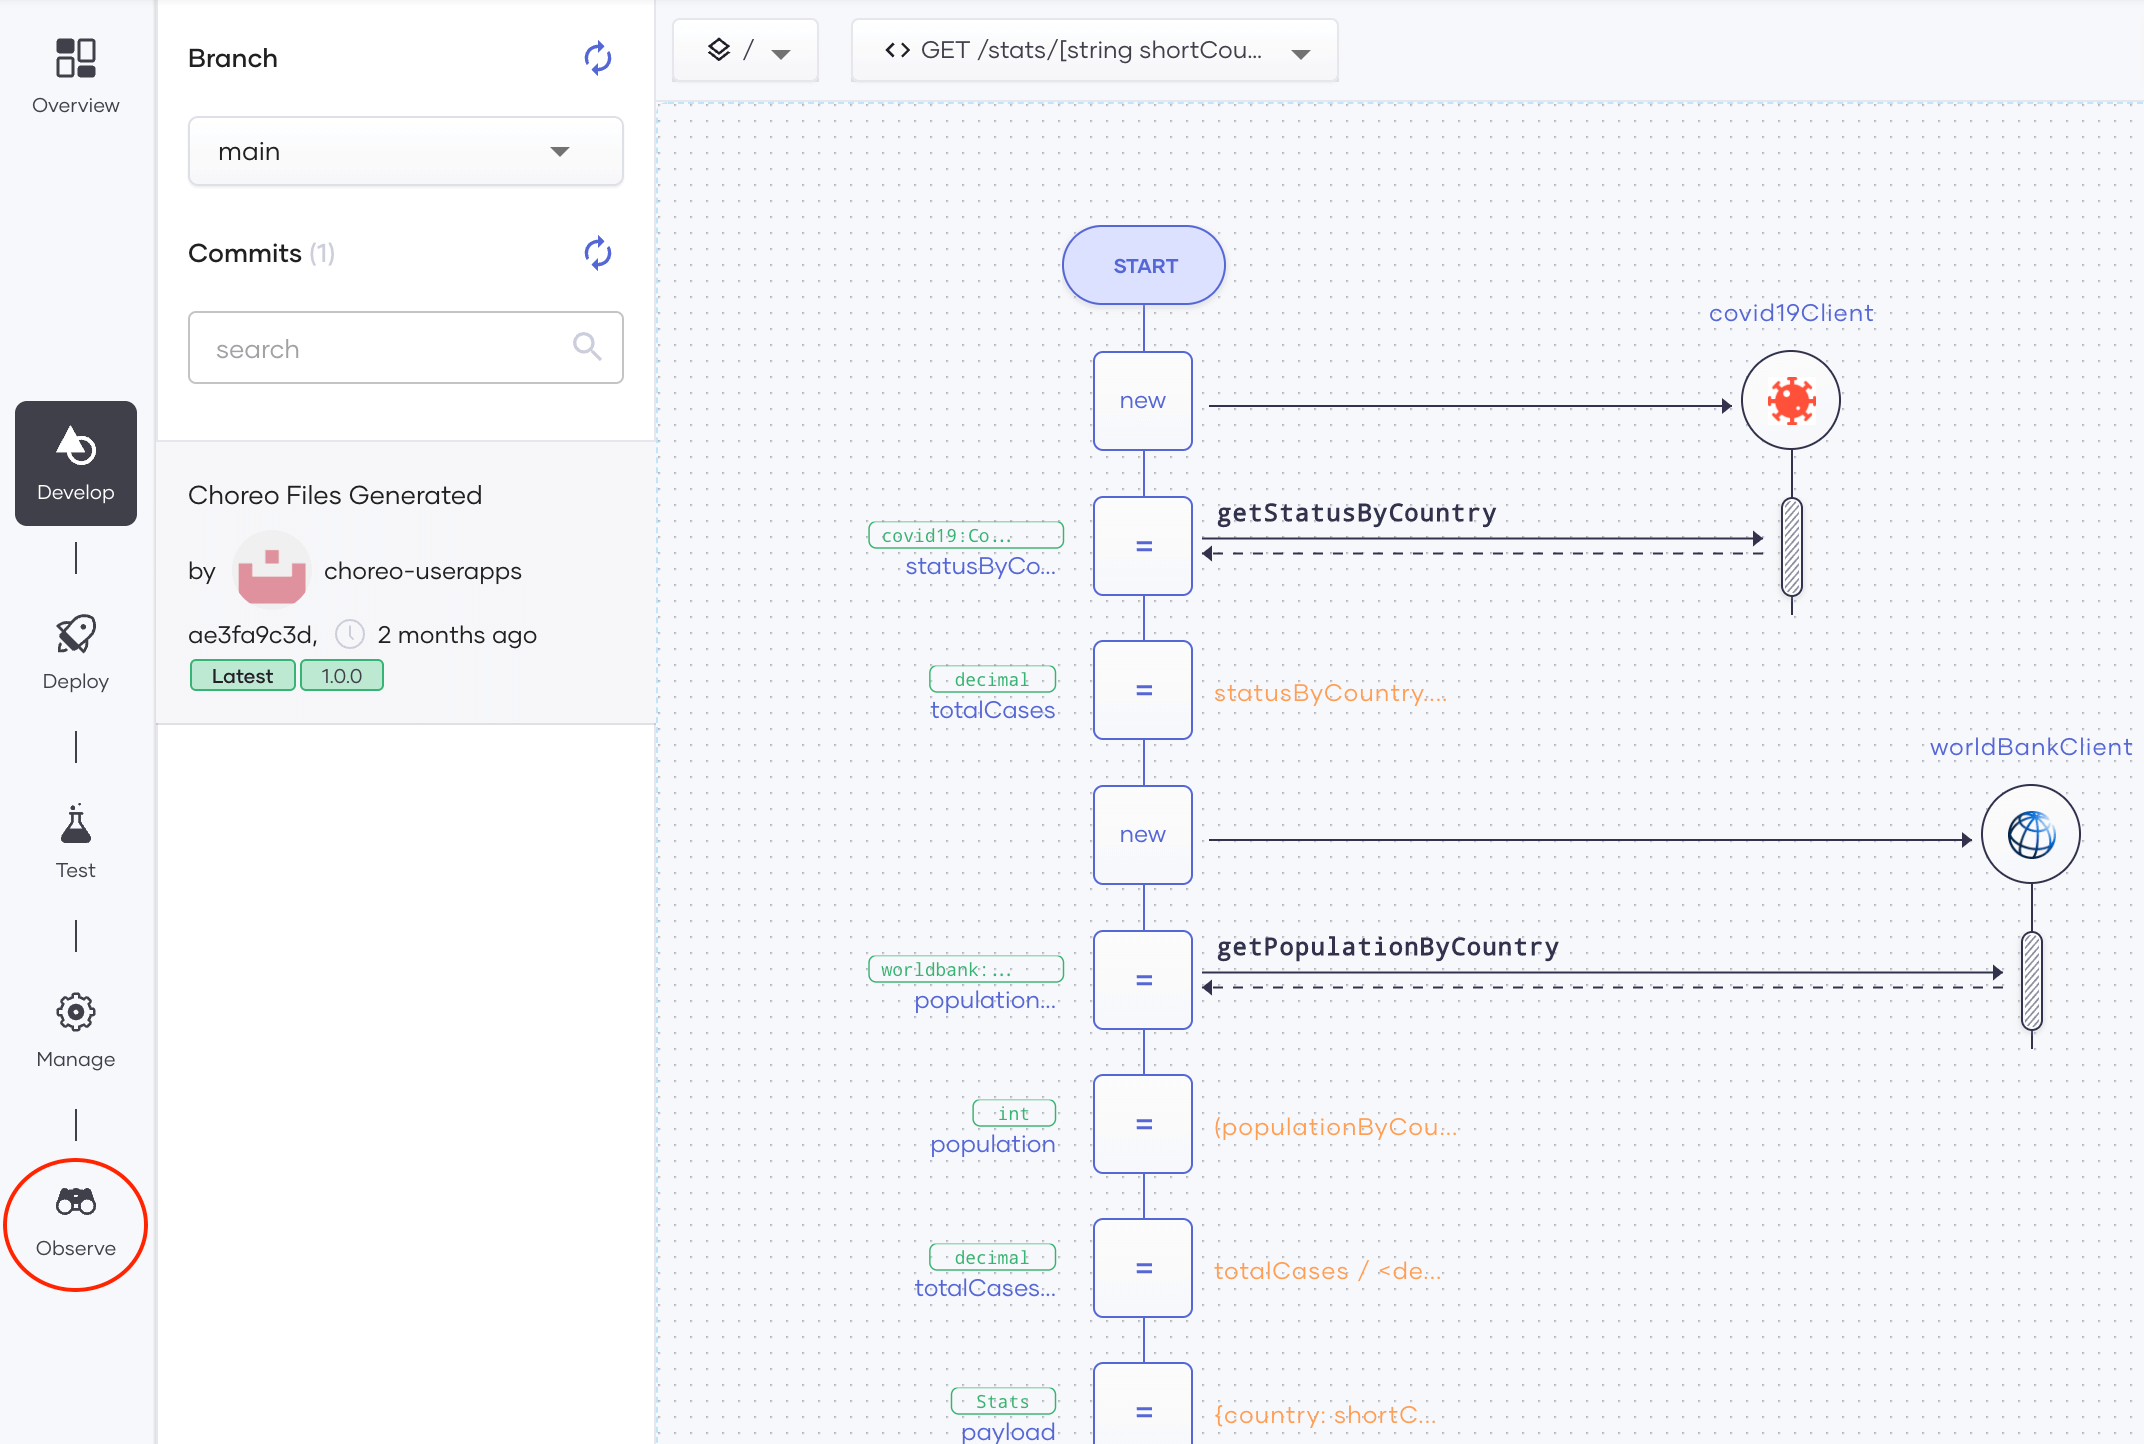
Figure 1: Navigate to the Observe tab of a selected component
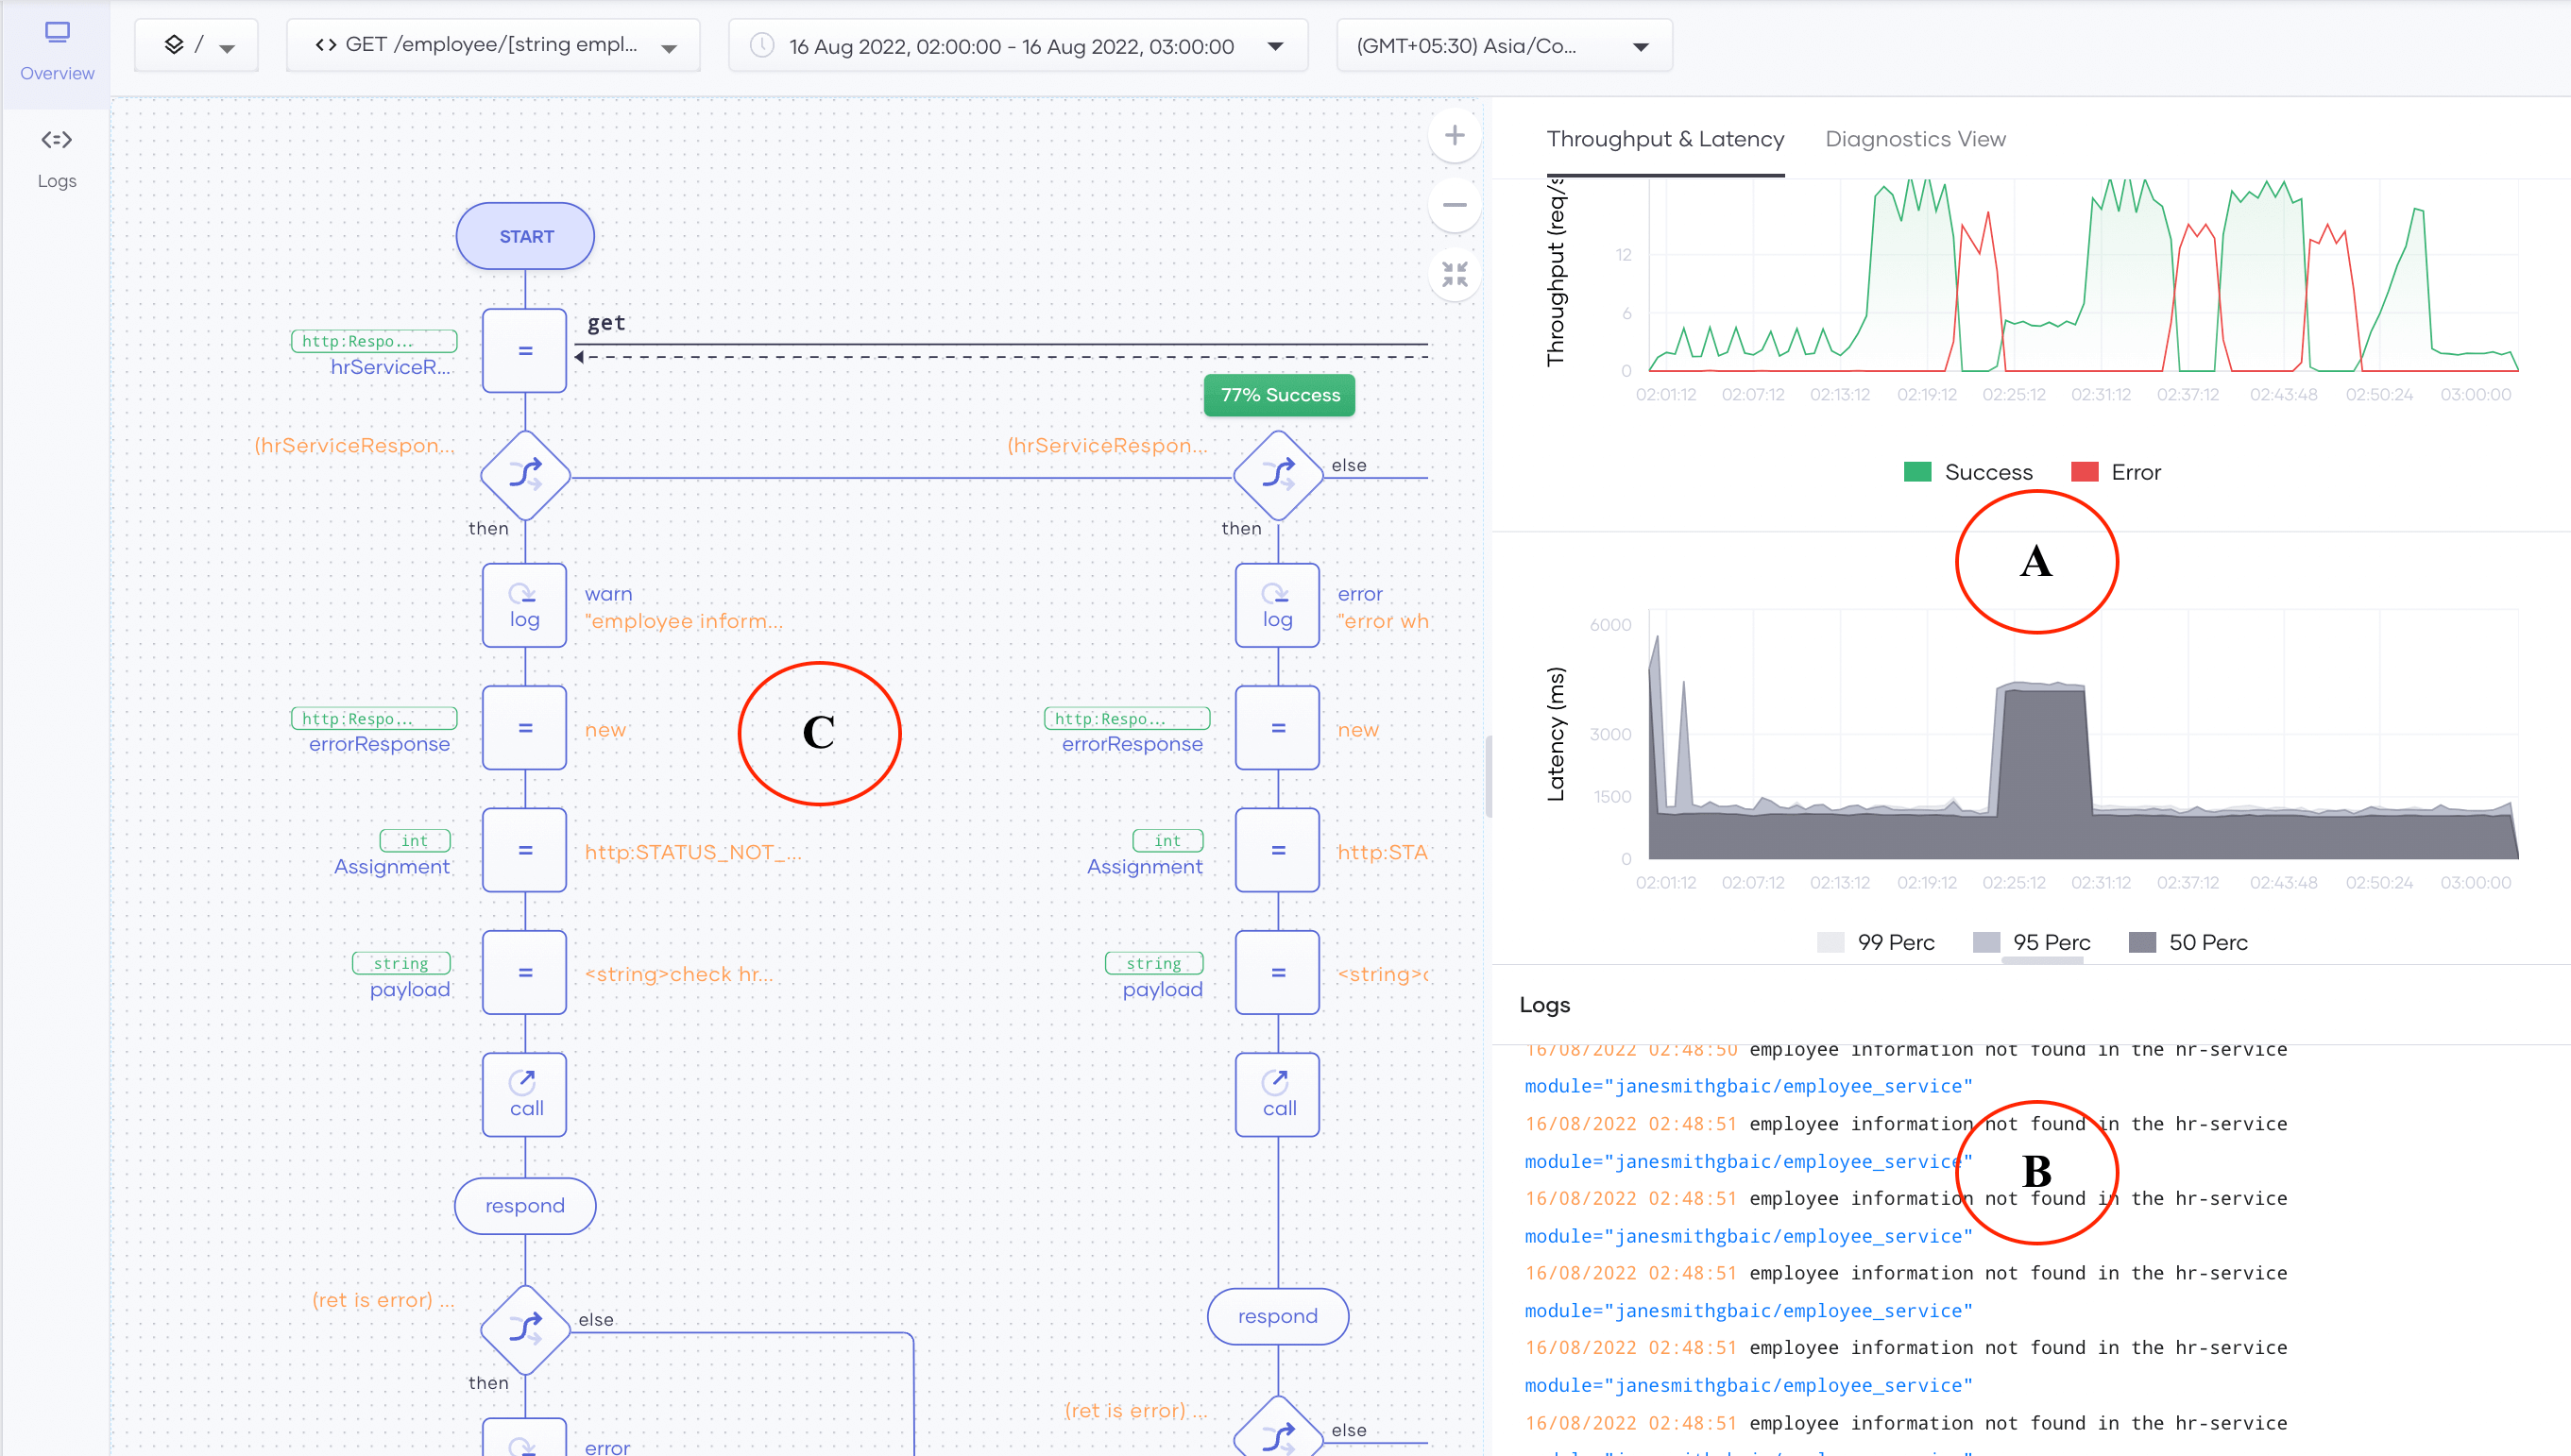
Figure 2: Observability view
2. Next, let’s focus on latency and throughput (processing rate)
i) View the latency and throughput during the anomaly period
As the first step of an RCA, we can analyze how the latency and throughput changed during the time where the abnormal behavior occurred. We can expand the graph in section A of Figure 2 by clicking and dragging the pointer over the period we want to drill down. Alternatively, we can also use the top panel to select a custom time range. We observed the abnormal behavior around June 16, at 2:20. Therefore, let’s select the region from 2:30 to 2:40.
ii) Analyzing the drill-down throughput and latency graphs
Once we have selected the time range, we can study the throughput and latency of the application for both successful and failed responses as shown in Figure 3.
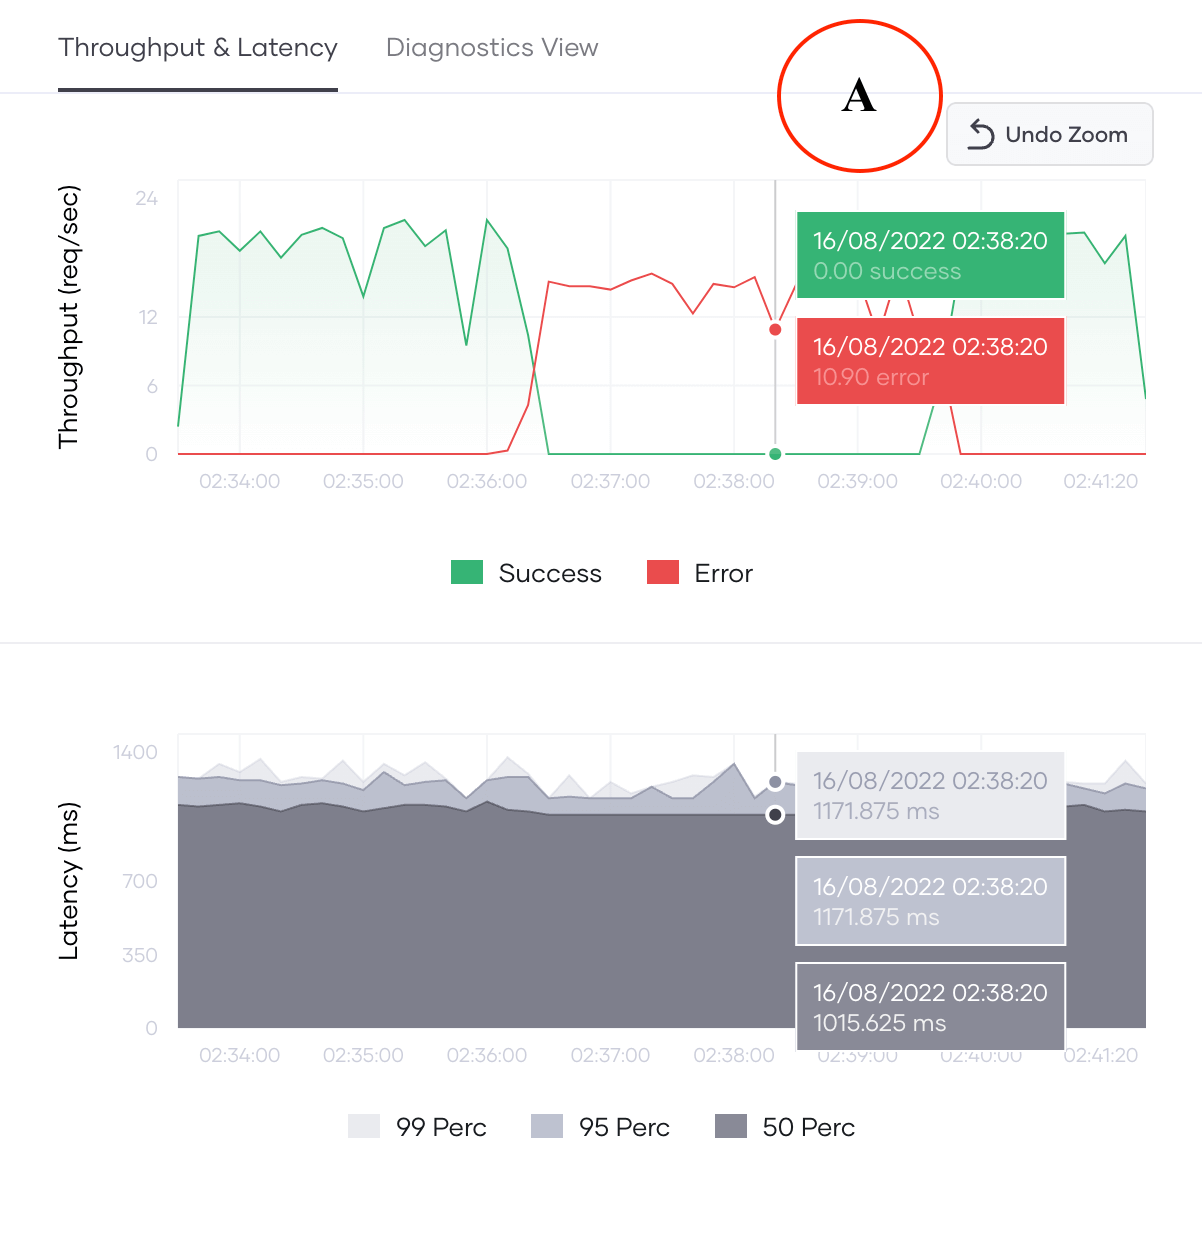
Figure 3: Expanded throughput and latency graphs
We can see the following observations:
a) At around 2:35:50 the throughput of successful requests has become zero, whereas the throughput for erroneous requests is 15 req/seconds.
b) Before 2:36:00 and after 2:40:00 all requests have been successful with a throughput closer to 20 req/seconds.
Therefore, it seems the abnormal behavior is temporary and the app has recovered after a few minutes. This could be an indication of failure in an I/O call or the network.
Moreover, we can investigate the latency percentiles (50th, 95th, and 99th). The latency percentiles values of erroneous regions are similar to the percentiles observed for successful requests before observing the erroneous behavior. With this information, we can assume the error is not related to the connection to the application, since the application has tried to perform at the same level of processing even for erroneous requests.
3. Analyzing the application logs
Since the error occurs within the application, we may find some useful information in the application logs (error logs) as shown in section B of Figure 2. Let’s go deeper into the logs that are shown below that show the throughput and latency plots as shown in Figure 4.
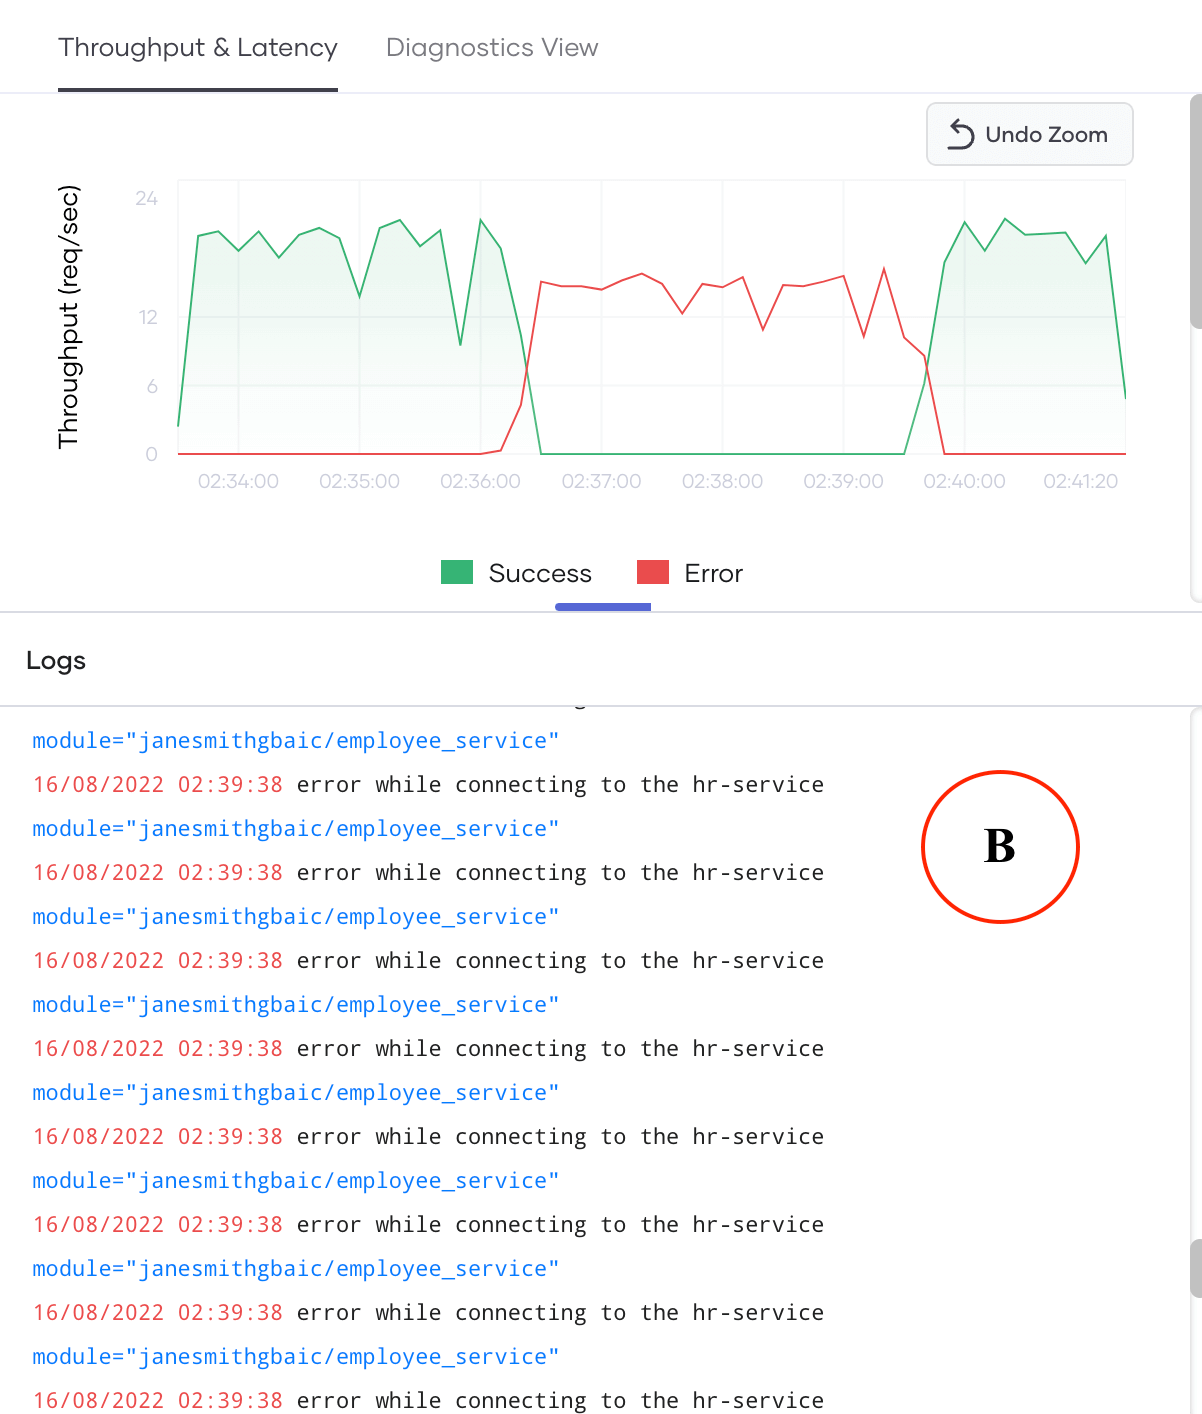
Figure 4: Looking at the logs from the observability view
Confirming the assumptions that we made by looking at the throughput and latency plots, we can see many error logs (as shown in red), that indicate the connection to the hr-service has failed. Unless we know the source code well, we won’t know much about which code snippets or actions raised this error. For now, we know it is a connection failure.
4. Inspecting diagnostics
However, we still can’t be sure whether this is the only error that causes the behavior we have observed. Let’s switch to the Diagnostic View tab, which presents unique logs with their frequencies, application metrics, and system metrics as shown in Figure 5.
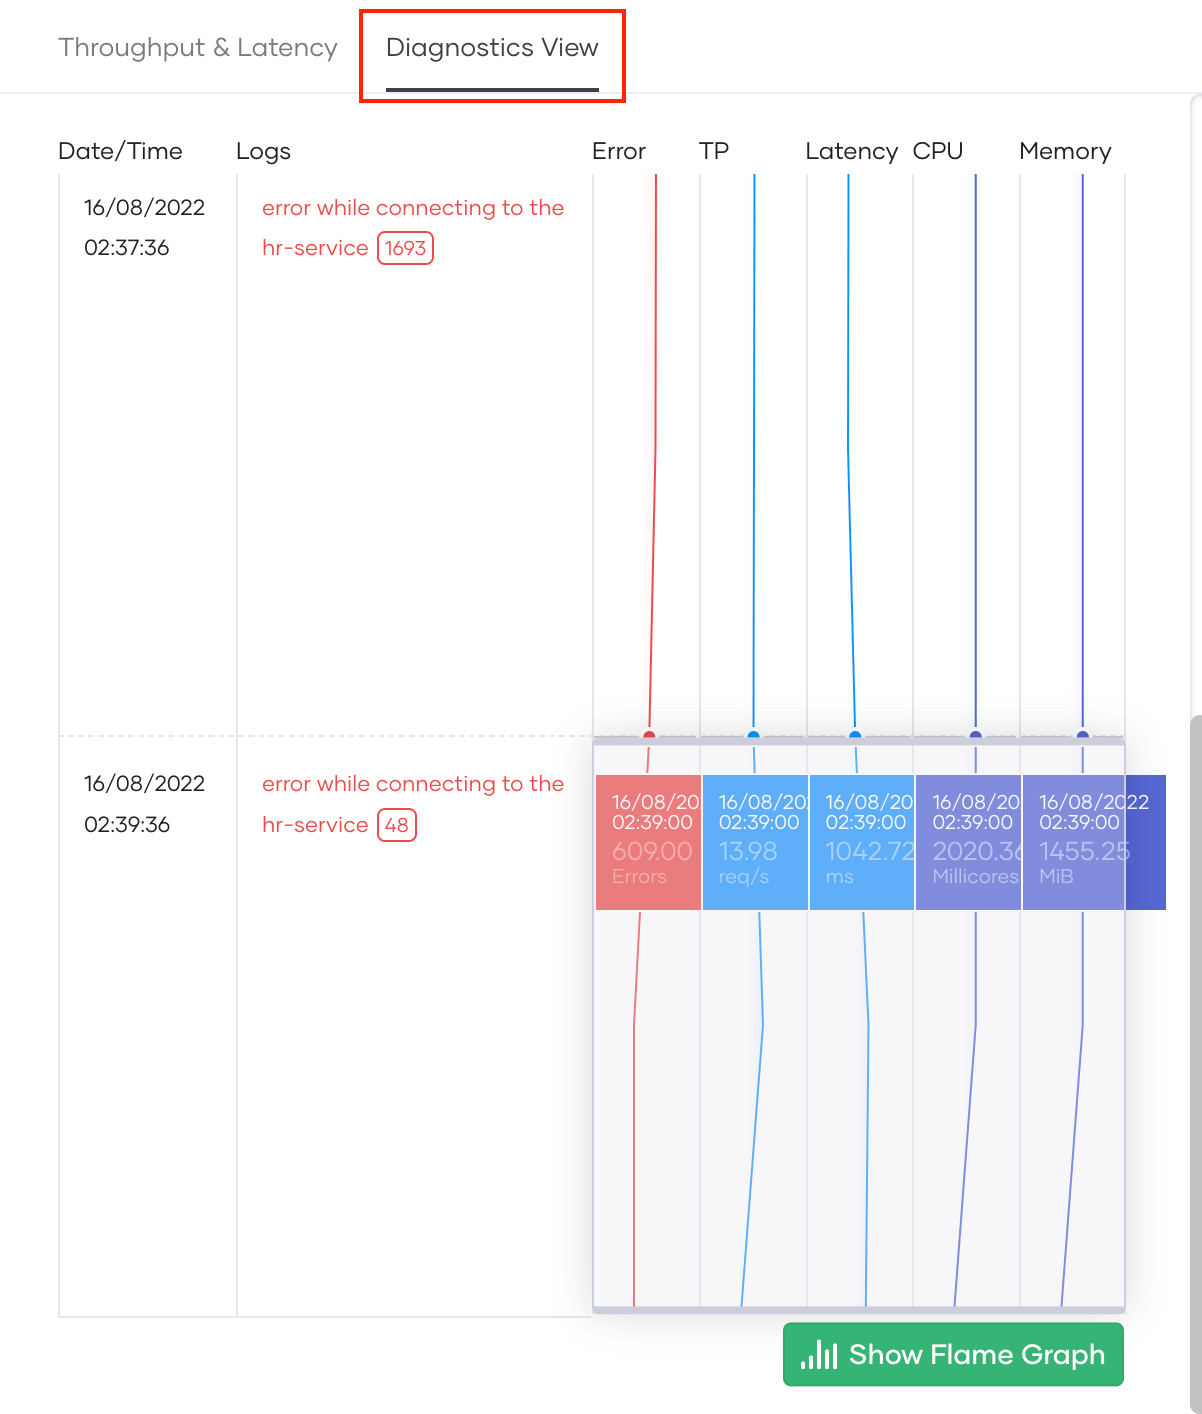
Figure 5: System metrics and application metrics together, and the individual log counts
On the left, we can see unique logs with their frequency, and on the right, we see the application metrics (error count, tps, latency, etc.), system metrics (CPU usage (milli-cores), and memory usage (MiB)) of the application. Although CPU and memory usage metrics aren’t that relevant for our analysis, they can detect any issue related to high CPU or memory leaks. For our scenario, we can see that almost all error logs indicate a failure in connecting to the hr-service.
5. Tracing the individual request
If we know the source code well enough to understand which code segments are causing the issue, we can stop the RCA at this point. However, in most cases the actions or execution path that have led to the errors we encounter is unclear to the RCA engineers. To analyze this, we can dig deep into the execution path of each request using Section C in Figure 2 as illustrated in Figure 6.
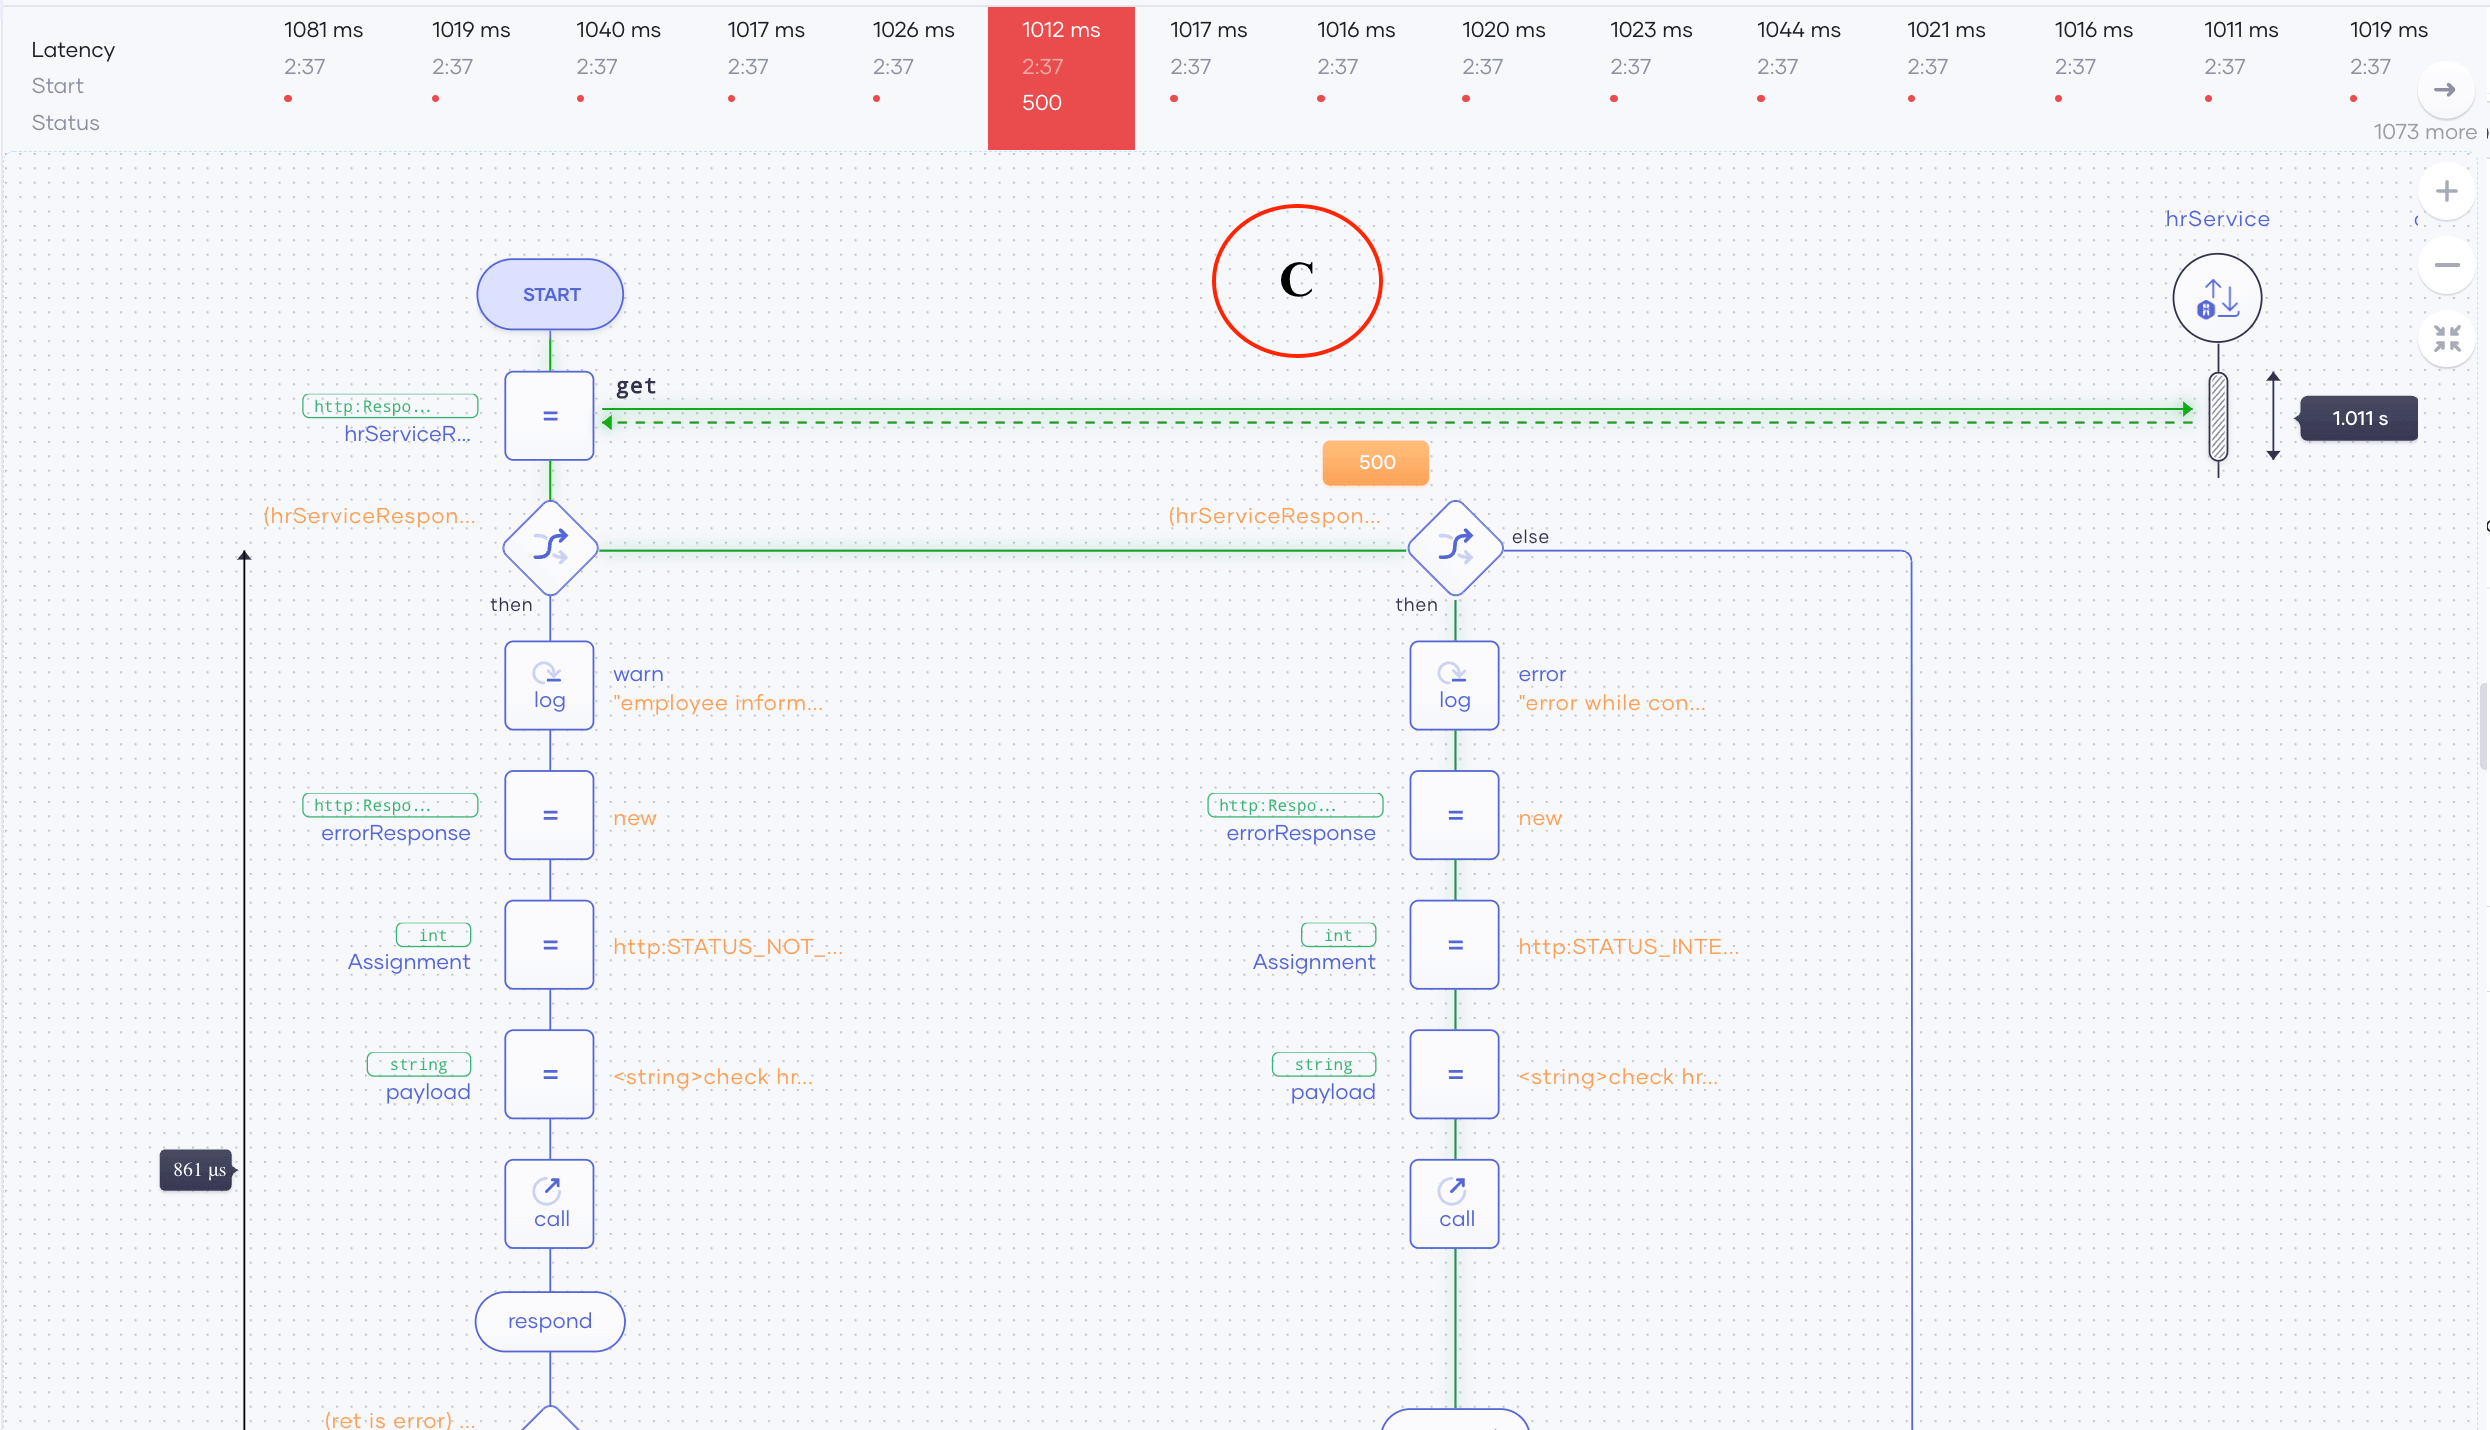
Figure 6: Tracing an individual request
To identify the execution path that an erroneous request traveled in:
a. Click on a point from the throughput or latency plots within the bad erroneous request region.
b. From the pane that appears above the low-code diagram (as shown above), click on a single request as shown in Figure 6.
c. We can now see the execution path of the request we selected and understand which code segments and actions have led to the system’s failure. This is shown in Figure 7.
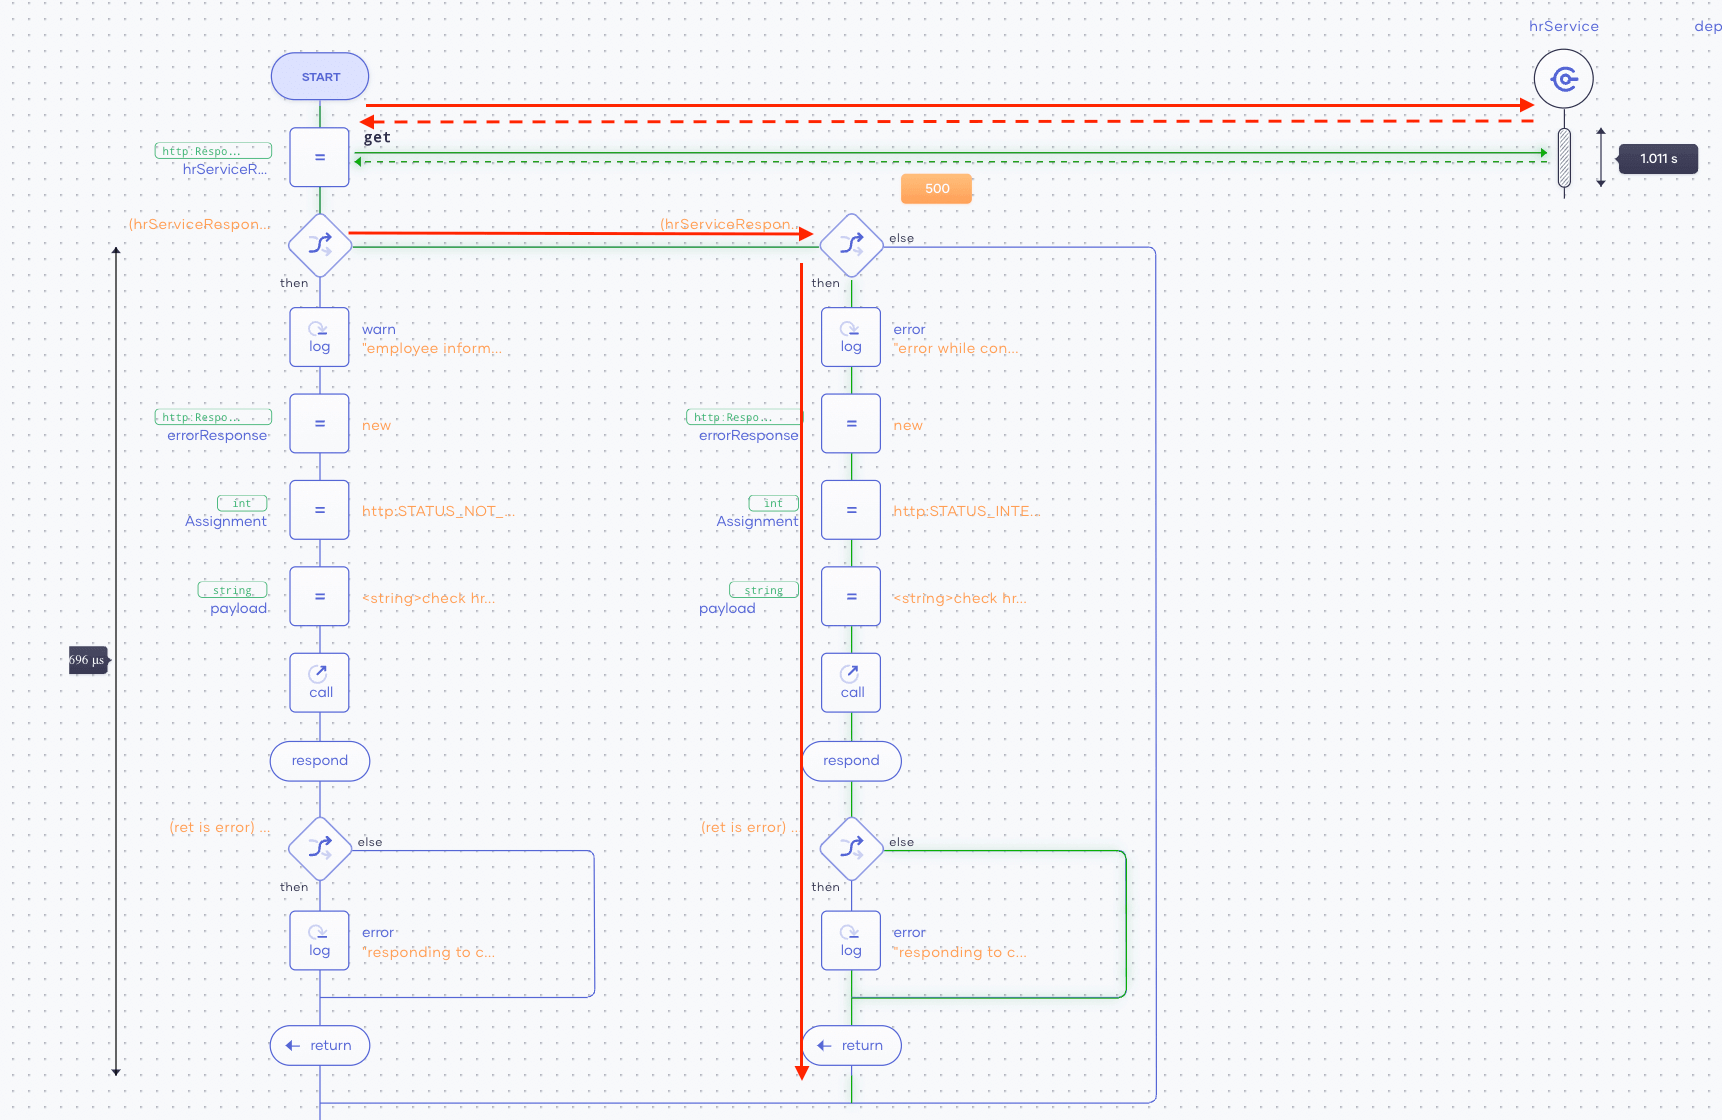
Figure 7: Traces for the individual requests are highlighted in green
In Figure 7, we can see the execution path is highlighted in green. To improve the visibility, we have re-annotated it with red arrows. If we follow the execution of the request, we can see it calls an external service (hr-service) using HTTP GET. That service call seems to return an HTTP500 error code. This is shown in Figure 8.
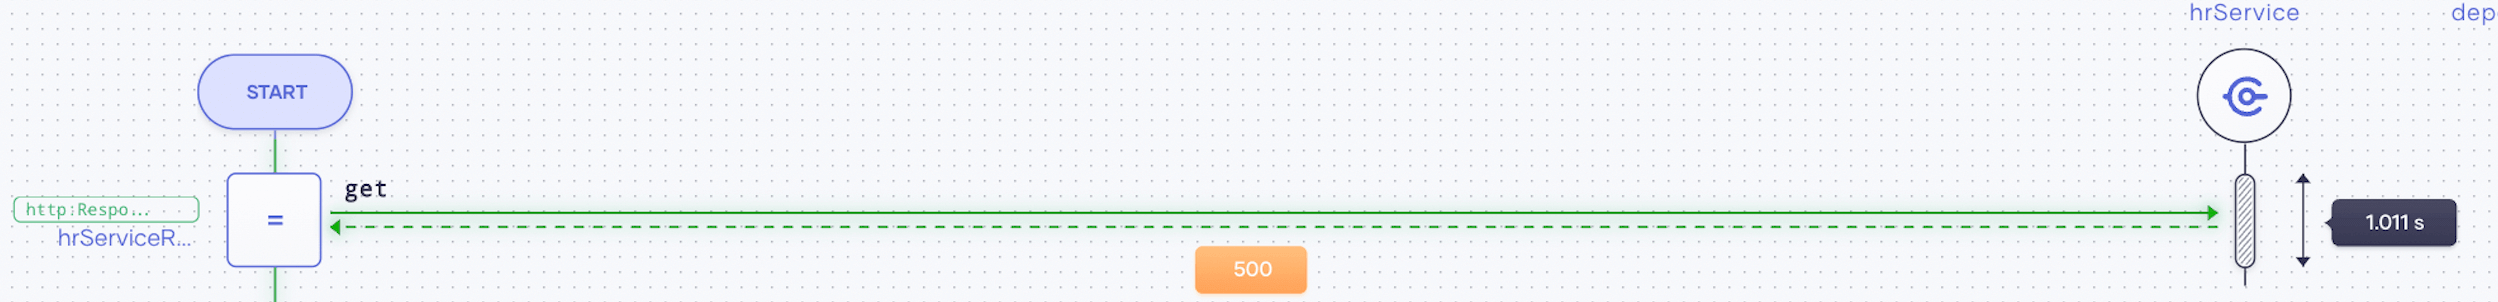
Figure 8: HTTP status codes are show for external calls
Due to the unsuccessful request to the external service (hr-service), the app can’t continue the accepted path of its execution. Therefore, the root cause of this issue is the unavailability of the external hr-service due to an internal server error. This is why our app users kept receiving erroneous responses.
This tutorial explains how to do a step-by-step RCA considering a scenario where users are unable to get the services from an app as intended due to unsuccessful requests. By following the above steps, we were able to pinpoint the reason why the application wasn’t working. To learn more about Choreo, check the official Choreo documentation, including our Quick Start Guide.