View Runtime Details
In WSO2 Developer Platform, you can view details about running replicas of a component in a specific environment (i.e., Development or Production).
To view the runtime details of a component, follow the steps given below:
- Sign in to the WSO2 Developer Platform Console.
- In the Component Listing pane, click on the component for which you want to view runtime details.
- In the left navigation menu, click DevOps and then click Runtime. This opens the Runtime page populated with data retrieved from the underlying WSO2 Developer Platform data plane.
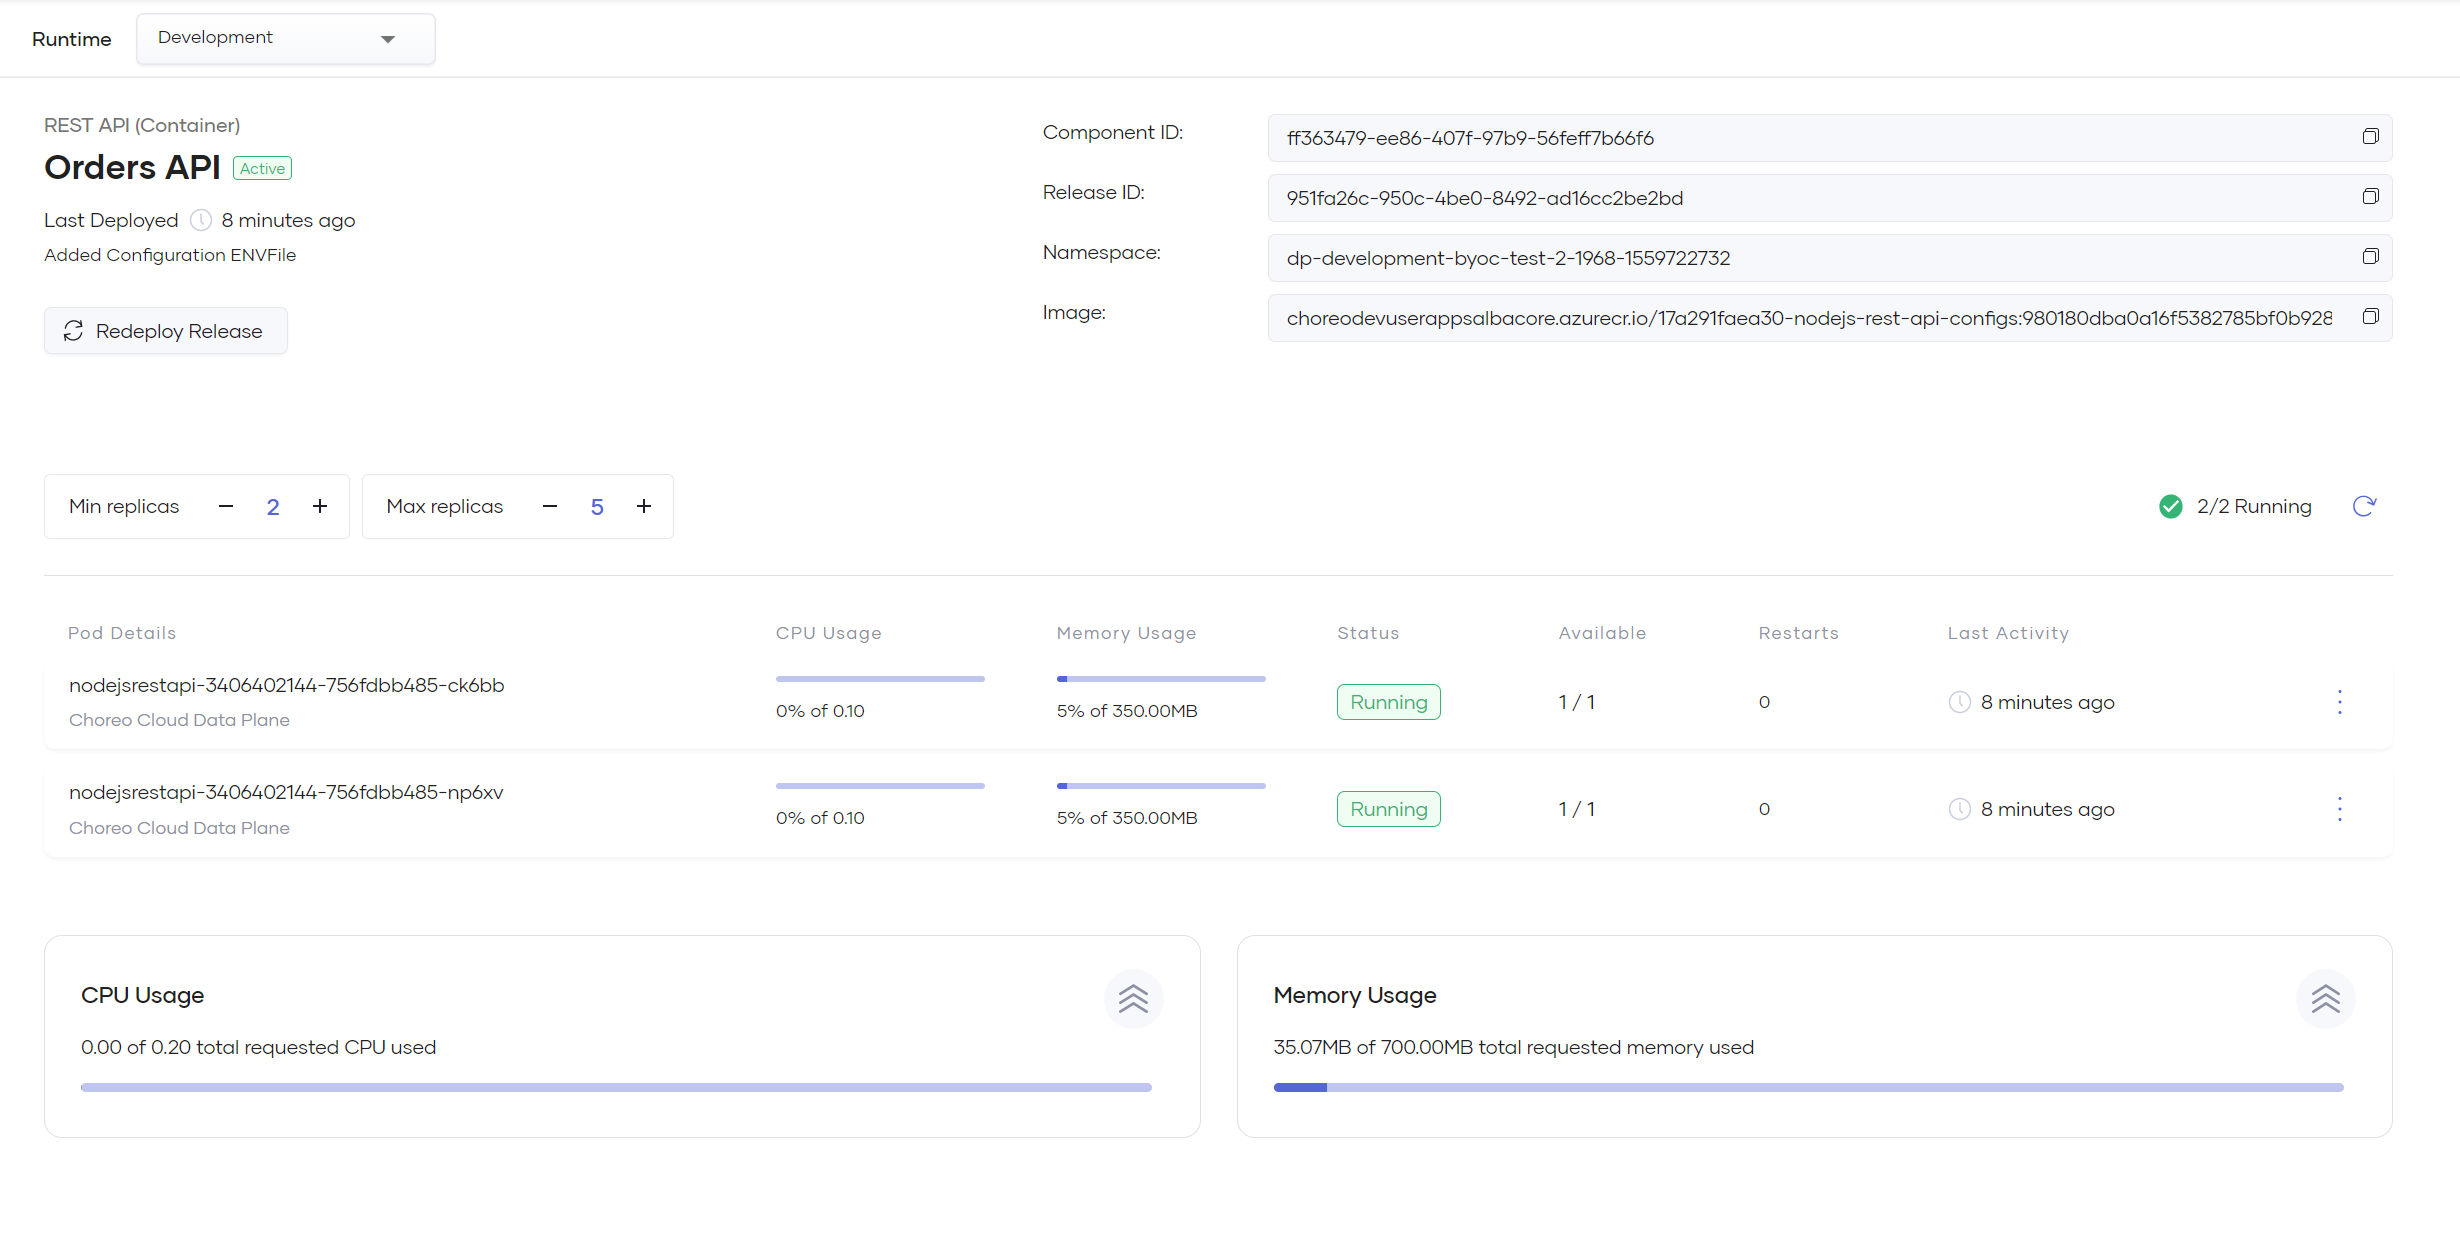
The runtime details you can see here are analogous to a zoomed-in view of a specific environment on the Deploy page.
The following topics walk you through the specific details you can view and actions you can perform via the Runtime page.
Redeploy a release
On the Runtime page, you can click Redeploy Release to immediately redeploy all resources, including configurations and secrets, to a specific environment. This triggers a rolling update to sync all the latest changes to the data plane.
What is a release?
A release in WSO2 Developer Platform uniquely identifies an underlying deployment of a component to an environment for a given version. For example, if you deploy a component to two environments across two versions, the component will have four active releases.
The capability to redeploy a release also allows you to quickly restart all the running replicas of a component in a specific environment.
View running instances
The running instances you see on the Runtime page provide insights into the active replicas of your component in the selected environment.
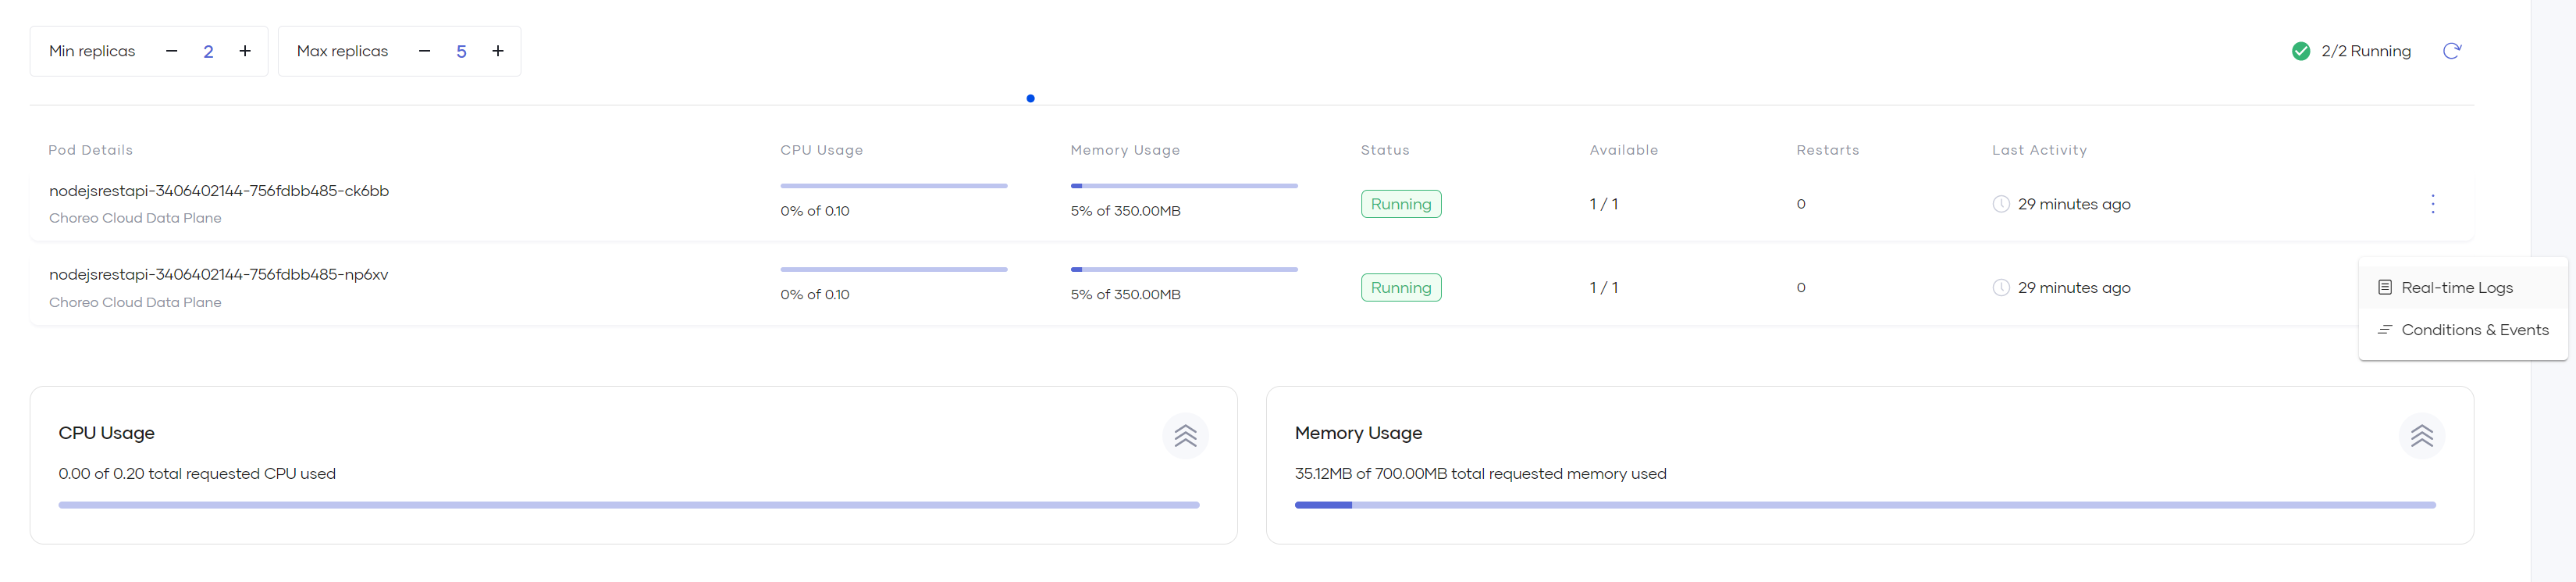
- You can view details of each active replica and its associated real-time CPU and memory usage, status, restarts, and the time of the last activity.
-
If you want to see the real-time logs and information on conditions and events of a replica, click the menu icon of the replica and then click Real-time Logs or Conditions & Events depending on what you need to view. These options provide insights that help to diagnose issues in deployments.
Note
- All metrics such as the total and replica-level CPU and memory usage displayed on the Runtime page are real-time data and are instantaneous representations of a component's current state.
- You can take a look at the observability metrics of a component to see historical data and usage trends.
Observe real-time container logs
Unlike the logs available in the Observability Metrics of a component, these logs are fetched in real-time from the data plane and are not historical. Therefore, you can only see logs of active containers and the last shutdown container.
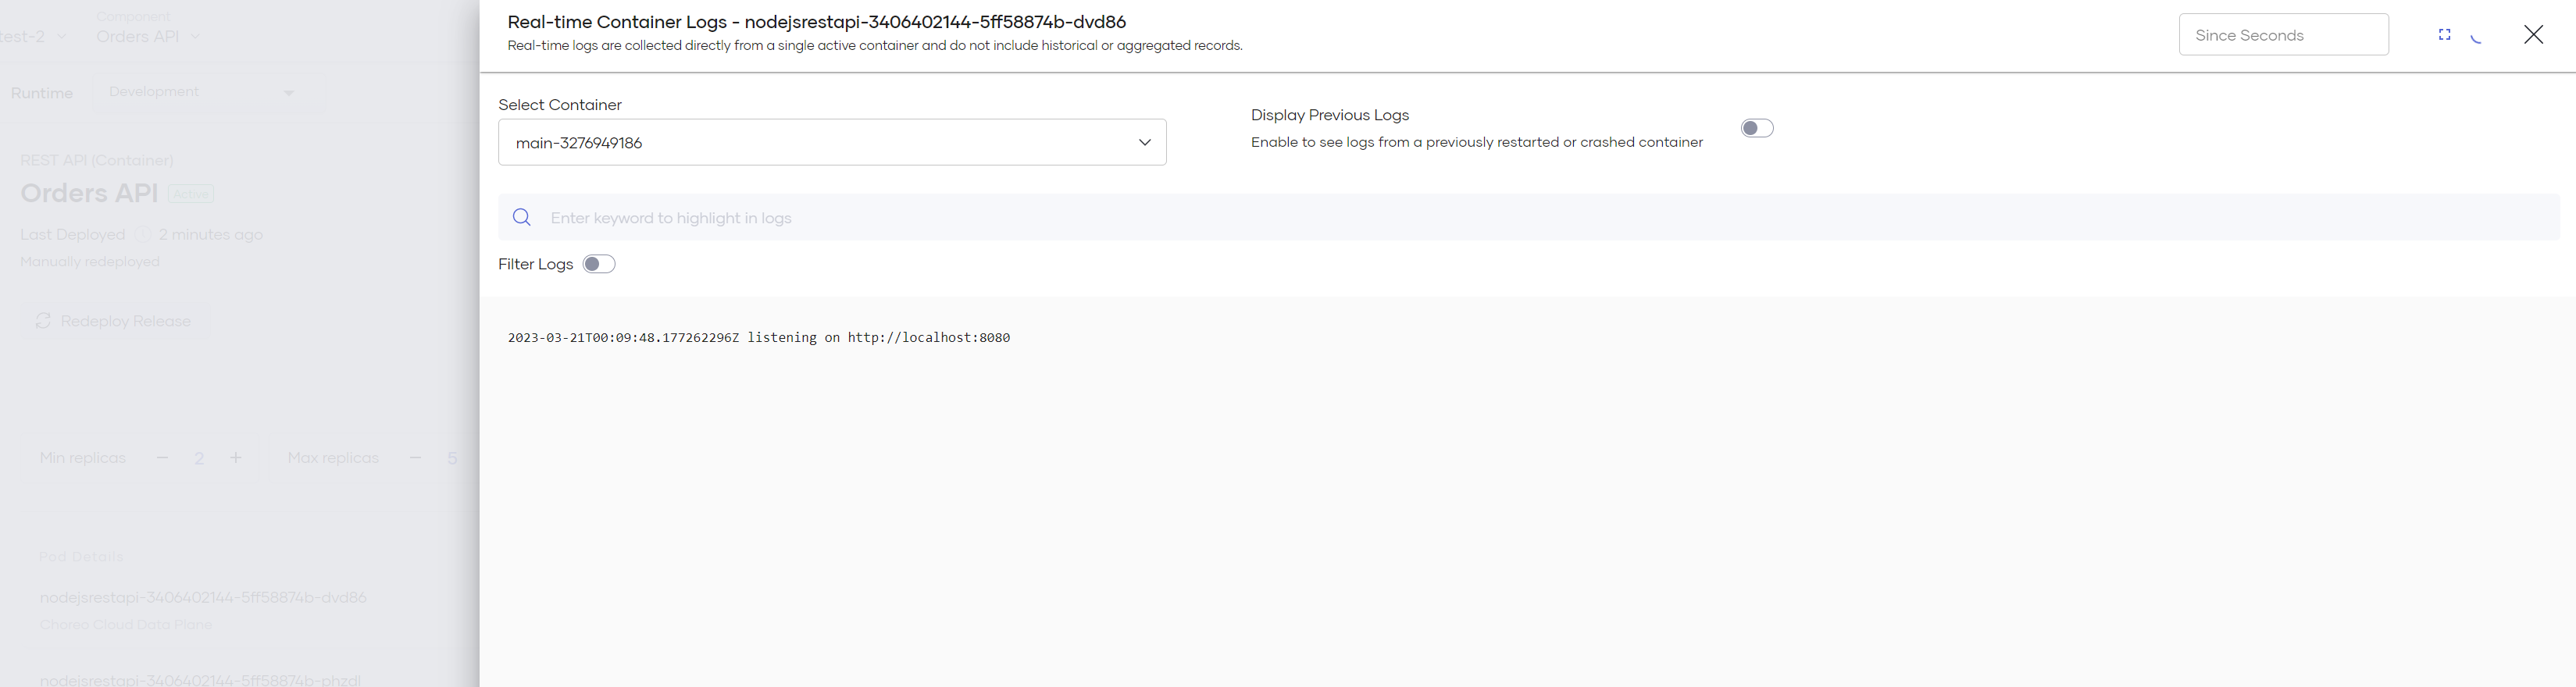
- Display Previous Logs: Enable to retrieve logs from the last shutdown/crashed/restarted container of an instance.
- Since Seconds: Specify the duration in seconds to fetch corresponding logs.
- Filter Logs: Enable to filter and displays matching log lines. This is a fuzzy string search.
View container conditions and events
Conditions and events provide information necessary to troubleshoot failing deployments.
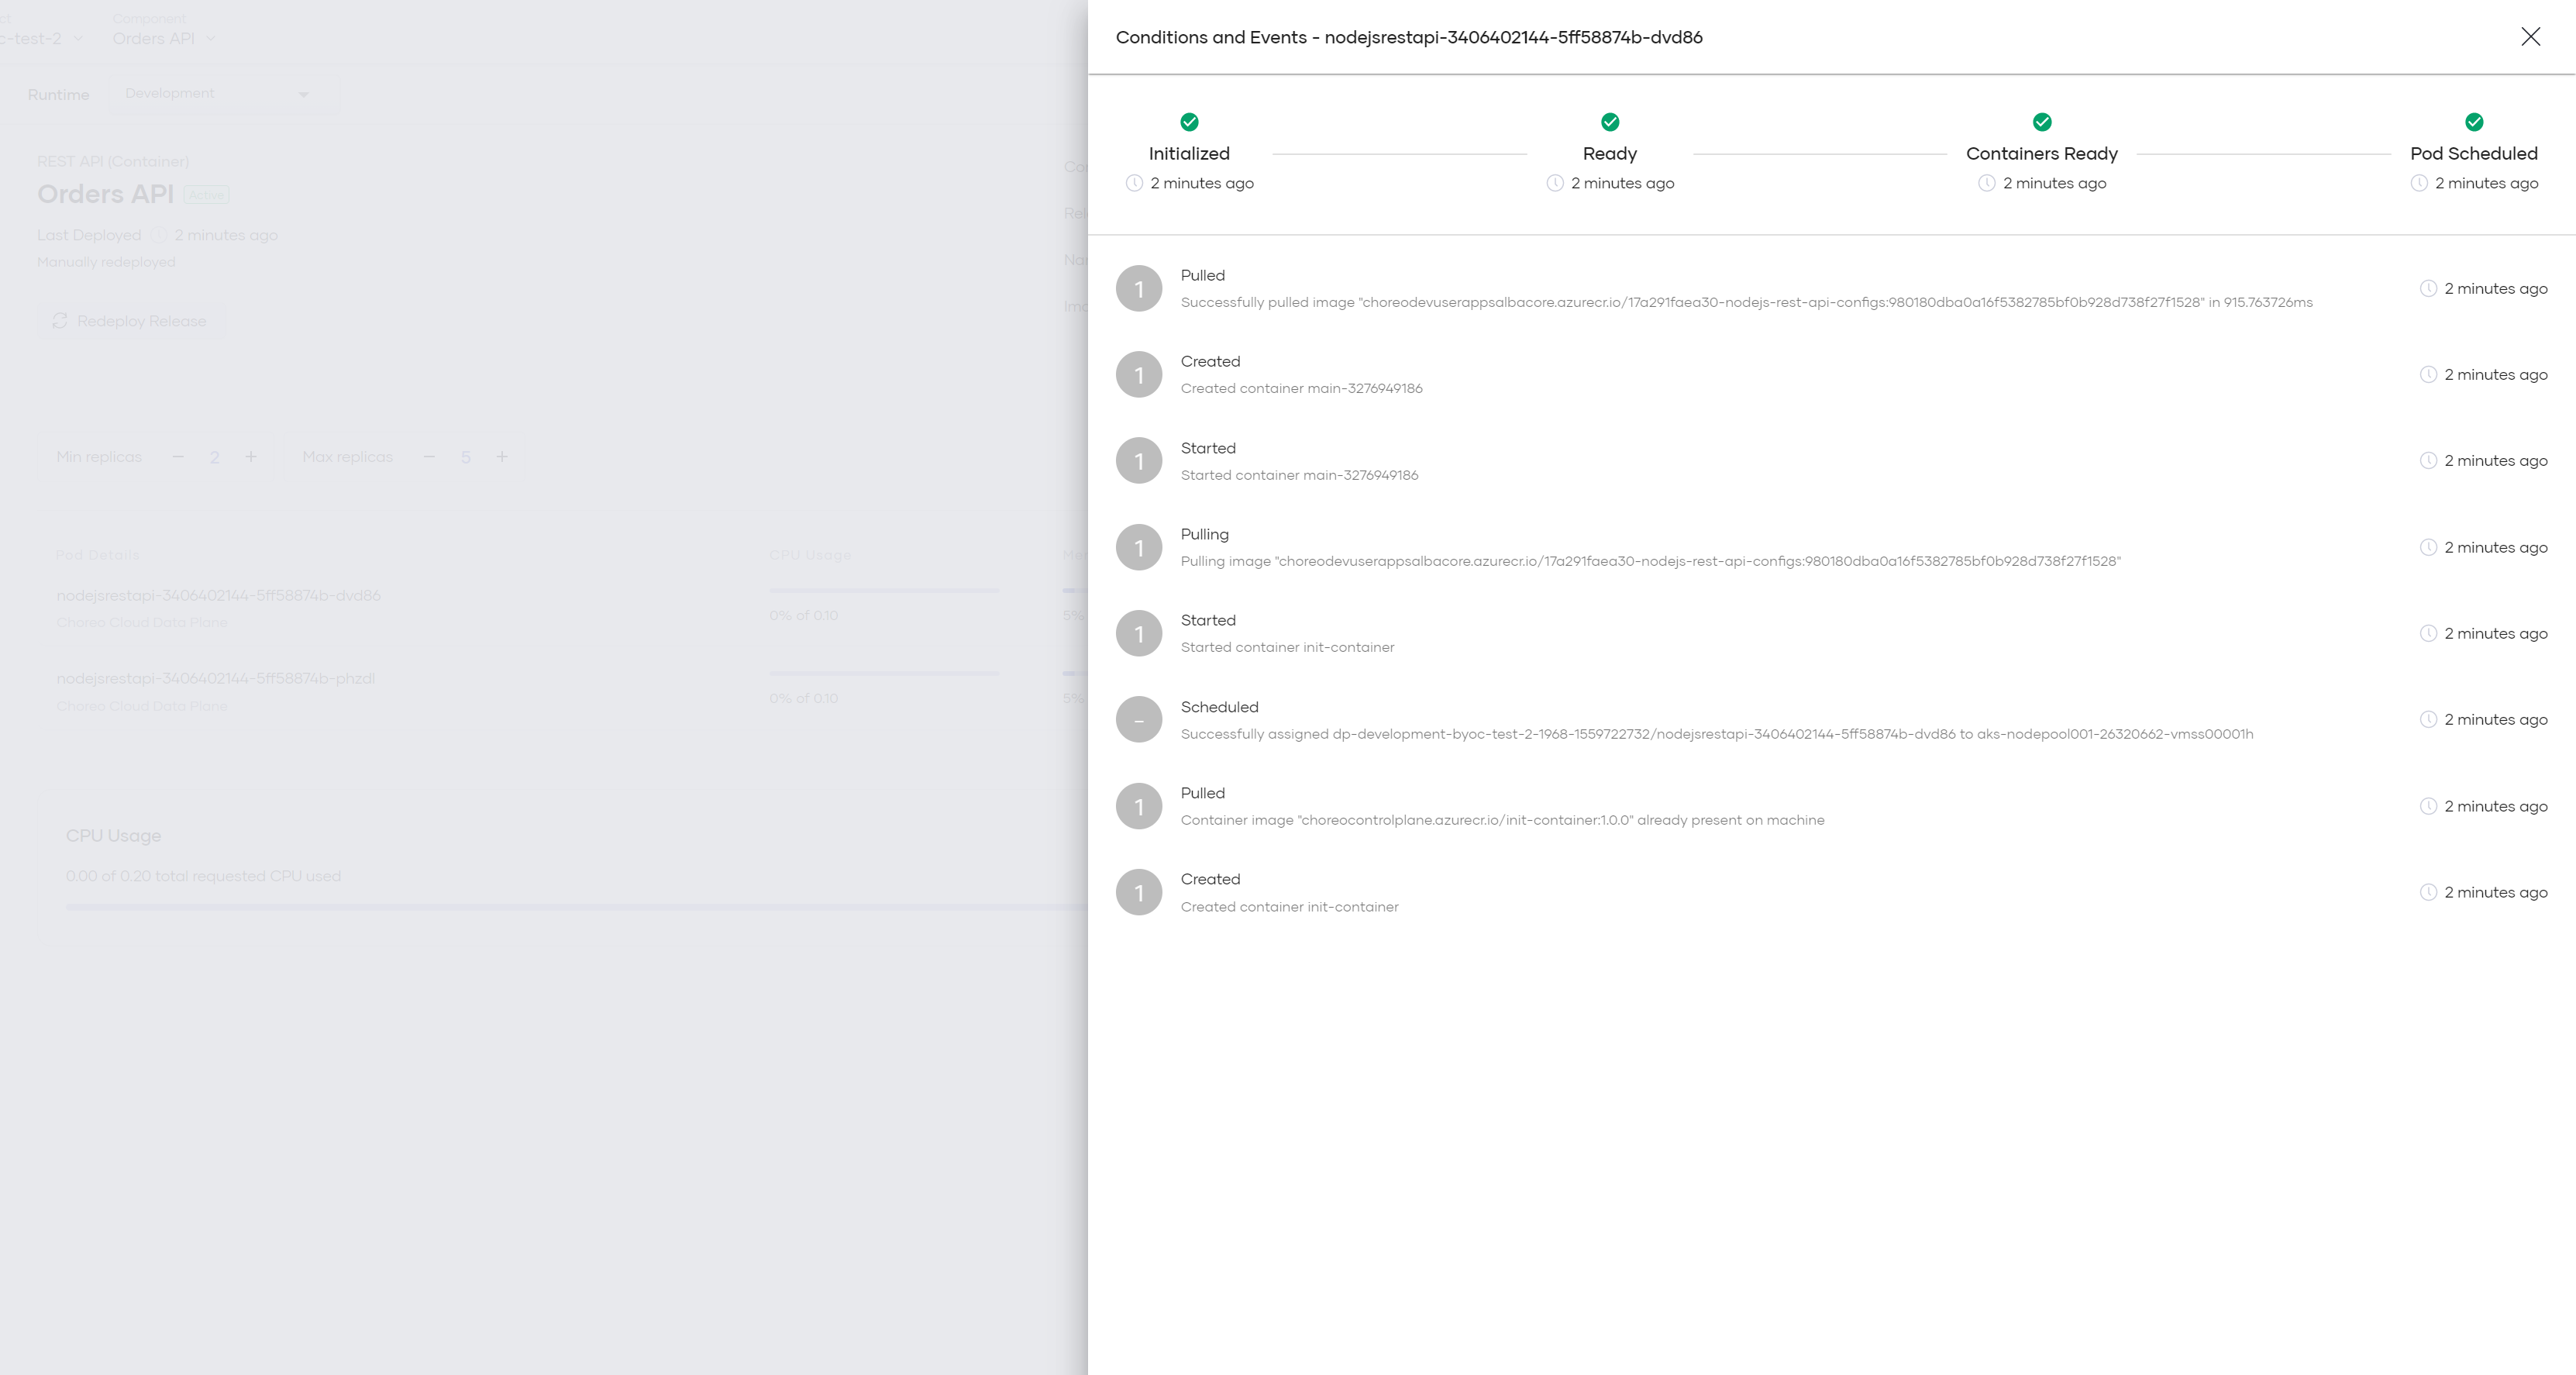
If a component is not behaving as expected and you cannot detect any issues via the application logs, these events can provide necessary debugging information, such as the following:
- Failing health checks (liveness and readiness probes).
- Missing or invalid configuration/secret mounts.
- Missing or invalid storage volume mounts.
- Scheduling issues in the underlying data plane.