Empowering Observability and Insightful Monitoring with WSO2 Developer Platform
Managing applications and services in a cloud native environment requires constant vigilance. However, keeping track of performance, security, and usage can be a challenge. WSO2 Developer Platform simplifies monitoring and observability, offering a comprehensive suite of tools to ensure your apps are healthy and deliver optimal performance.

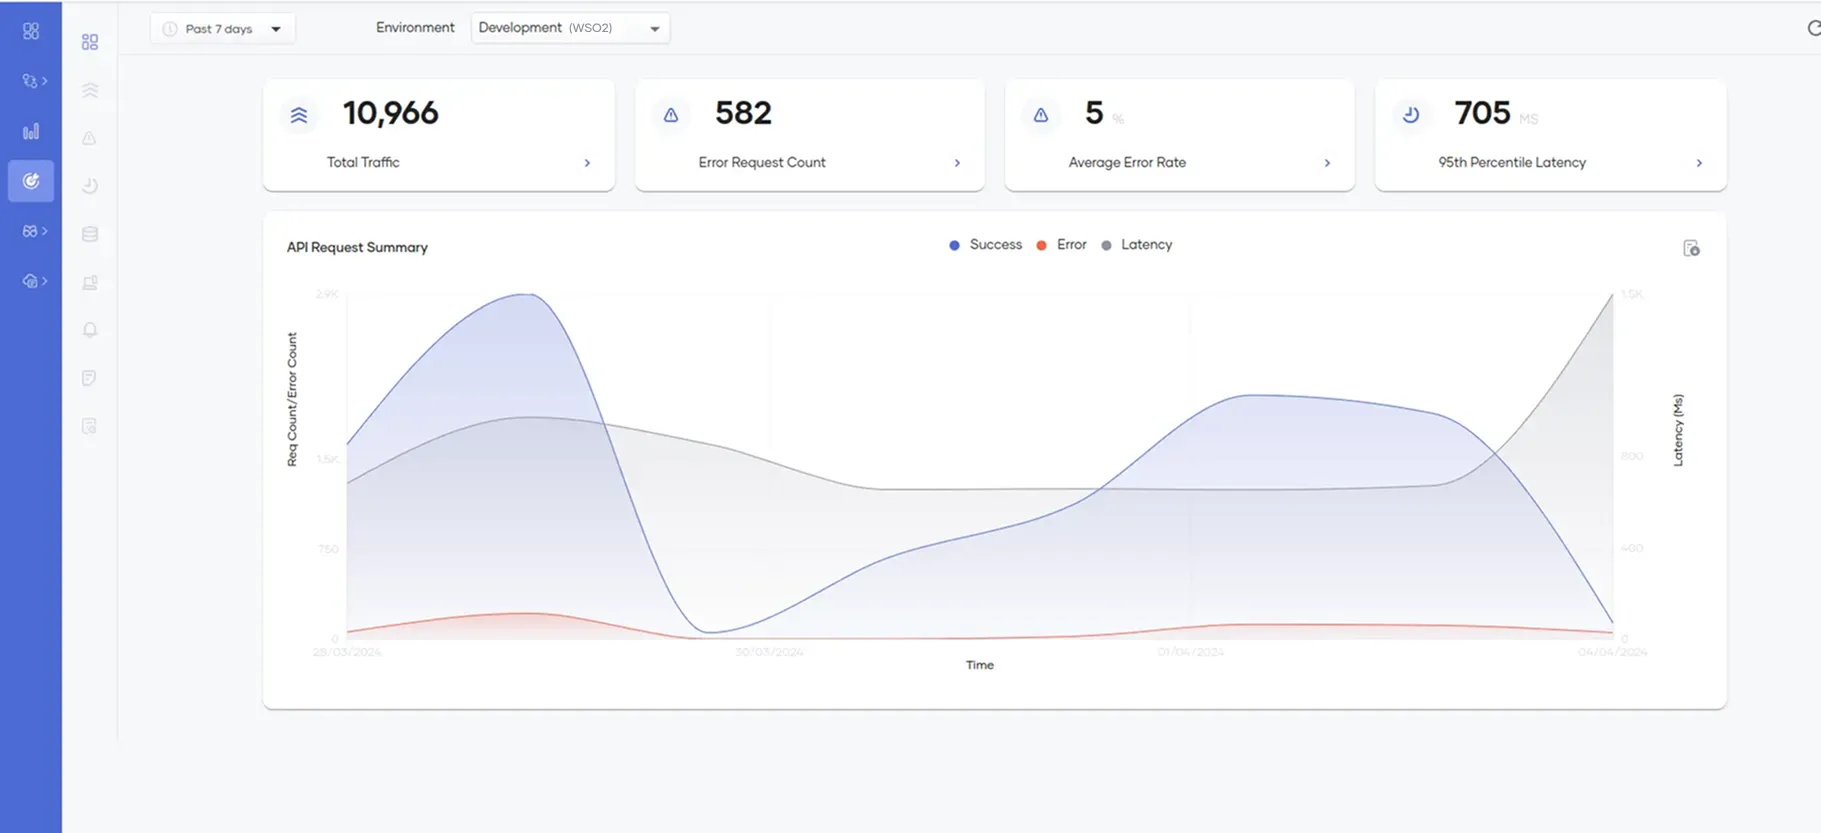
Gain Deep Observability
Track Service Health:
Monitor key metrics like latency, throughput, error rates, and API uptime. Identify potential issues early and ensure a smooth user experience.
 Usage Insights
Analyze Usage Patterns:
Understand user behavior, identify trends, and optimize resource allocation.
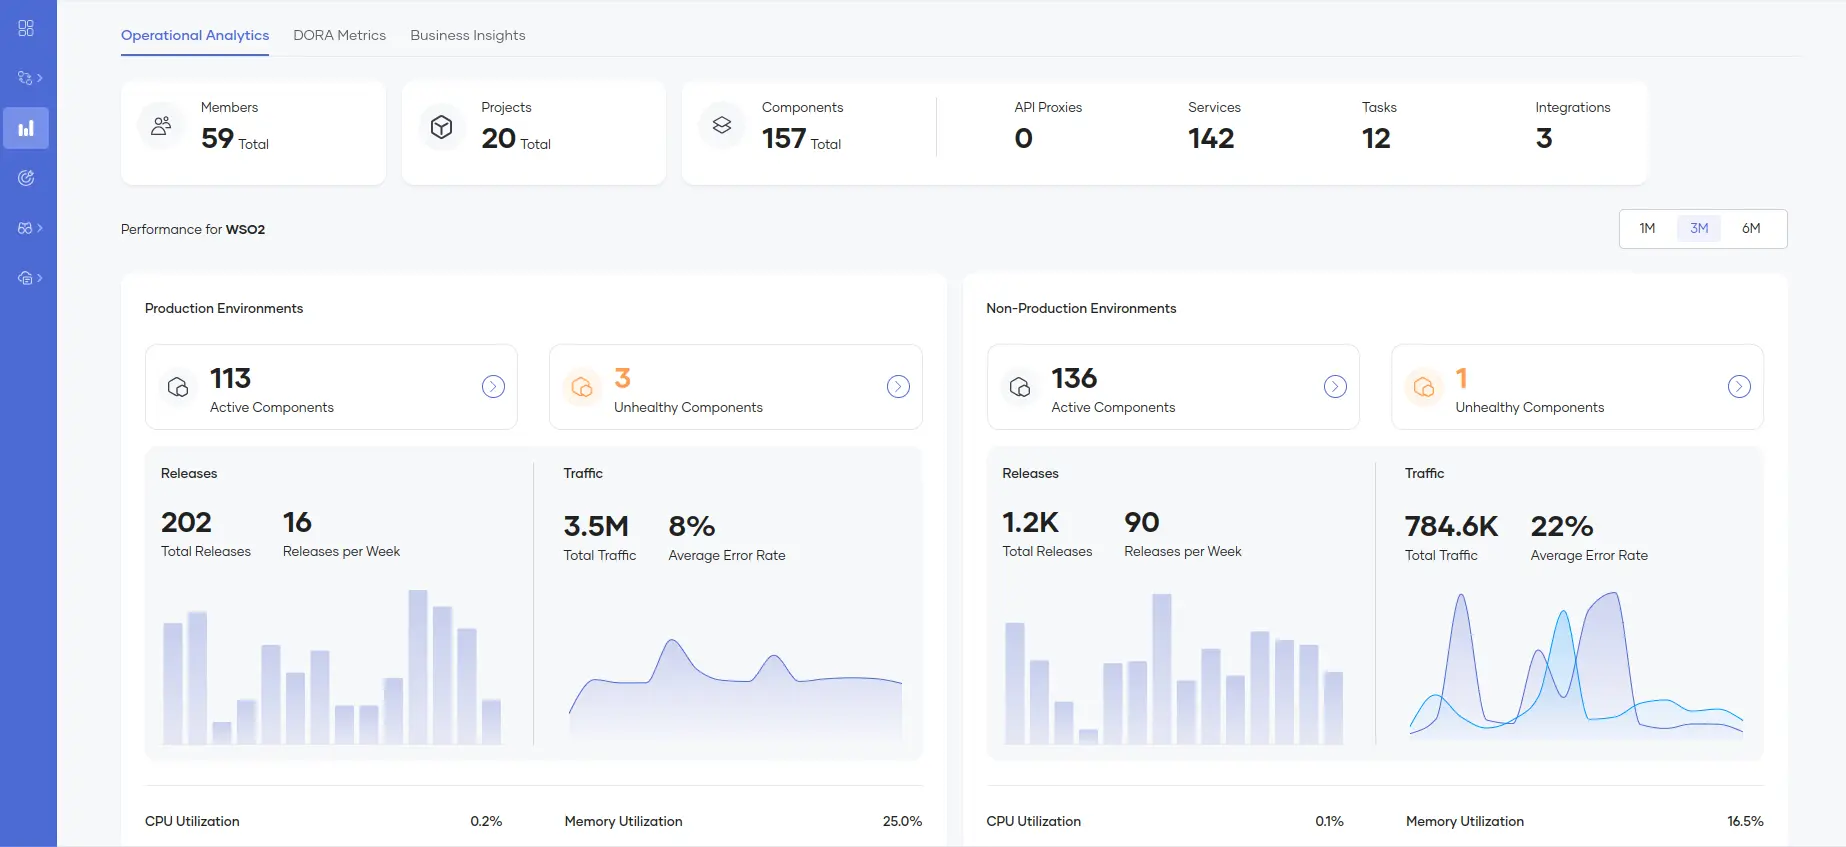 Operational Analytics
View DORA Metrics:
Measure key performance indicators aligned with the DORA (DevOps Research and Assessment) metrics framework. Track your progress towards achieving continuous delivery and high-velocity operations.
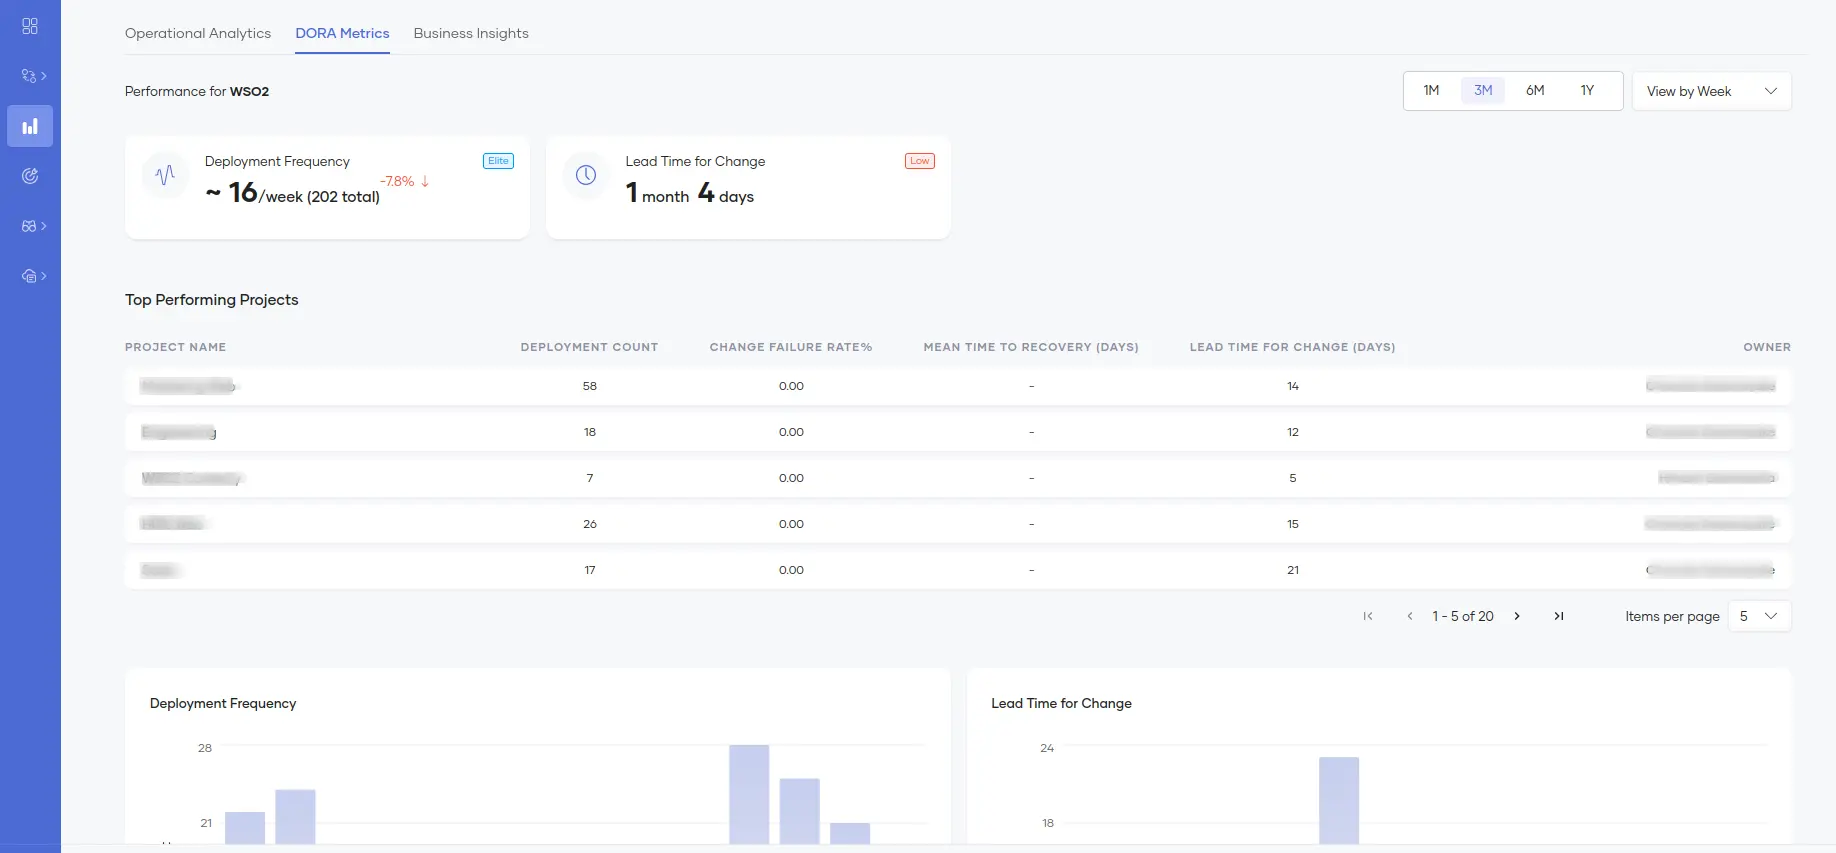 DORA Metrics
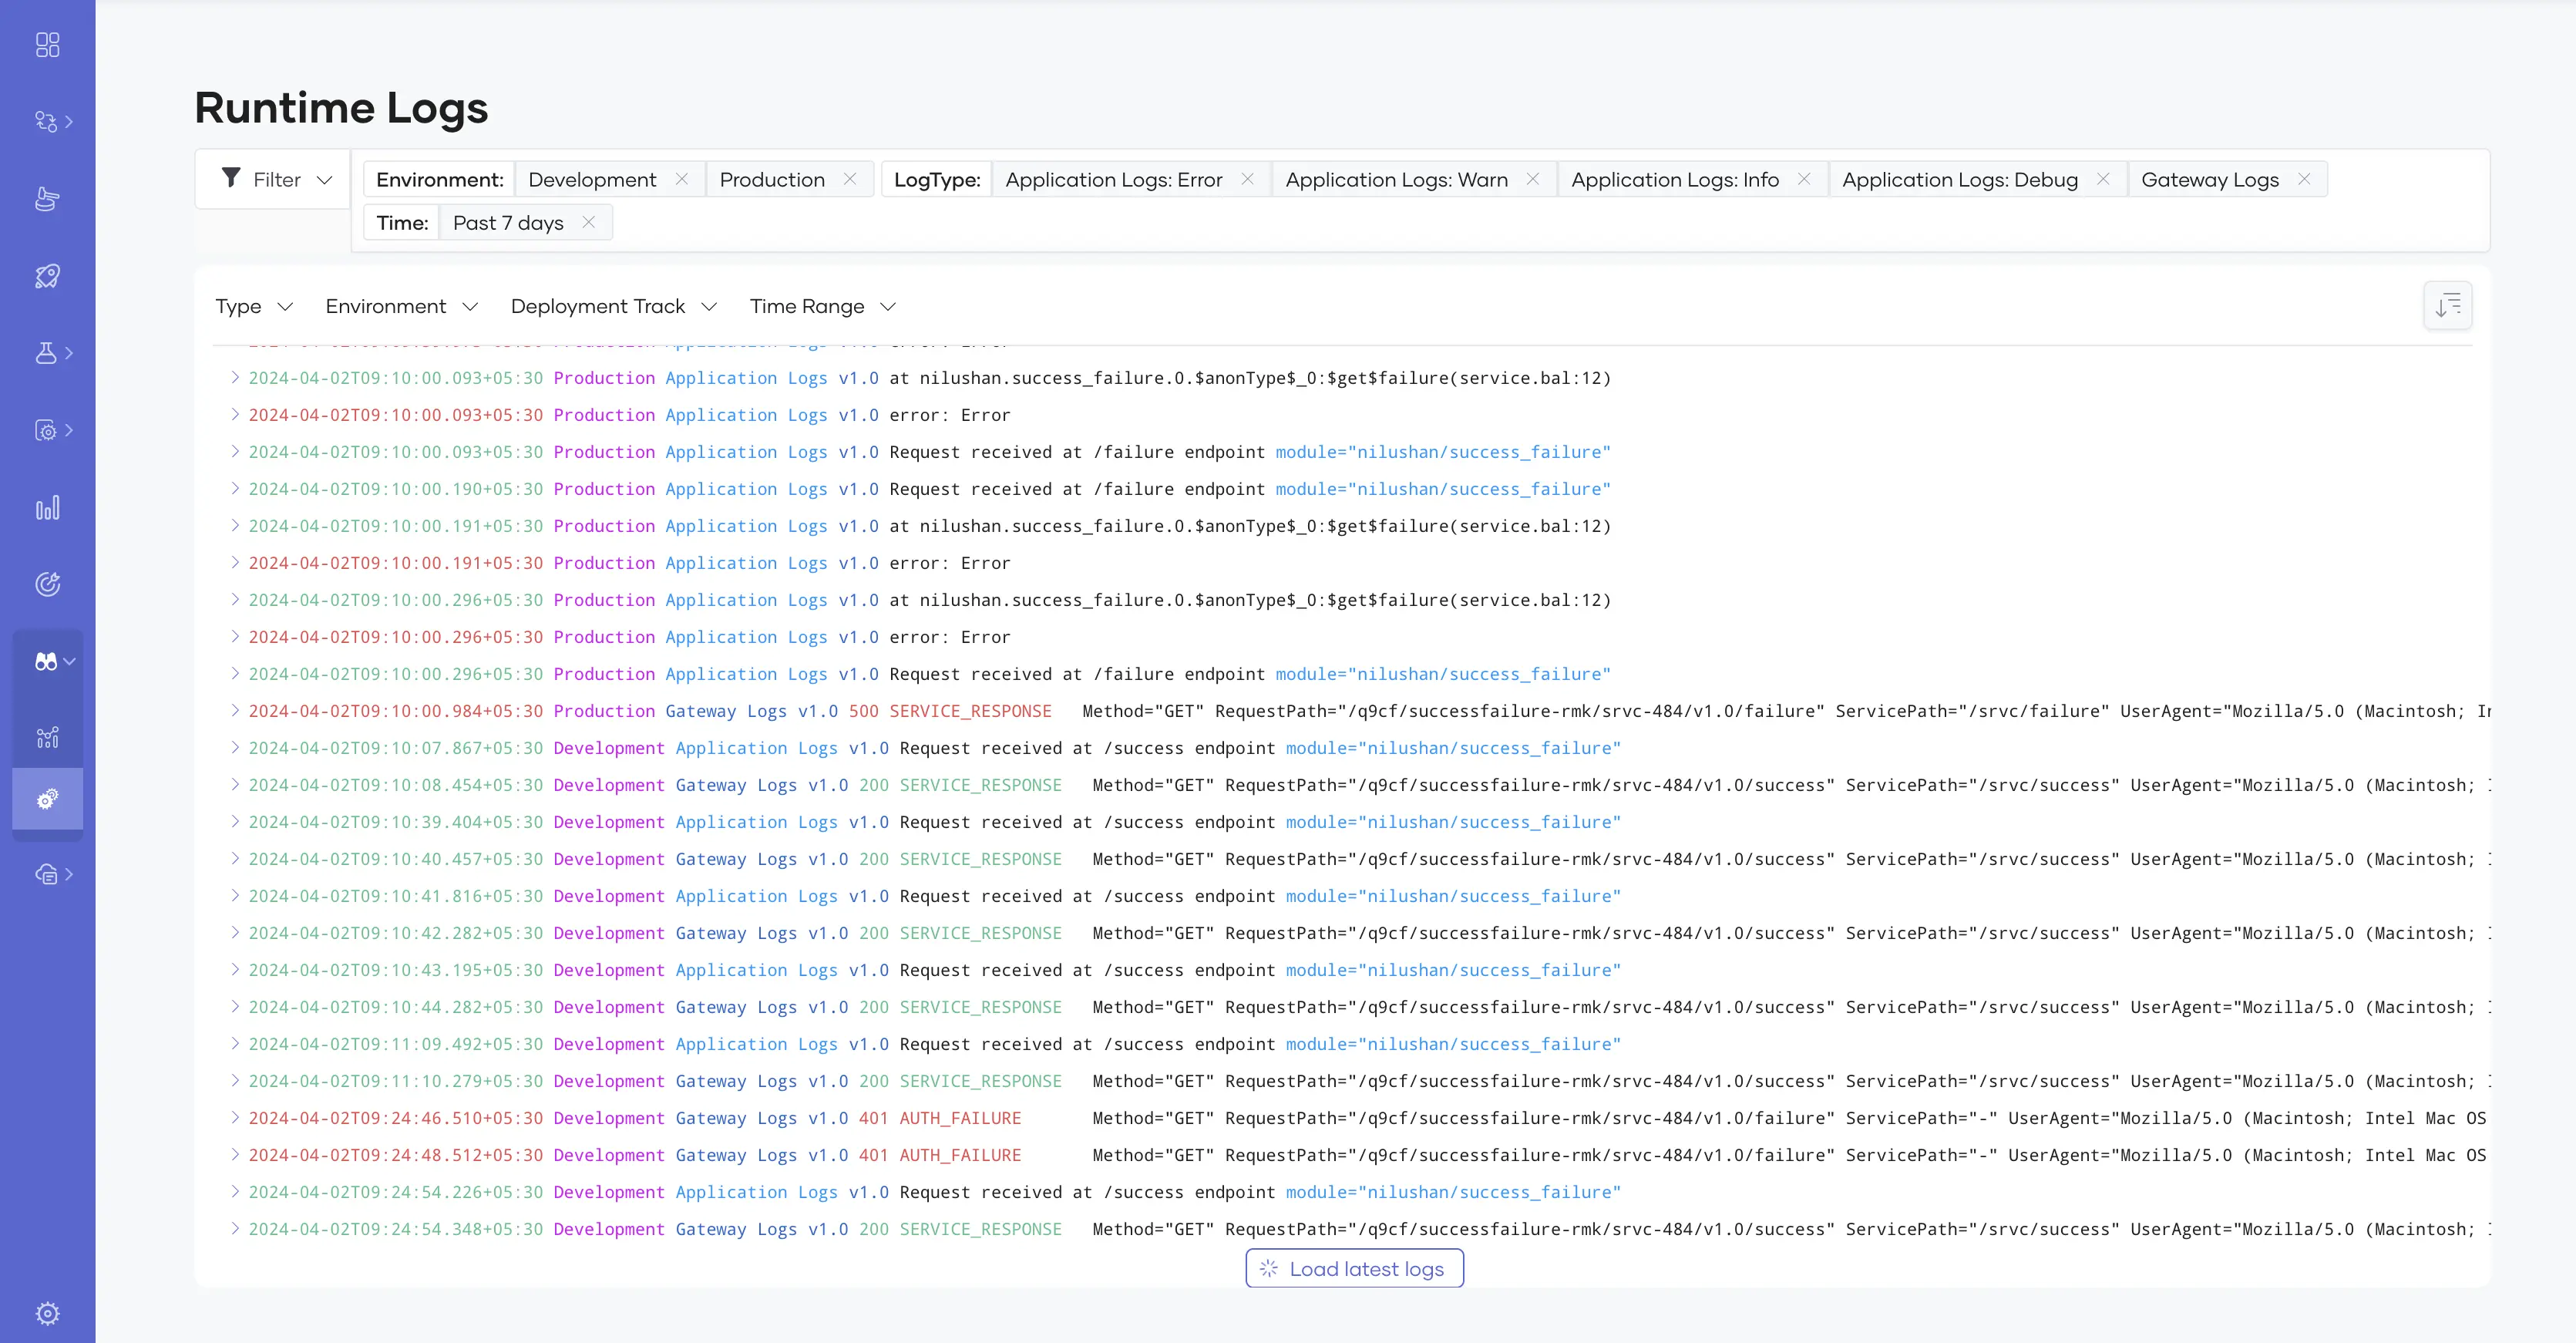
Detailed Log Management
WSO2 Developer Platform provides centralized access to application logs, allowing you to:
Drill Down to Specific Events:
Filter and search logs to pinpoint the root cause of issues. Gain valuable insights into your app's behavior and user interactions.
Correlate Events:
Identify connections between different log entries to understand the broader context of events and troubleshoot more effectively.
Simplify Troubleshooting:
Spend less time digging through logs and more time resolving issues with clear and concise information.
Benefits of Using WSO2 Developer Platform

Proactive
Monitoring
Identify and address performance bottlenecks before they impact users.

Proactive
Monitoring
Identify and address performance bottlenecks before they impact users.

Proactive
Monitoring
Identify and address performance bottlenecks before they impact users.

Proactive
Monitoring
Identify and address performance bottlenecks before they impact users.
Ready to take control of your applications? WSO2 Developer Platform empowers you to gain deep observability into your cloud native applications. With comprehensive monitoring and insightful analytics, you can ensure your applications and services are performing at their peak, delivering a seamless user experience.