7 Billion Calls a Day: One WSO2 Gateway
The Weight of Real-World Traffic
For most digital businesses, the API gateway is invisible right up until it isn't. It sits between every customer and every transaction, and its capacity sets the ceiling on how far the business can scale.
Traditionally, that pressure came from humans: a settlement window in banking, a booking rush in airlines, Black Friday in retail, a call spike in telecom, traffic that peaked on a schedule. Today, it comes from agents. An AI agent doesn't pause between requests the way a human does, and a single runaway agent, misconfigured or simply operating at machine speed, can generate the traffic of a product launch in minutes, with no ramp-up.
The gateway that can absorb that without buckling isn't just handling peak season anymore. It's ready for a world where the busiest moment can start at any second, triggered by one process instead of a million customers.
The WSO2 API Platform Gateway gives enterprises full control over their APIs, security, governance, traffic management, and observability, at the scale a modern digital business runs at, including the bursty, unscheduled load of autonomous AI agents. To put a number on that scale, we benchmarked a single gateway instance to find out how much load it can carry, and how much of that enterprise-grade security and governance it can enforce along the way.
The headline number: a single WSO2 API Platform Gateway instance, running on a modest 16-core allocation, sustained 82,809 requests per second with an 8-route API and zero errors. Held for 24 hours, that's 7.15 billion API calls a day, from one gateway.
Inside the Gateway: Controller and Runtime
The WSO2 API Platform Gateway is built around two main components:
- Gateway Controller: the control plane. It manages API configurations and pushes them to the Gateway Runtime via the xDS protocol, without restarting traffic.
- Gateway Runtime: the data plane that processes API traffic, built on Envoy Proxy.
The Gateway Runtime itself has three sub-components: a Router (Envoy Proxy) that handles traffic routing, load balancing, and TLS termination; a Policy Engine that executes request/response policies, with built-in policies written in Go or Python and compiled into its binary; and a Python Executor, a separate runtime for Python-based policies aimed at AI/ML and data-transformation use cases. When a request arrives, the Router forwards it to the Policy Engine for evaluation, then routes it to the backend.
Test Methodology
The performance of the WSO2 API Platform Gateway was evaluated using an API that invokes a simple Netty HTTP echo service, as the name suggests, the service echoes back any request it receives. For this benchmark, the API was configured with eight routes that forward requests directly to the backend service through the gateway, with no policies applied.The performance tests were conducted with 1,000 concurrent users.
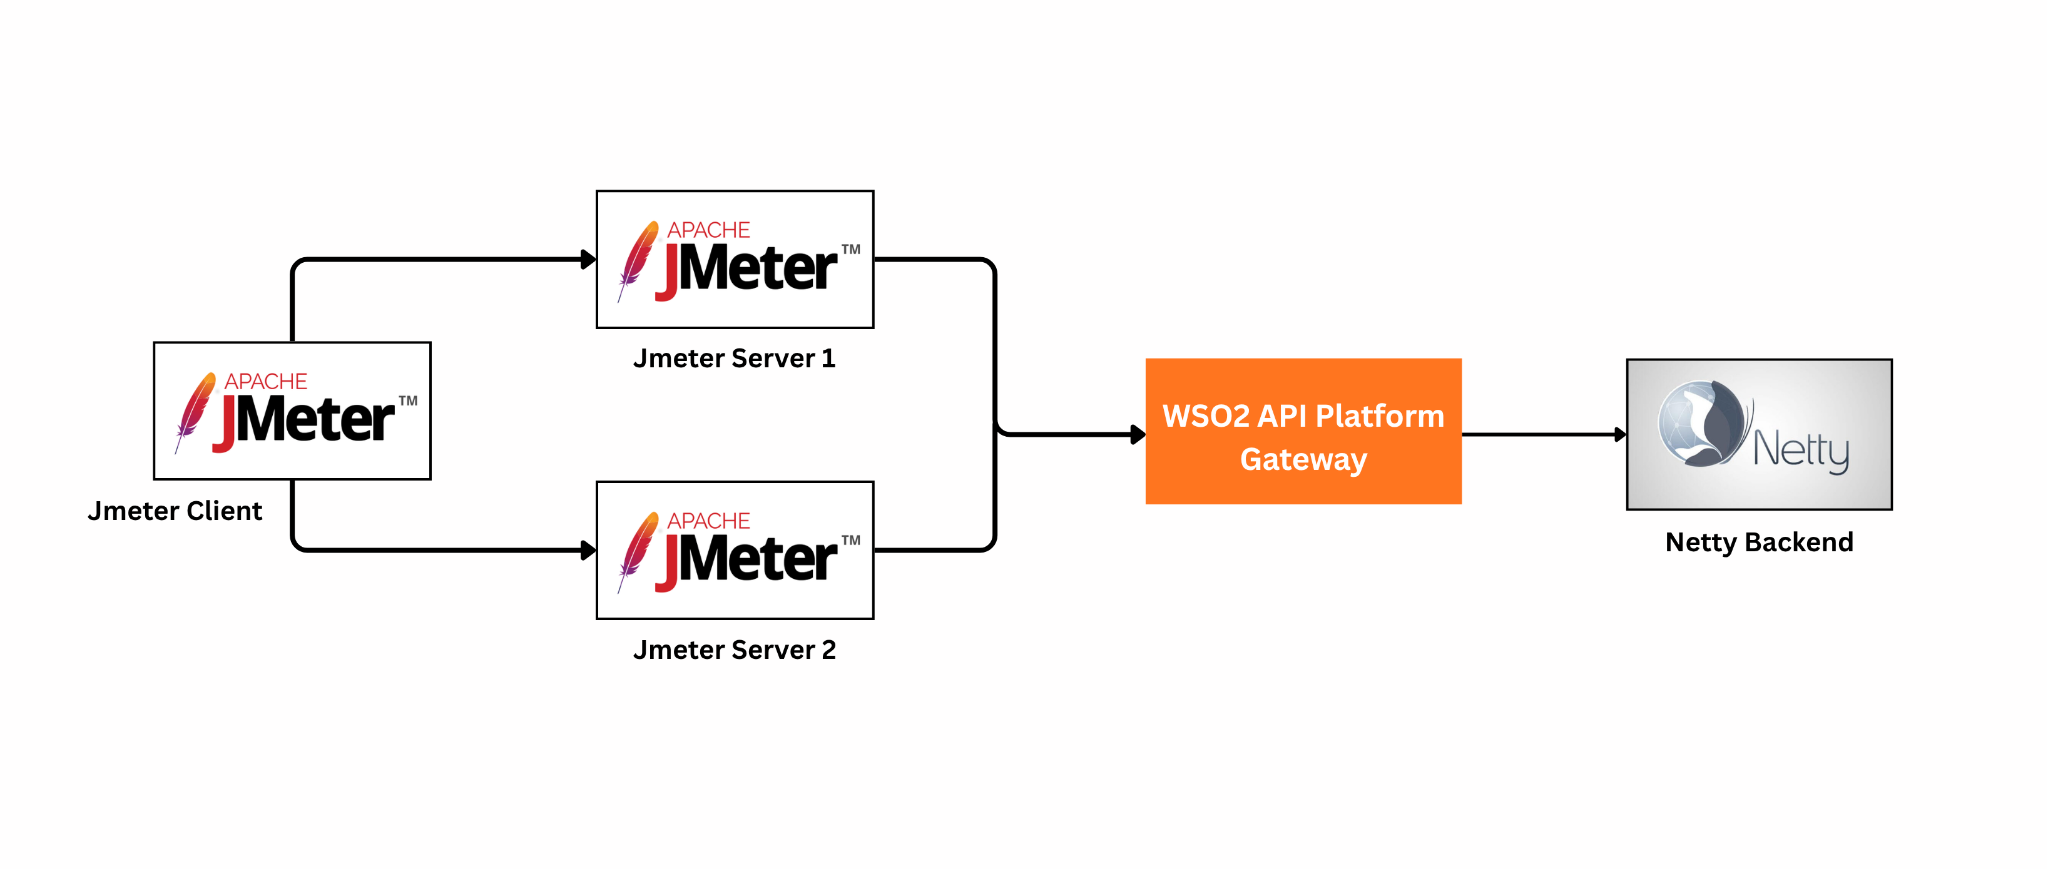
Apache JMeter was used as the test client. Each test scenario was executed for 15 minutes, including a 3 minute warm-up period, with performance metrics calculated after excluding the warm-up period from the analysis.
Two metrics were used to evaluate gateway performance: throughput: the number of API requests processed by the gateway per second, and response time: the end-to-end time taken to process a request, including the 90th, 95th, 98th, and 99th percentile response times.
Deployment Used for the Test
The diagram below shows the deployment architecture used for this.
| Component | EC2 Instance Type | vCPU | Memory (GiB) |
|---|---|---|---|
| Apache JMeter client | c5.2xlarge | 8 | 16 |
| Apache JMeter servers | c5.2xlarge | 8 | 16 |
| Netty HTTP backend | c5.2xlarge | 8 | 16 |
| WSO2 API Platform Gateway | c5.4xlarge | 16 | 32 |
- Operating system: Amazon Linux 2023.11.
- Java runtime: Temurin JDK 21.
For the results in this article, the Gateway Runtime was allocated the full 16 vCPUs available on the gateway host, with Router Concurrency swept across 8, 12, and 16 to isolate its effect, and the Gateway Controller pinned separately at 1 vCPU / 2 GB throughout. Tests ran at 1,000 concurrent users, and every scenario completed with a 0% error rate.
Without the Policy Engine: Near-Linear Scaling
With no policies attached, a pure pass-through proxy, throughput scales almost linearly with Router Concurrency, and latency drops in step:
| API | Router Concurrency | Throughput (req/sec) | Avg Latency (ms) | 99th Percentile (ms) |
|---|---|---|---|---|
| 8 routes | 8 | 63,369 | 15.53 | 26 |
| 8 routes | 12 | 73,628 | 13.34 | 25 |
| 8 routes | 16 | 82,809 | 11.80 | 22 |
| 1 routes | 16 | 85,410 | 11.35 | 20 |
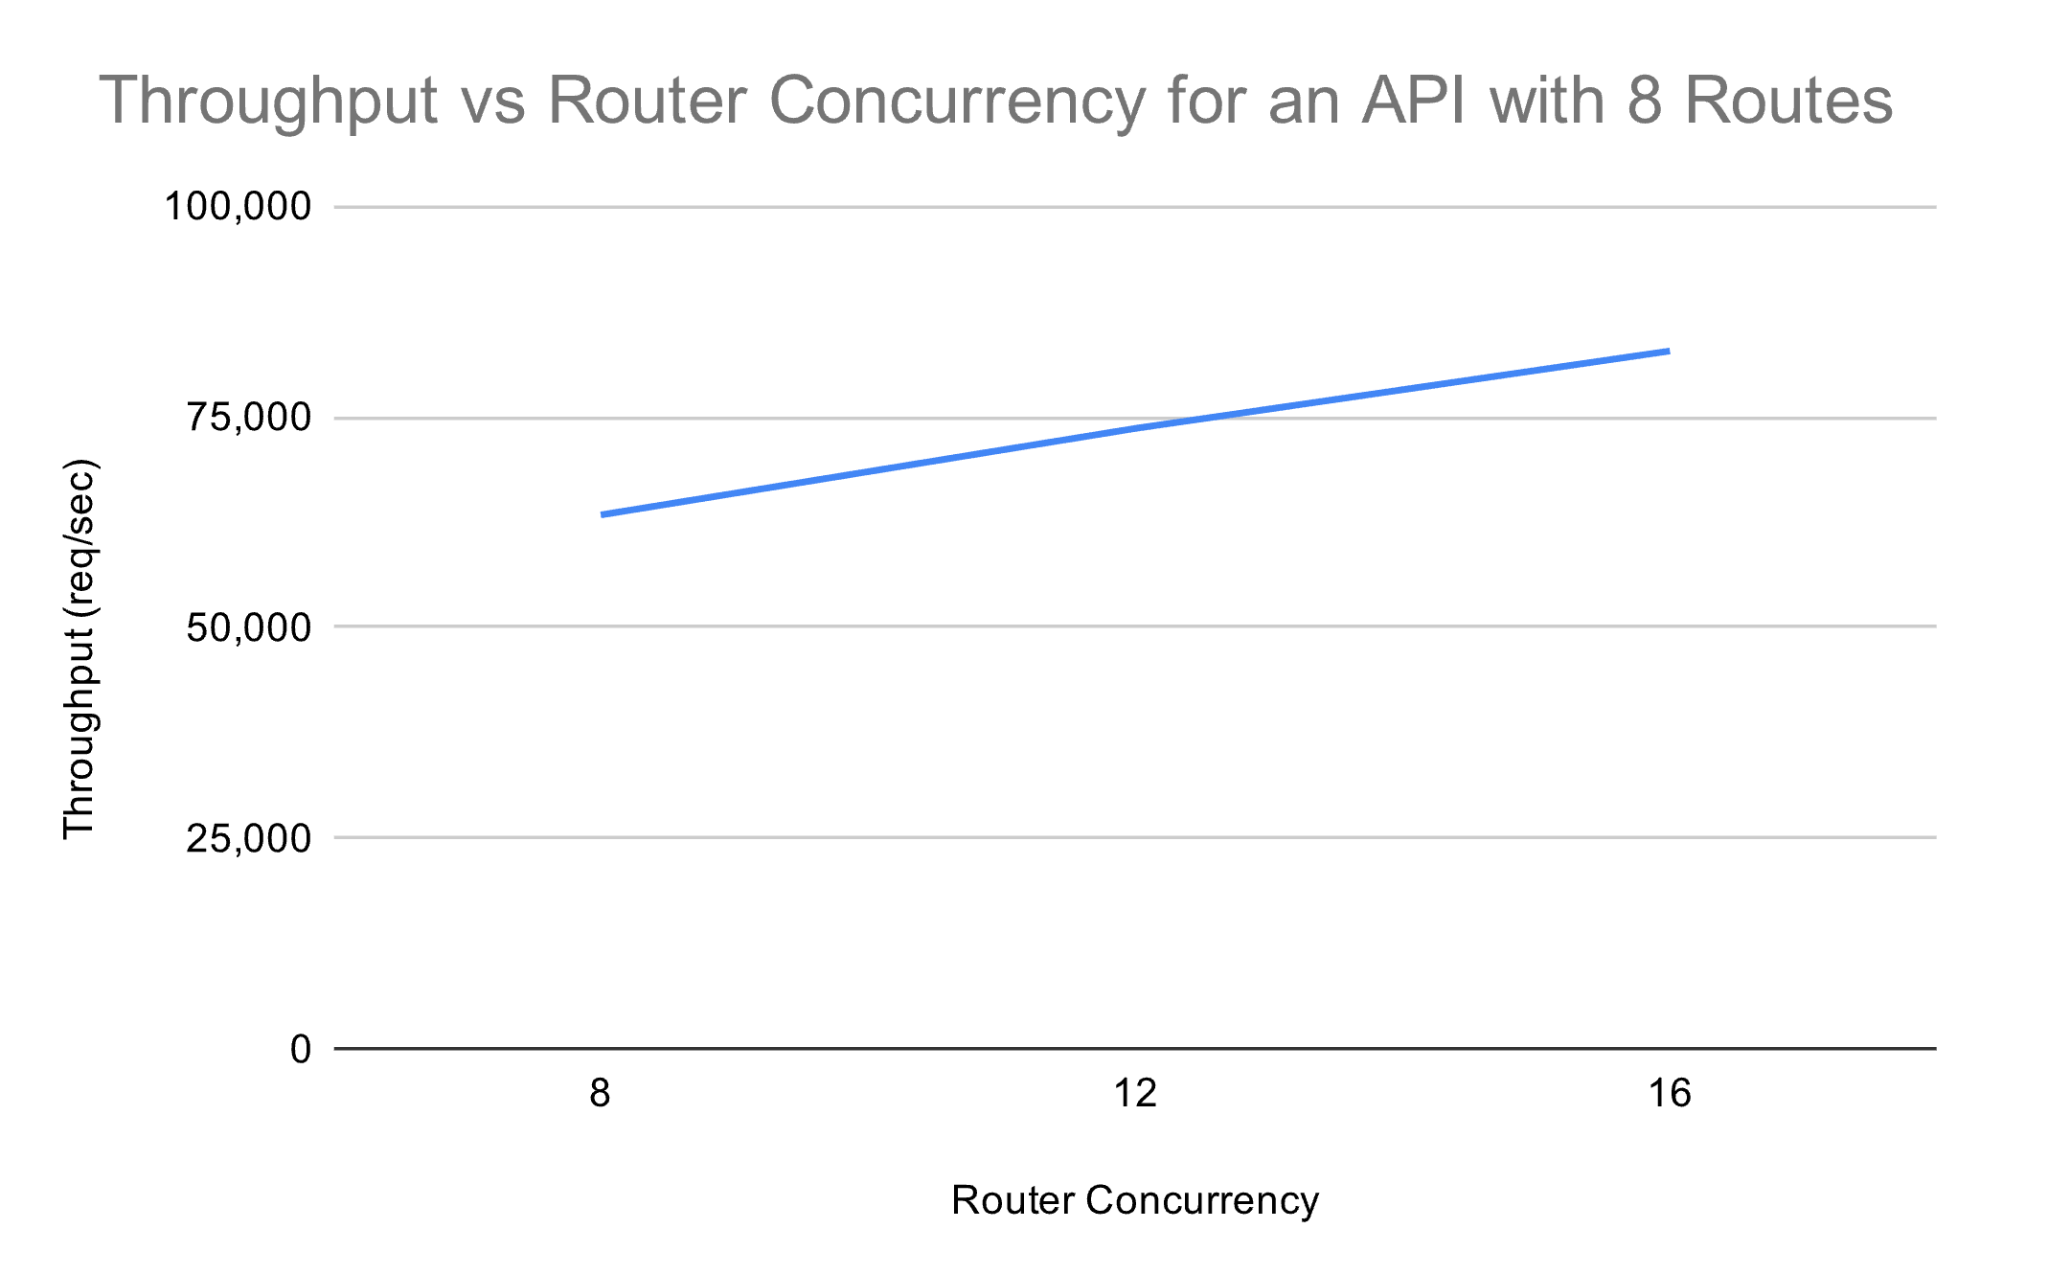
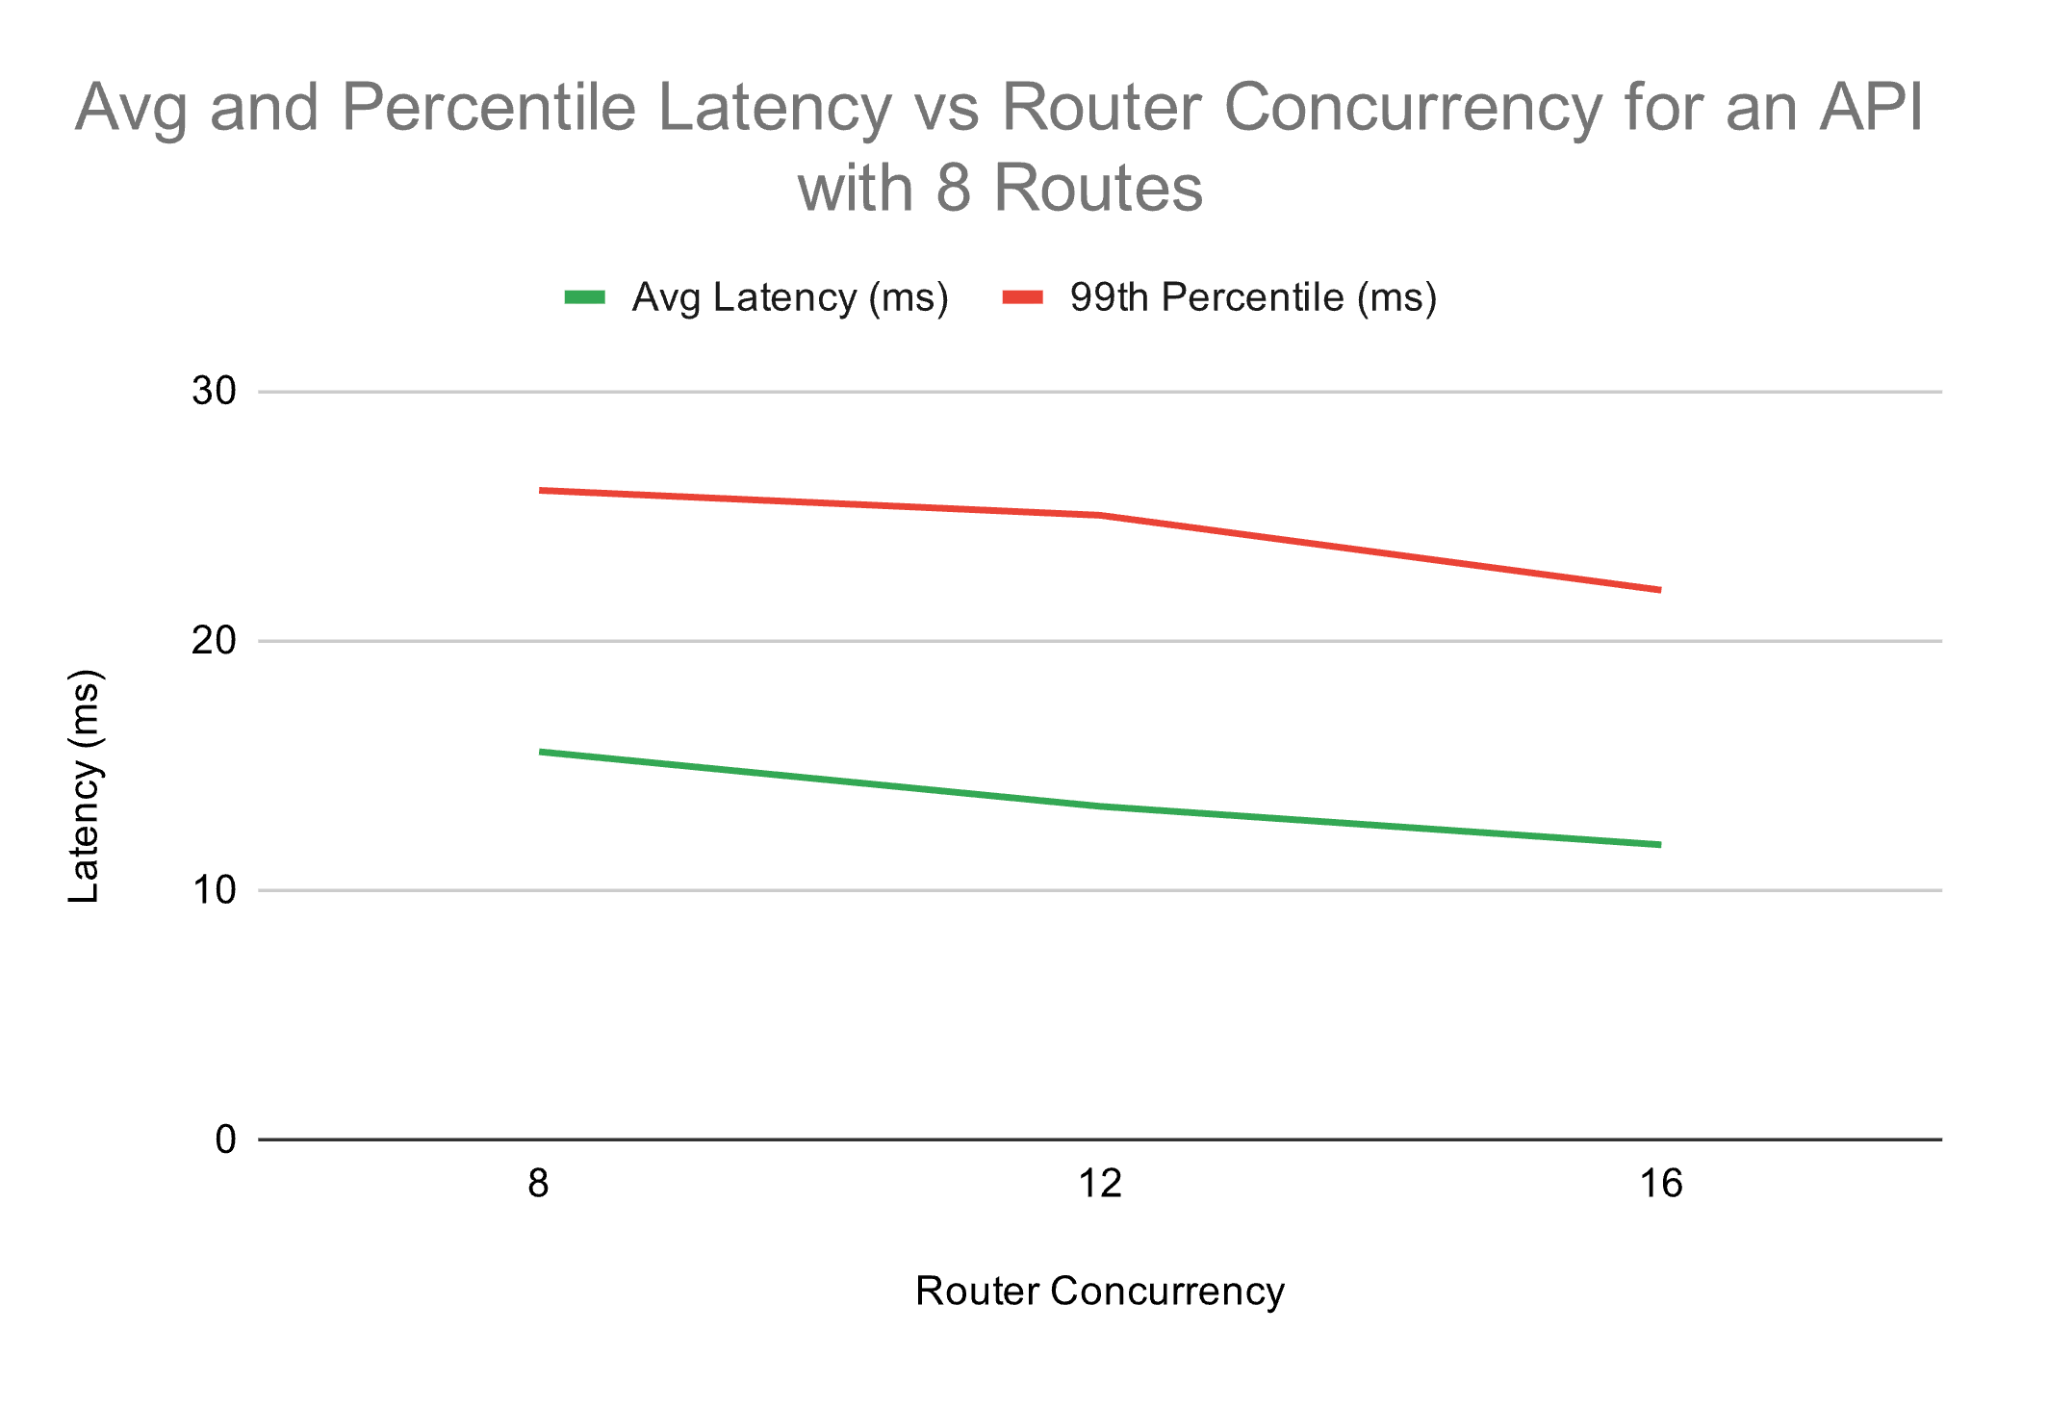
Going from a Router Concurrency of 8 to 16 lifts throughput by 31% and cuts average latency by 24%, a meaningful performance gain that costs nothing beyond a CPU allocation change.
Key observations:
- Throughput scales with Router Concurrency, and the gateway sustains that gain cleanly at 1,000 concurrent users with a 0% error rate.
- Average and 99th-percentile response times both fall as concurrency rises.
- A single-route API (85,410 req/sec) and an 8-route API (82,809 req/sec) perform within 3% of each other at the same concurrency, confirming route count isn't the limiting factor for raw throughput.
With Policies Enabled: What Changes
The numbers above describe the gateway with no policies attached, a pure pass-through proxy. Once policies such as authentication, rate limiting, or mediation are added to the request path, both throughput and latency shift, and by how much depends entirely on which policy is applied and how many are chained together: a lightweight policy like header manipulation adds relatively little, while heavier operations such as JWT signature verification or rate-limit checks carry more overhead. This is a trade-off platform teams can plan around and tune deliberately, rather than a fixed cost that applies the same way regardless of what an API needs enforced.
Explore the policy hub to view various available policies.
Scaling Past a Single Node
Every number above comes from one gateway instance, as this benchmark measures single-node capacity, not multi-node scaling. The Gateway Runtime is designed to scale horizontally: because each instance processes requests independently, adding runtime instances behind a load balancer should increase total capacity in proportion to fleet size.
Control over Performance - On Your Terms
- To increase TPS: increase Router capacity. Raising Router Concurrency, and the CPU allocated to the Gateway Runtime alongside it, took throughput from 63,369 to 82,809 req/sec in our tests, a 31% gain.
- To fine-tune latency: choose policies to match the use case. Lightweight policies stay closer to raw Router performance, while stronger security guarantees like JWT verification carry proportionally more cost, a trade a platform team can make deliberately, API by API, since WSO2's policy framework supports attaching different policies at the individual API or operation level rather than only uniformly across a deployment.
The Bottom Line
A single, modestly-sized WSO2 API Platform Gateway node carries north of 7 billion API calls a day, and continues to perform reliably, a 0% error rate at 1,000 concurrent users. That combination of measured single-node throughput, enterprise-grade policy enforcement, independent resource control, and an architecture designed for horizontal scale-out is what positions the WSO2 API Platform Gateway to scale with the business, in banking, airlines, retail, and telecom alike, rather than becoming its bottleneck.