API Analytics: The Metrics That Actually Matter (2026 Guide)
API analytics is the practice of collecting and interpreting data about how APIs are used and how they perform. It spans technical health (uptime, latency, and errors) and business value (adoption, revenue, and engagement). Most guides to API analytics pick one side of that line and stay there. They either drown you in dashboards full of latency charts or wave vaguely at "business value" without saying which number to look at. This piece keeps the two separate on purpose and organizes them by the team that owns each metric. It also adds a category that most existing frameworks predate: AI and agent traffic.
The distinction matters more than it sounds like it should. Engineering and product teams both have a stake in latency and in revenue, but they act on that information differently. An engineering team's primary lever is fixing what's slow or failing, while a product team's primary lever is deciding what to build, price, or prioritize. Metrics only earn their place on a dashboard when someone can turn what they find into a decision, which is the organizing idea behind everything that follows.
Technical and Operational Metrics: Is Your API Healthy?
These are the metrics every team should track, regardless of role, because they answer the most basic question a consumer can ask: does this API work right now?
Uptime and availability
Uptime is usually expressed as a percentage of successful time over a measurement window, and the difference between the percentages is larger than it looks. Assuming a 365-day year, 99% uptime allows roughly 3.65 days of downtime a year. At 99.9%, that shrinks to about 8.76 hours. At 99.99%, it drops to around 52.6 minutes. Each additional nine costs more engineering effort than the last, so the right target depends on what the API actually supports, not on what sounds impressive in a status report. A support tool that fails open to a cached response doesn't need the same target as a payments API.
Latency
Averages hide the experience that matters most. A p50 (median) latency of 40ms can sit next to a p99 of 4 seconds, and the average will still look fine. Track p50 for the typical request, p95 for the number you're willing to put in an SLO, and p99 for the requests that generate support tickets. Be precise about what each timer actually measures. Gateway and upstream latency help you find server-side delays. They cover request processing at the edge and time spent waiting on the backend. However, a gateway-side timer doesn't necessarily include DNS resolution, the client's own network path, connection setup, or client-side rendering. Use gateway and upstream latency to find server-side delays, and use client-side or synthetic measurements to assess the full end-to-end user journey.
Error rates
Split errors by who most likely caused them before you do anything else. 4xx errors are usually client-caused: malformed requests, expired tokens, or bad payloads. A server-side authorization or configuration change can also trigger a wave of 4xx responses that has nothing to do with the client. 5xx errors are usually server-caused: a dependency is down, your code throws an exception, or your database is saturated. Go one level deeper and the split gets more useful. A spike in 401s usually points to an expiring credential or a key rotation gone wrong. A spike in 429s usually means a rate limit is mismatched with real traffic, or a client is retrying too aggressively. Status codes also assume the protocol reports failure that way in the first place. GraphQL APIs commonly return HTTP 200 even when a resolver fails. The actual error sits inside the response body. A status-code-only view of error rate will miss those failures. Track errors in whatever field your protocol actually uses to report them, and treat "the error rate went up" as a starting point for investigation, not a diagnosis.
Throughput
Requests per second or minute tells you how much traffic the API is handling, but the trend matters more than the snapshot. Flat throughput while adoption is growing is worth investigating. It can mean a scaling limit is close. But caching, more efficient clients, or a shift in usage patterns can produce the same flat line without any capacity problem. Check it against concurrency, saturation, and error rate before concluding it's a scaling issue. Declining throughput with no matching drop in upstream traffic is also worth investigating immediately. It can point to a failing dependency or an attack in progress. Confirm it against error rates and queue depth before acting on the throughput number alone.
Adoption Metrics: Are Developers Actually Using Your API?
Operational health tells you the API works. Adoption metrics tell you whether anyone is building on it.
Unique API consumers: Count distinct applications or accounts calling the API in a given window, not raw request volume. A single high-traffic customer can make usage look healthy while everyone else has churned.
API usage growth: Measure this in rolling 28-day windows rather than calendar months. A 28-day window removes the bias that comes from weekday-versus-weekend traffic patterns and from the fact that February has fewer days than January. Comparing raw calendar months can make a perfectly stable API look like it's shrinking. A 28-day window still doesn't control for holidays, seasonal demand, or a marketing campaign that lands in one window and not the other. Pair it with a longer trend line before concluding that growth has changed.
Time to First Call: This is the time between a developer getting credentials and making their first successful request. It's arguably the single most useful developer-experience metric an API team can track, because it's a downstream signal for docs quality, onboarding friction, and API design all at once. A long Time to First Call rarely has one cause. It's usually a combination of unclear docs, a confusing auth flow, and an SDK that doesn't match the API's actual behavior.
Business and Product Metrics: What Value Are Your APIs Creating?
This is where the technical and business split this piece opened with becomes concrete. These metrics answer a different question than the ones above, not "does it work," but "is it worth what it costs to run."
Revenue attribution
Some APIs generate revenue directly, through usage-based billing or paid tiers. Others generate it indirectly, by powering a feature that drives retention or upsell. Both are worth tracking, but they need different measurement approaches. Direct revenue is a straightforward query against billing data. Indirect revenue usually requires product analytics to connect API usage to the business outcome it supports.
Applications per API
How many distinct applications build on a given API is a useful signal worth investigating, not a direct measure of design quality on its own. A well-designed, genuinely useful API tends to get reused across more projects, but so does a poorly designed one that happens to be the only option available, or one a team is required to use. Pair this number with developer feedback or support-ticket volume before drawing a conclusion about design.
Top consumers by usage
In most API programs, a small number of accounts drive a disproportionate share of total usage and revenue. That's worth breaking out by endpoint, not just in aggregate, because it tells you which specific capabilities your highest-value customers actually depend on. The same breakdown can also surface endpoints with little or no recent traffic, but low usage in one observation window isn't proof that nothing depends on them. Quarterly batch jobs, disaster-recovery integrations, and partners who are temporarily inactive can all look identical to a dead endpoint on a dashboard. Before retiring anything, confirm the observation window is long enough. Check with the API's owner and known consumers. Give notice, and keep a rollback or exception path. A quiet dashboard is not proof that nothing depends on an endpoint.
If your API program has grown past a handful of teams, a related but distinct set of metrics is worth a mention: catalog governance. Examples include coverage against your organization's capability model, the count of APIs nobody has called in months, and duplicate APIs that solve the same problem. These are a different measurement problem. They are closer to portfolio management than performance monitoring. Worth tracking separately once you're operating at that scale, but outside the scope of this piece.
The New Category: AI and Agent-Era API Metrics
Most existing API metrics frameworks don't have a category for this, because they were written before AI and agent traffic reached meaningful production scale for most teams. AI and agent traffic behaves differently enough from conventional API traffic that it deserves its own tracking, not a footnote inside "latency" and "errors."
Token usage
Track total, prompt, and completion tokens, broken down by vendor and model. Watch for a model or endpoint that consumes far more completion tokens than usual. That often signals an inefficient prompt, a runaway retry loop, or an agent stuck in a reasoning cycle it can't exit. Product teams can use the same data the other way around, correlating token consumption with usage tiers or customer segments to understand where AI costs are actually going.
Vendor-specific latency and error analysis
A model provider degrading is a different failure mode than a typical backend dependency failing, because you often can't fix it by scaling your own infrastructure. Track latency and errors separately by vendor, provider, and model version. Then you can tell "our API is slow" apart from "our AI vendor is having a bad day." That changes what your team can actually do about it.
Why this category is new
Token-based pricing, multi-model routing, and agents that make their own follow-up calls are recent. Most "API metrics" writing predates them. This category stops being optional for teams that route between models or providers, attribute AI spend to a product line, or run LLM traffic in production at meaningful scale. There isn't a clean volume threshold where that switch flips. It's driven by architecture and by whether finance is already asking questions your dashboards can't answer.
Which Metrics Matter to Which Team?
Two independently published frameworks converge on roughly the same answer from different directions. F5/NGINX's model organizes metrics into a pyramid. Operational metrics sit at the base. Adoption metrics sit in the middle and connect technical work to business outcomes. Product metrics sit at the top. Moesif's framework splits ownership by team instead: infrastructure, application engineering, product, and business and growth. Moesif has been a WSO2 subsidiary since May 2025. Its framework is included here because it is a useful, independently developed model. It is not outside validation of the WSO2 section later in this piece. Put together, the two frameworks map cleanly onto a single table.
| Team | Primary metrics | Why |
|---|---|---|
| Infrastructure / SRE | Uptime, latency (p95/p99), error rate | Owns whether the API is up and fast |
| Application engineering | Latency by route, errors by type and status code | Owns fixing the specific cause |
| Product | Adoption, unique consumers, Time to First Call | Owns whether developers succeed with the API |
| Business / growth | Revenue attribution, top accounts, engagement | Owns whether the API is worth running |
| AI / platform | Token usage by vendor and model, vendor-specific latency | Owns cost and reliability of AI-backed endpoints |
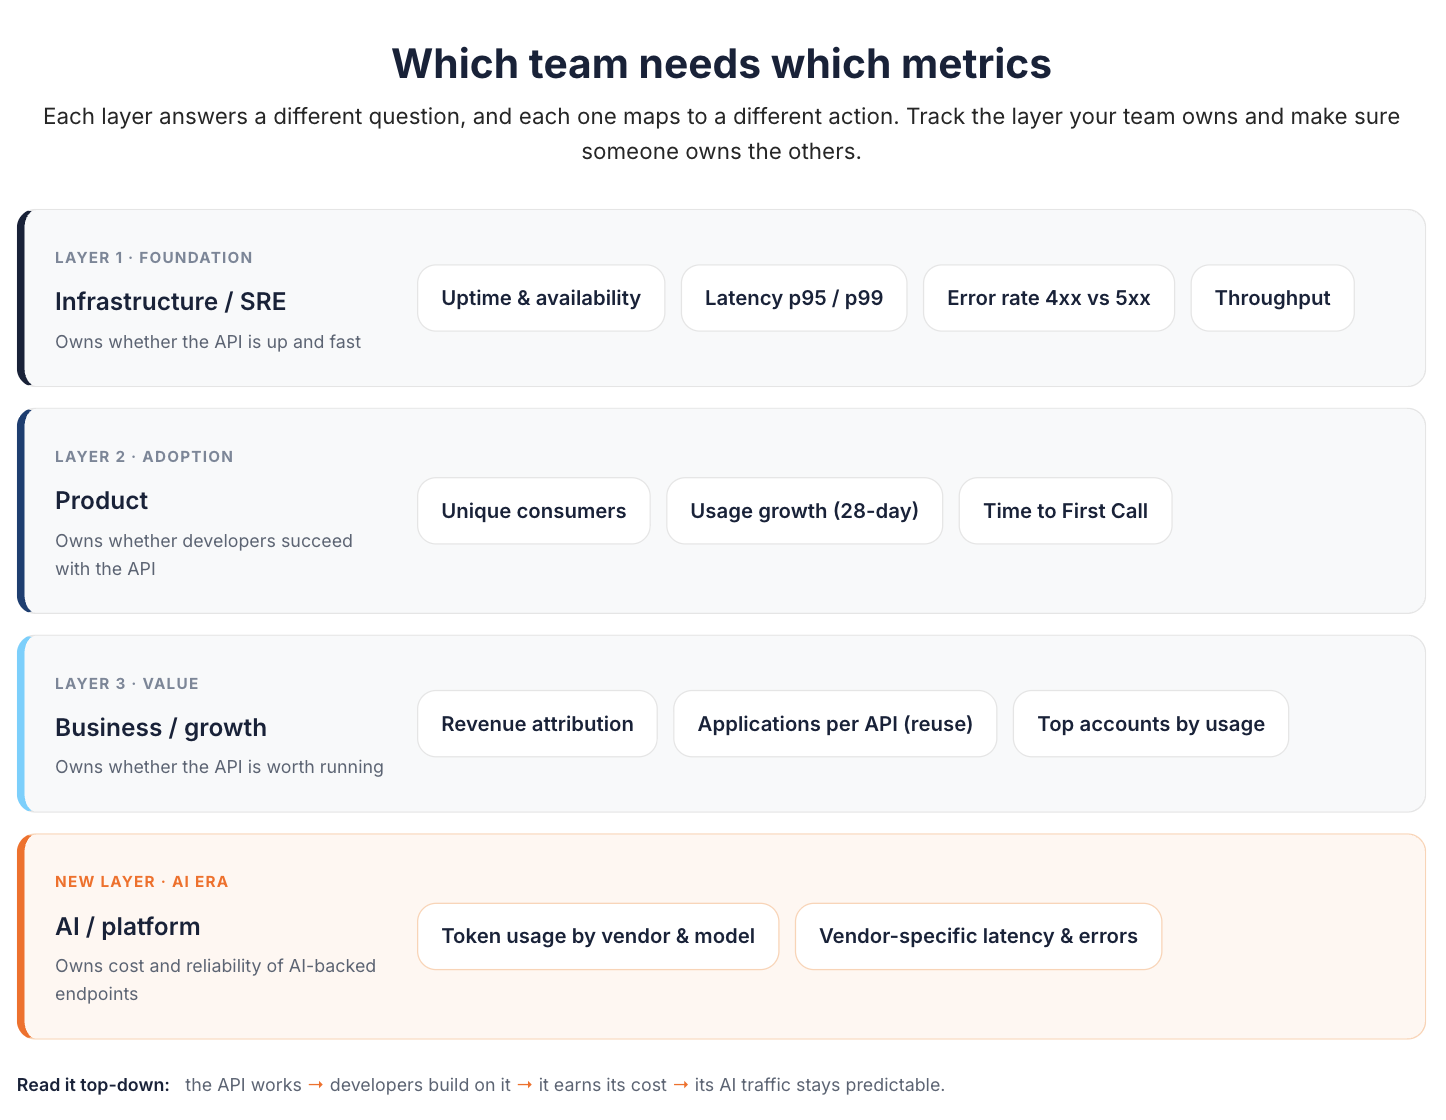
No dashboard shows all five rows to the same person by default, and it shouldn't. The point of separating metrics by team isn't organizational tidiness. It's that each row maps to a different action, and putting all of them in front of everyone just produces a dashboard nobody checks.
Own Your Data or Rent a Dashboard?
Most API teams eventually face this choice, and there isn't a universally correct answer. Built-in analytics from your gateway or API platform is the fastest path to value. There's no infrastructure to stand up, no schema to design, and the metrics above are usually available within minutes of enabling the feature.
Streaming your own telemetry, typically through OpenTelemetry to a data warehouse you control, avoids vendor lock-in and lets you correlate API data directly with billing, CRM, or product analytics you already own. The tradeoff is that you now own the collector, the storage, and the cardinality management that comes with high-volume API data, which is real ongoing work. High-cardinality fields like raw customer IDs or unbounded URL paths multiply the unique time series your storage has to index. A schema that isn't planned around that tends to get expensive or slow before anyone notices why. The fix isn't to drop those fields. It's to keep them out of metric labels. Use route templates (like /users/{id} instead of the literal path) and a bounded set of dimensions in your metrics. Then push the raw, high-cardinality detail into access-controlled logs and traces. You can still look it up during an investigation without paying for it on every dashboard query.
In practice, most mature API programs end up doing some version of both. They use built-in analytics for the metrics teams check daily. They keep a streamed copy of the same data for questions that come up when finance, product, and engineering work on something together. Which one to start with usually comes down to timing rather than principle. Teams standing up a new API program get more value from built-in analytics on day one than from a warehouse pipeline nobody has time to build yet. Teams that already have a data warehouse and a habit of joining operational data with product data tend to add the API stream to what they have rather than starting from a vendor dashboard.
How WSO2's API Platform Approaches API Analytics
The frameworks above are useful on their own, but it helps to see how they show up in a shipped product. The WSO2 API Platform uses one control plane for API design, publishing, governance, and monitoring across gateways. Its analytics are powered by Moesif. Moesif Basic is included at no additional cost with a WSO2 subscription. It works in API Platform Cloud and with self-hosted API Platform gateways. The dashboards are split by traffic type. There are separate views for APIs, LLM proxies, and MCP servers, plus an overview that shows the traffic breakdown across all three.
That split matters for the AI metrics category above. The LLM analytics view tracks token usage (prompt and completion), estimated cost, traffic share by provider and model, latency trends, and guardrail triggers. That is the provider- and model-level breakdown this piece recommends, rather than a generic "AI traffic" bucket. The API analytics view reports total requests, average latency, error rate, unique consumers, and an error-type breakdown. The MCP view tracks tool calls, sessions, and tool execution errors.
Alerting is threshold-based. You choose an API, a metric, a threshold, and an email address to notify. For example, you can alert on too many 400 errors or on 90th percentile latency above a set value. Each team can own the alert rules for its own metrics, which fits the ownership table above. The alert history is kept, so you can track incident patterns over time.
None of this solves a problem competitors haven't described. What's specific here is that analytics ship as part of the platform, not as a separate stack bolted on later. That matters more as API programs grow to hundreds of APIs across teams. Postman's 2025 State of the API Report found that about 65% of organizations generate revenue from their APIs. These metrics exist to make that kind of business outcome visible, not just the operational ones.
Conclusion
Don't pick metrics because a dashboard happens to show them by default. Pick the ones your team can act on, and know which ones belong to engineering and which ones belong to the business before you build the dashboard, not after.
Operational metrics tell you the API works. Adoption metrics tell you developers are building on it. Business metrics tell you it's worth running. AI and agent metrics are the newest addition, and for teams running meaningful LLM traffic in production, they're no longer optional. Track the row your team owns, and make sure someone owns each of the others.
Frequently Asked Questions
What is API analytics?
API analytics is the practice of collecting and interpreting data about how an API performs and how it's used, covering both technical health metrics like latency and errors and business metrics like adoption and revenue.
What are common API monitoring metrics?
The most common are uptime, latency (measured at p50, p95, and p99, not just the average), error rate split between client-caused and server-caused failures, and throughput.
How can API analytics inform product decisions?
By connecting technical signals, like which endpoints are called most and by whom, to business outcomes like revenue and retention, so product teams can prioritize the APIs and features that create the most measurable value.