Agent Observability: Tracing Agents from LLM to Tool Calls
A customer asks your support agent to refund one order, and the agent refunds a different one. Every HTTP call returned 200, latency stayed normal, and token spend looked like any other day. Nothing in your dashboards says anything went wrong.
That is the gap agent observability fills. Uptime and latency tell you the system responded. They do not tell you whether the agent picked the right order, called the right tool, or carried the right context into the next step. To answer those questions, you need a record of what the agent observably did at each step. That means the model requests, tool calls, state changes and decision metadata your application can see.
This guide covers what to observe in an AI agent and how to connect agent, LLM and tool-call spans into one trace. It then looks at the metrics to track, how traces feed evaluation, and how to start without rebuilding your stack.
What Agent Observability Means (and Why Traditional APM Doesn't Cover It)
Agent observability is the practice of capturing structured traces of an AI agent's observable steps, such as planning, LLM calls, tool calls and state changes. The goal is to judge whether the agent did the right thing in the right way. Traditional monitoring asks whether a service is up. Agent observability asks whether the agent behaved correctly.
Traditional APM was built for code paths you wrote. A request hits a route, the route calls a database, and you measure each hop. With AI agents, the model chooses the path at runtime. It decides which tool to call, with which arguments, and whether to loop or stop. Two identical requests can take different execution paths. Both can succeed at the transport layer while only one gives the correct result.
That is why agent behavior needs its own signals. You still want latency and error rates. You also need the decision record behind them.
Agent observability is also distinct from observability at the traffic and cost layer. Gateway telemetry tells you token usage, cost and latency per provider across all your model traffic. Agent telemetry tells you what one agent did inside one task. Production teams usually need both, and they connect through OpenTelemetry.
What to Actually Observe in an Agent
A useful way to scope agent observability is to ask four questions about every agent run. Each one maps to data you need to capture.
Did the agent complete the task? This is task completion, judged against what the user asked for. In the refund example, "refund issued" is not enough. The question is whether the correct order was refunded. Capture the original request and the final outcome on the same trace so the two can be compared later.
Did it follow an acceptable execution path? An agent can reach the right answer by an unacceptable route. It might call a write tool before confirming the order, or retry a search several times. Capture the order of steps, not just the result.
Were its tool calls correct? Tool selection is where many production failures start. The agent may call the wrong tool, pass a malformed argument, or misread a tool's output. Record the tool name, a call ID, the outcome and (where policy allows) the arguments for every tool call.
Did it use the right context and state? Agents depend on conversation history, retrieved documents and memory. If the agent loaded the wrong customer record into context, every later step can be internally consistent and still wrong. Capture what was retrieved and what state the agent carried between steps.
Each question points at a different part of the run. The next section shows how one trace holds all four.
Tracing Across Agent → LLM → Tool Calls
A trace is the record of one agent run, made of spans that share a trace context. Each span is one timed operation, and every span except the root references a parent. A trace can still be incomplete if spans are sampled out, dropped during export or never instrumented. The parent-child structure is what turns a flat log into an execution path you can read.
The OpenTelemetry GenAI semantic conventions define span types for this. As of October 2026 they sit in a dedicated OpenTelemetry repository and are still in Development status, so names can change. Pin your instrumentation library versions so attribute names do not shift between releases. They are still the closest thing to a shared vocabulary for agent tracing.
Here is how the refund request decomposes into a trace:
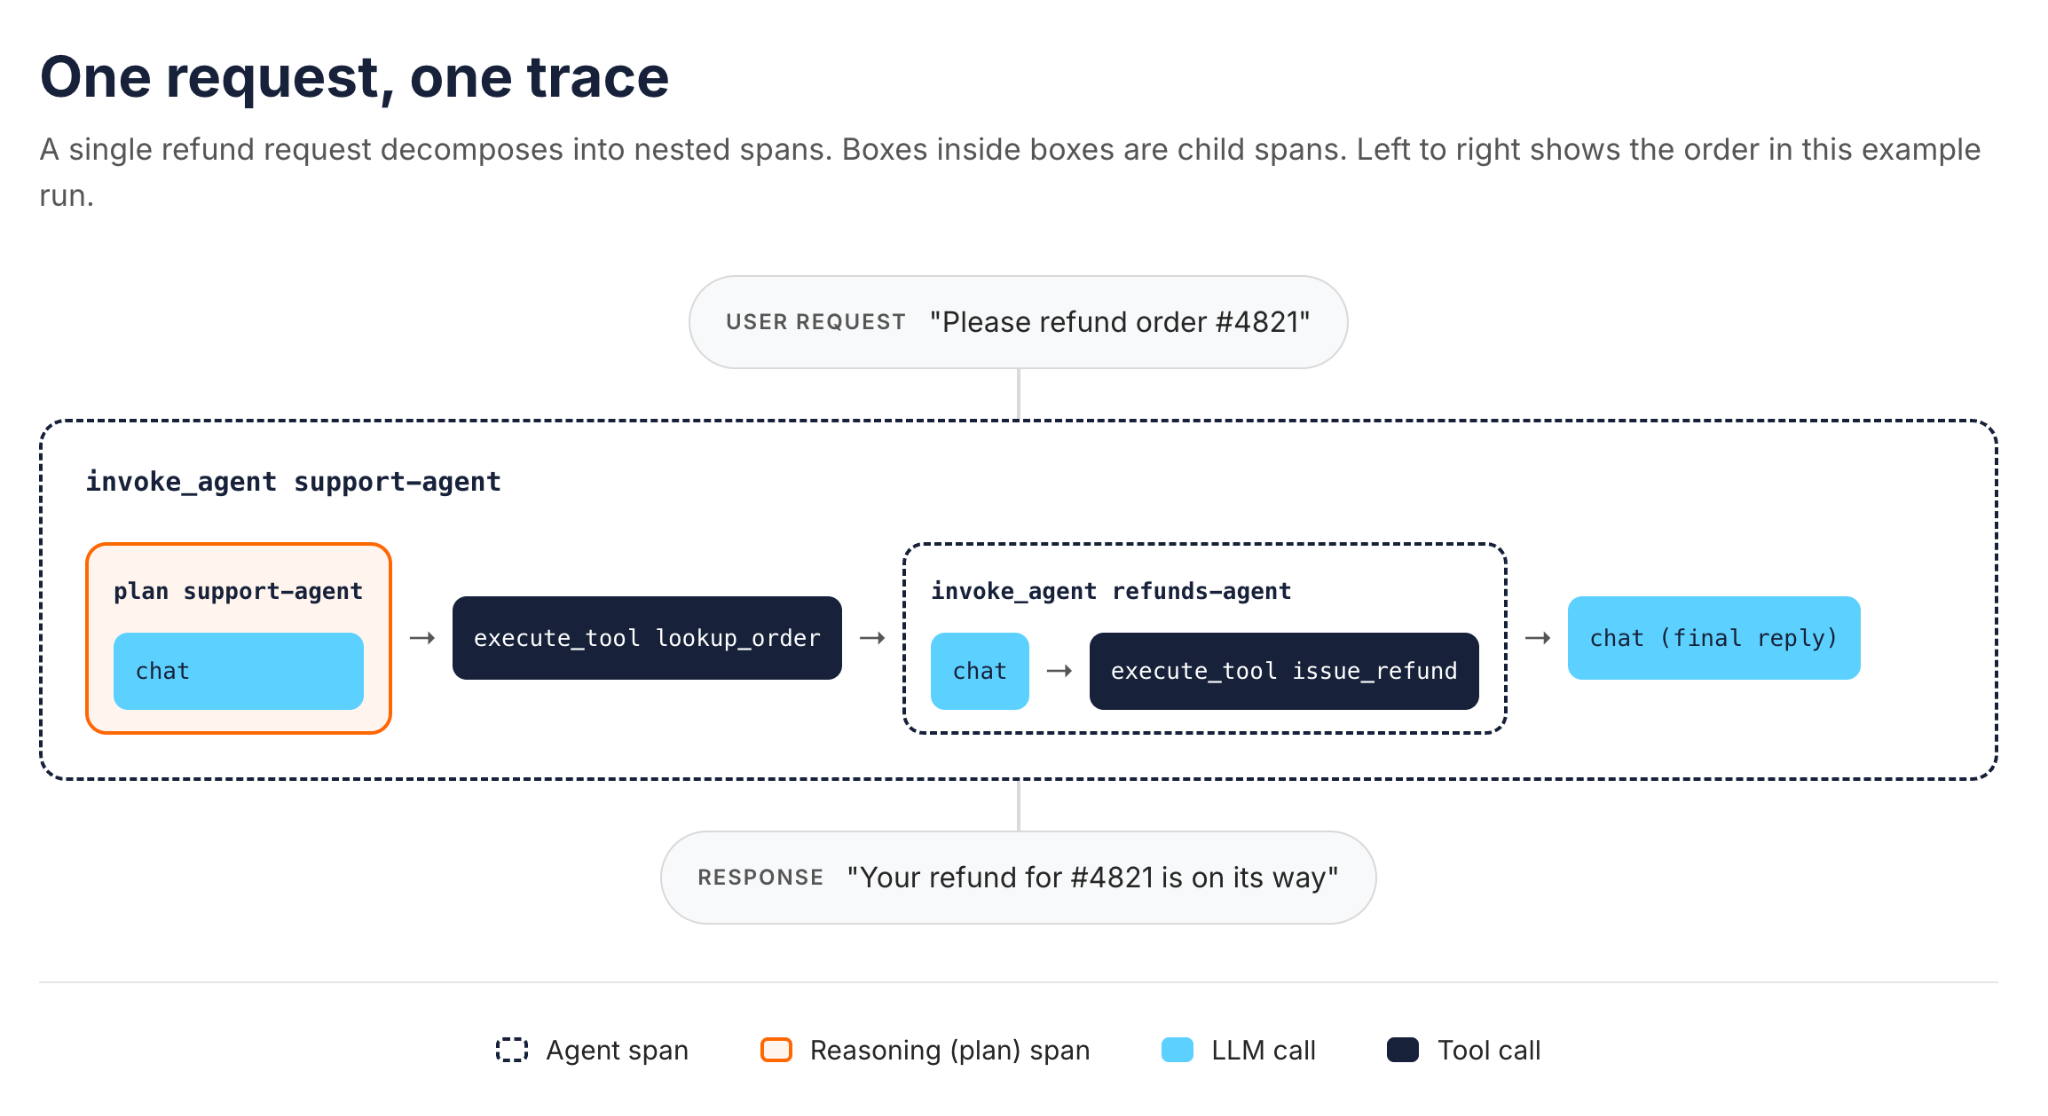
A single refund request decomposes into nested spans. Boxes inside boxes are child spans, and left to right shows the order in this example run.
invoke_agent support-agentis the root span for the agent run.plan support-agentrecords the planning step. The LLM call that produces the plan sits under it as a child span.execute_tool lookup_orderfetches the order. It is a sibling of the plan span under the root, not a child of it.invoke_agent refunds-agentis a sub-agent handoff. It nests as a child of the root, with its own LLM call and anexecute_tool issue_refundspan beneath it.chat(final reply) is the last LLM call, which writes the reply to the customer.
That layout follows the conventions directly. The plan span holds the LLM call that produced the plan, and the tool spans that carry it out are siblings under the agent span. In a multi-agent system, the handoff simply adds depth to the tree. The conventions use an internal invoke_agent span when the sub-agent runs in the same process. They use a client span when the agent is a remote service.
Session-level observability sits one level above. A support conversation spans many runs, and each run is its own trace. The gen_ai.conversation.id attribute ties those traces together into one session, so you can see how context built up across turns.
Crossing process boundaries depends on trace context propagation. When the agent calls a remote sub-agent, an MCP server or a gateway, it passes trace context in headers. That lets downstream spans join the same trace. Without it, you get several disconnected traces and correlate them by ID afterwards. WSO2's AI Gateway, for example, emits its own spans for policy execution and upstream calls, and its tracing docs describe header-based context propagation. The WSO2 section below covers how that gateway layer relates to the agent layer.
The Four Types of Spans Worth Capturing
"Log everything" is not a plan. A more practical start is four span types, which together cover the four questions above.
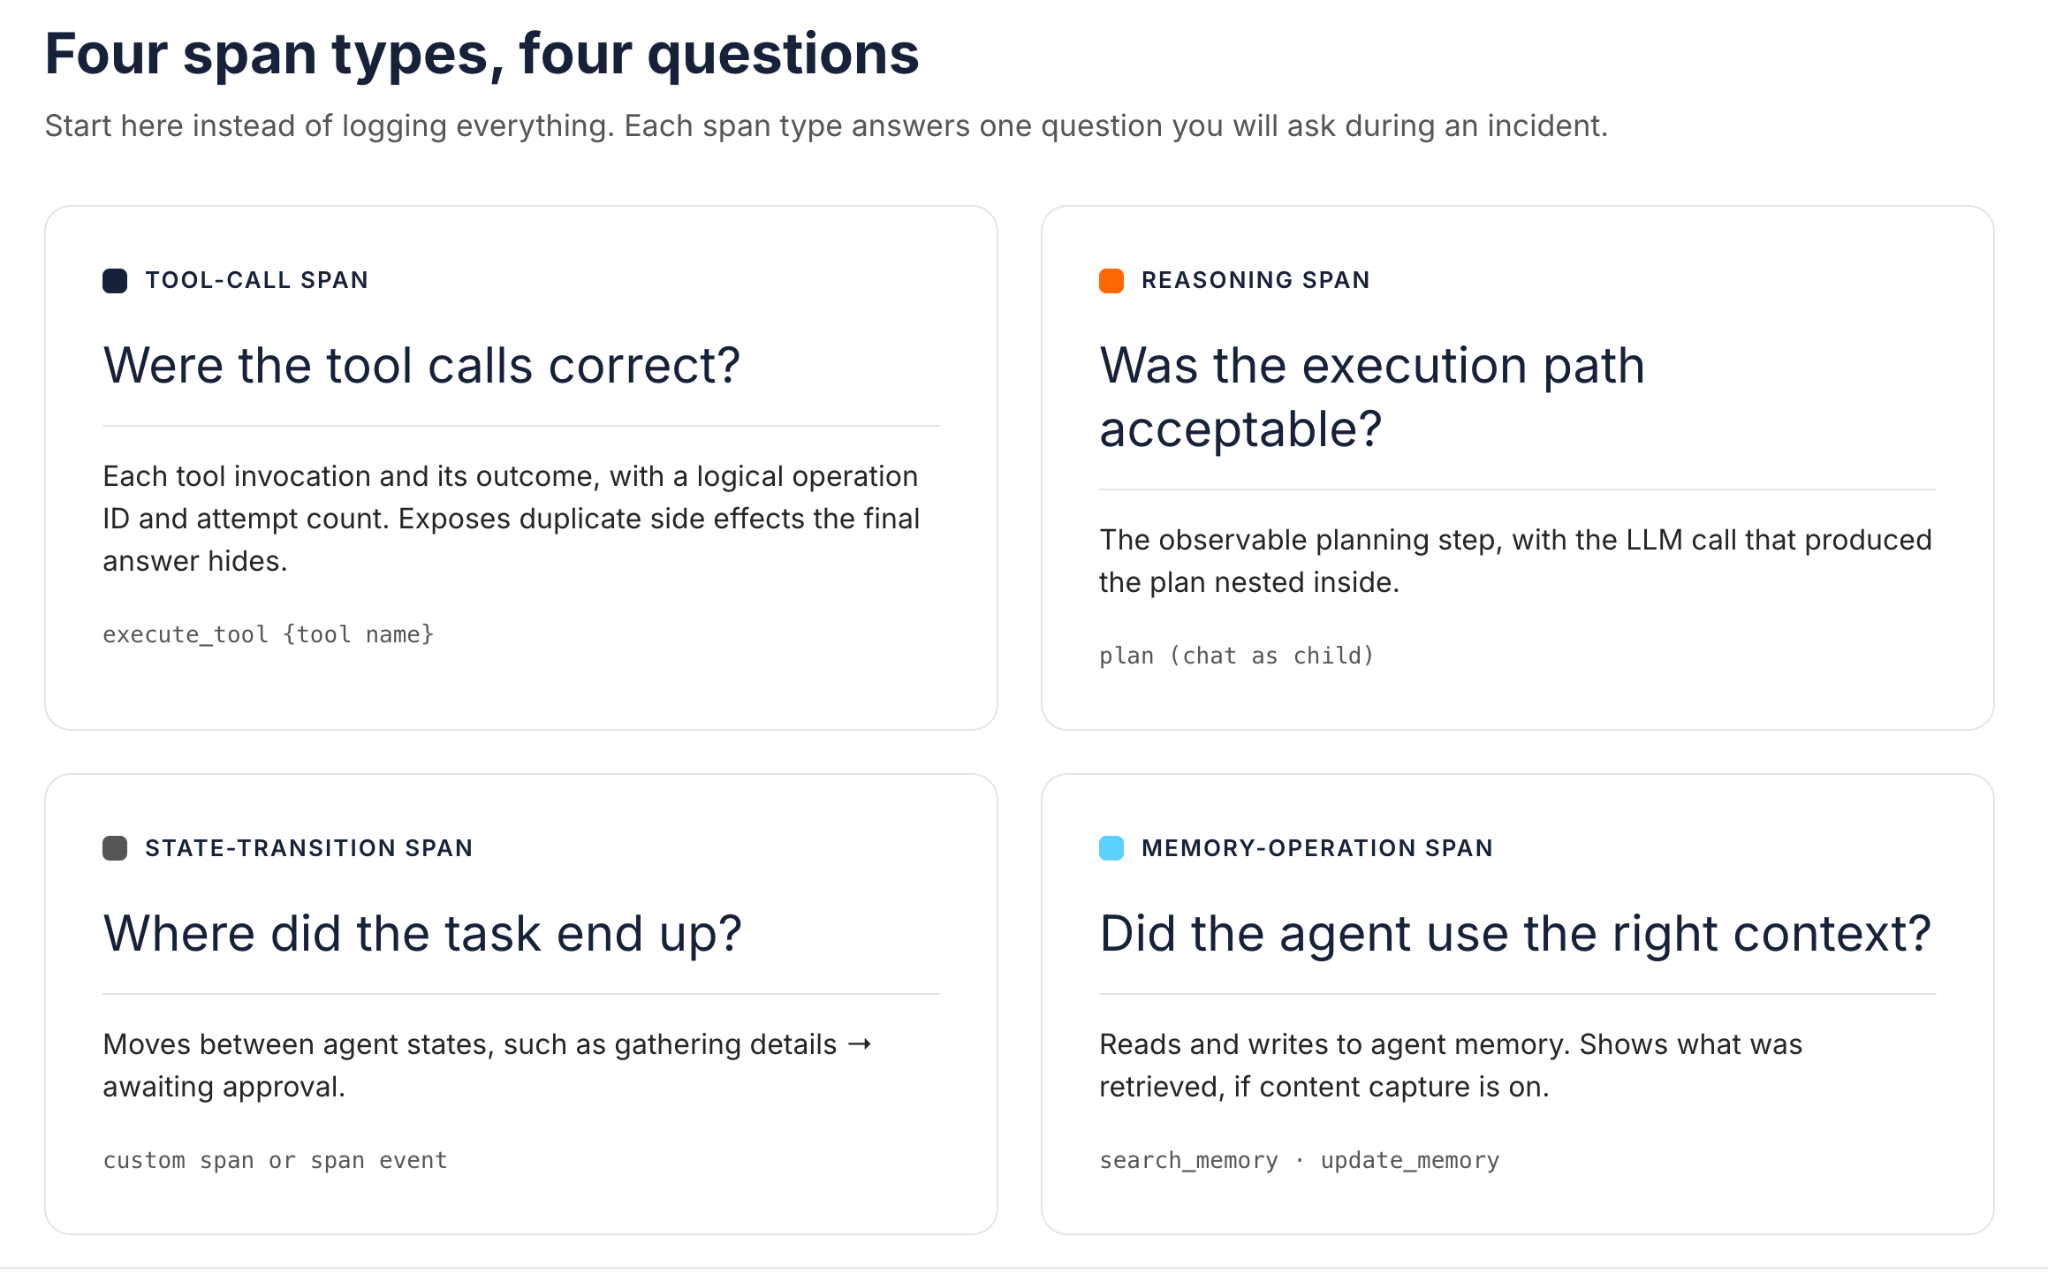
Start here instead of logging everything. Each span type answers one question you will ask during an incident.
Tool-call spans
Record each tool invocation. The OpenTelemetry convention is an execute_tool {tool name} span with the tool name required and a tool call ID recommended. Arguments and results are opt-in because they often contain customer data. To expose retries, give each logical operation a durable identifier and record an attempt count, with each attempt as its own span. A tool call ID alone is not enough, because a retried operation can get a new ID. Record a hash or safe reference to the idempotency key, not the key itself. Then correlate attempts with the outcome reported by the service that performs the side effect. That shows duplicate executions the final answer hides. That is one reason idempotency keys matter for agent tools.
Reasoning spans
Record the planning operations your application can observe. When a framework exposes an explicit planning step, it maps to a plan span with the LLM call nested inside. The conventions say to skip the plan span when instrumentation cannot tell planning apart from ordinary inference. In that case, the LLM span's input and output messages are the closest record. They show what the model received and returned, not its full internal reasoning. Some providers expose a reasoning summary, but it is a summary, not the complete internal process. Treat explanations drawn from these spans as inferences, and keep plans and summaries apart from confidential prompt or memory content.
State-transition spans
Record changes in the agent's own state, such as moving from "gathering details" to "awaiting approval". The GenAI conventions do not define an operation for this today. Teams usually emit a custom span or a span event with the old and new state as attributes. It is worth the effort for agents with approval gates or long-running workflows.
Memory-operation spans
Record reads and writes to agent memory. The conventions define operations such as search_memory and update_memory. These spans answer the context question directly. When an agent acts on stale information, the memory span can show what it retrieved, but only if that content was captured. Some tracing SDKs capture sensitive content by default, so set a capture policy before relying on it.
A tool-call span with manual instrumentation in Python looks like this:
from opentelemetry import trace

tracer = trace.get_tracer("support-agent")


def traced_lookup_order(order_id: str, call_id: str, conversation_id: str):
    with tracer.start_as_current_span("execute_tool lookup_order") as span:
        span.set_attribute("gen_ai.operation.name", "execute_tool")
        span.set_attribute("gen_ai.tool.name", "lookup_order")
        span.set_attribute("gen_ai.tool.call.id", call_id)
        span.set_attribute("gen_ai.conversation.id", conversation_id)
        return lookup_order(order_id)  # your existing tool function
This example assumes the OpenTelemetry SDK is already configured with a tracer provider and an exporter. Without that setup, the API returns a no-op tracer and no spans reach a backend. When this runs inside the active agent span, the tool span becomes its child automatically. Across process boundaries, that parent link holds only if trace context is propagated. For MCP tools, the per-call fields that matter overlap heavily with MCP server monitoring, including what you should never write to a span.
Key Metrics to Track
Traces explain individual runs. Metrics tell you whether agent quality is moving across many runs. Most of these are computed from production traces rather than emitted directly.
| Metric | What It Tells You | How to Measure It |
|---|---|---|
| Task completion rate | Whether the agent achieves the user's goal | Share of traces whose outcome passes a task-level check or evaluator |
| Tool-call accuracy | Whether the agent picks the right tool with valid arguments | Tool-call spans scored against expected tools, or flagged by an evaluator |
| Latency per step | Which step is slow, not just the total | Duration of each LLM, tool and memory span, split by span type |
| Token usage per task | What a completed task costs | Sum of input and output tokens across all LLM spans in a trace |
| Production failure rate | How often runs end in an error or an unusable result | Traces with an error status, abandoned runs, or failed evaluations |
| User feedback rate | How real users rate the outcome | Thumbs up or down and escalations, attached to the trace ID |
Per-step latency matters because an agent's end-to-end time is built from many steps. When steps run in parallel, their durations overlap, so explain wall-clock latency through the critical path rather than by summing spans. One slow tool can hide inside a normal-looking total. Token usage per task is different from token usage per request. A single task can make several model calls, and that per-task total is what cost reviews need. Tokens are not a uniform cost unit, though. Prices differ by model, between input and output tokens, and for cached tokens.
Cost per provider, time to first token and per-provider error rates belong at the gateway layer. They are covered in WSO2's AI gateway observability guide linked earlier.
Connecting Observability to Evaluation
Traces show what happened. Evaluation decides whether it was good. The two use the same data, which is why most teams connect them early.
Offline evaluation: Runs an agent against a fixed set of tasks before release. You compare outputs and execution paths against expected results. Offline evaluation catches regressions when you change a prompt, a model or a tool. Its limit is coverage. A test set only contains the cases someone thought to write down.
Online evaluation: Scores production traces after they happen. Evaluators read the trace and attach a score. Some are rule-based checks, such as "the reply is valid JSON" or "no write tool ran without a lookup first". Others use LLM-as-a-judge scoring for qualities like relevance or tone. Online evaluation can surface cases nobody predicted, because it runs on real user traffic. It only sees traces that were instrumented and retained, so report sampling policy and coverage alongside the scores.
The loop between the two is where agent quality improves. A production trace that fails an online evaluator becomes a new case in the offline set. The next release is tested against it before it ships.
The OpenTelemetry GenAI conventions include a gen_ai.evaluation.result event with a metric name, a score and an explanation. That gives evaluation scores a standard place on the trace, next to the spans they judge. User feedback fits the same pattern. Attach it to the trace ID so that low ratings point to a specific run.
Implementing Agent Observability Without a Six-Month Project
You do not need a custom tracing platform to start. Most teams combine three approaches.
Automatic instrumentation comes first. Many agent frameworks already emit traces. The OpenAI Agents SDK, for example, traces runs by default, including LLM generations, tool calls, handoffs and guardrails. That tracing is its own integration and exports to OpenAI's backend by default. Sending it to another backend needs an added trace processor or a supported integration. Instrumentation libraries cover other open source frameworks. Check what your framework produces before writing any code.
Manual instrumentation fills the gaps. Custom tools, internal workflows and state transitions rarely appear in auto-instrumented traces. Add spans by hand for the steps you need to debug, following the GenAI attribute names where they exist.
OpenTelemetry as the fallback keeps your options open. When a framework has no native tracing, or uses its own format, emit OTLP directly. Any OTLP-compatible backend can receive it, so the choice of tracing tool stays separate from the choice of agent framework.
One default deserves attention on day one. Content capture is often on by default, and the OpenAI Agents SDK includes sensitive data in traces unless you turn it off. Decide what prompts, arguments and outputs may leave the process before you export anything.
The decision to invest beyond the basics usually follows an operational trigger, not a traffic number. Common triggers include:
- Agents that route across several models or providers
- Finance asking for spend attribution by team or agent
- Regulated data appearing in prompts or tool arguments
- Multiple teams shipping agents that share tools or memory
- Production incidents that took too long to explain
How WSO2 Approaches Agent Observability
WSO2 covers both observability layers within its Agent Platform. Each layer has its own traffic path.
The agent layer: WSO2 Agent Manager
WSO2 Agent Manager is positioned as an open control plane for AI agents. It brings identity, guardrails, observability and evaluation together for agents on any framework. Agent tracing is built on OpenTelemetry. Python agents deployed through the platform can be auto-instrumented for frameworks such as LangChain, LlamaIndex, CrewAI and Haystack, along with MCP client calls. Externally hosted Python agents can send traces by wrapping their start command with the amp-instrument CLI. Teams on other frameworks can emit spans manually against a published contract based on the OpenTelemetry GenAI conventions.
Evaluation runs on those traces after the agent finishes, so it stays off the agent's response path. It still consumes compute, and sampled-out traces are not available to evaluation monitors. Built-in rule-based and LLM-as-judge evaluators, plus custom ones, can score a whole trace or each agent within a multi-agent trace. Continuous monitors score new production traces on a schedule. Historical monitors score a fixed time window once. Scores appear in the trace view, next to the spans they judge.
The traffic layer: WSO2 AI Gateway
The WSO2 AI Gateway governs outbound LLM traffic to model providers and inbound agent access to MCP tools. Its components export traces over OTLP to any compatible backend. It can also export analytics events as OTLP log records. For that analytics export, the docs state that a slow or unreachable OTLP endpoint does not add latency to API calls.
The two layers see different paths, and none of them is a mandatory chain:
- Inbound requests go from a client or application to the agent.
- Outbound model calls go from the agent to an LLM provider, optionally through the AI Gateway.
- Tool calls go from the agent to MCP servers or APIs, optionally through the AI Gateway.
- Telemetry export runs separately from all three. The agent sends spans to Agent Manager, and the gateway exports its spans and analytics to an OTLP collector.
Because both layers use OpenTelemetry, teams that already run Datadog, Langfuse or another platform can route the data there. OTLP support does not guarantee the same dashboards, though, and backends may interpret the developmental GenAI attributes differently. The aim is to cover both layers without forcing teams off the evaluation or experimentation tools they already use.
Conclusion
Agent observability is about the decision record, not uptime. A trace that links reasoning, LLM calls, tool calls and state across a full task lets you explain a bad outcome. The four span types give you a practical starting set. Tool-call, reasoning, state-transition and memory-operation spans map closely to the questions you will ask during an incident.
Start with your framework's built-in tracing, add manual spans where it falls short, and keep OpenTelemetry as the format between layers. Then connect production traces to evaluation so failures become test cases. If you want agent tracing and evaluation in the same control plane as identity and guardrails, explore WSO2 Agent Manager.
Frequently Asked Questions
What is agent observability?
Agent observability is the capture and analysis of traces from AI agent runs. It shows the reasoning, model calls, tool calls and state behind each result.
What is AI agent observability?
It is the same discipline applied to AI agents in production. The focus is behavior quality, such as task success and tool choice, rather than uptime alone.
What should I track for agent observability?
Start with tool-call, reasoning, state and memory spans on every run. Then track task completion, tool-call accuracy, per-step latency, tokens per task and failure rate.
Is OpenTelemetry ready for agent tracing?
Its GenAI conventions are usable, but as of October 2026 they are still in Development status and names may change.